Sample Category Title
USD/JPY Outlook: Advances 1% on Wednesday Morning
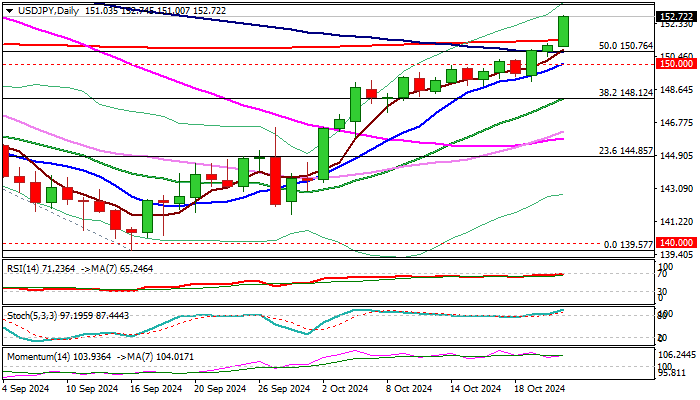
Strong acceleration higher in Asian / early European trading on Wednesday (the pair was up 1%) pushed the USDJPY’s price to new multi-week highs, last traded in late July.
Recent break of psychological 150 barrier was followed by emerge from thick daily Ichimoku cloud and lift above next pivot at 150.76 (100DMA / 50% retracement of 161.95/139.57 descend) set the scope for acceleration through 200DMA (151.36) and round-figure resistance at 152.00.
The Dollar received fresh boost from revised view on Fed monetary policy towards gradual rate cuts, while markets keep an eye on US presidential elections, as growing expectations of Trump’s victory mark another supportive factor for the dollar.
Daily close above 200DMA to confirm fresh bullish signal for further advance, with Friday’s close above rising weekly cloud, to validate strong bullish structure.
Bulls pressure target at 153.40 (Fibo 61.8%) but may face headwinds as daily studies are overbought.
Shallow dips to mark positioning for further advance with 200DMA now acting as initial support (151.36), followed by broken Fibo / 100DMA / daily cloud top (150.70 zone) where dips should find a footstep and keep intact pivotal 150 support, reinforced by 10DMA.
Res: 150.00; 150.76; 151.00; 151.40.
Sup: 149.16; 149.00; 148.86; 148.12.
EUR/USD Outlook: Break 1.0800 Support But Bears May Take a Breather on Oversold Conditions
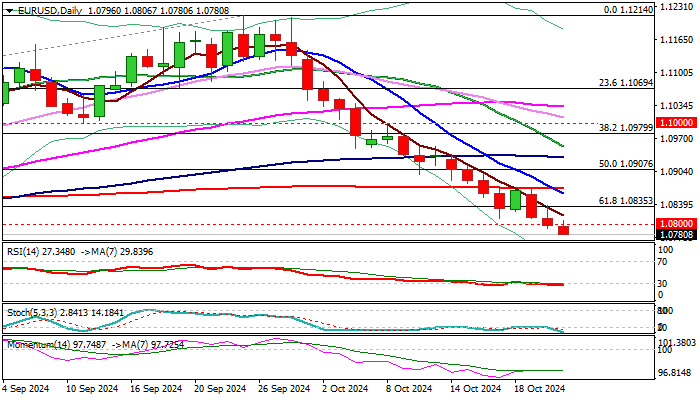
EURUSD dipped below psychological 1.08 support and hit new multi-week low in early Wednesday.
Larger bears remain firmly in play and reinforced by the most recent formation of 10/200DMA death cross, with daily close below 1.08 to reinforce bearish stance.
However, oversold RSI and 14-d momentum in sideways mode suggest that the downtrend may be running out of steam.
Bears approached support at 1.0777 (Aug 1 higher low) and eye another significant point at 1.0745 (Fibo 76.4% of 1.0601/1.1214 uptrend) where fresh headwinds could be expected.
Upticks are likely to be limited and provide better selling opportunities, with broken Fibo 61.8% (1.0835) to ideally cap and potential extended upticks to stay below 200DMA (1.0870, also Oct 17/21 lower platform) to keep larger bears intact.
Break of 1.0745 pivot to open way for test of 1.0670 zone (June higher base) and unmask key med-term support at 1.0601 (2024 low, posted on Apr 16).
Res: 1.0800; 1.0835; 1.0870; 1.0907.
Sup: 1.0777; 1.0745; 1.0700; 1.0676.
Nikkei 225 Index Resumes Its Decline?
In mid-October, the Nikkei 225 index attempted to break through the psychological barrier of 40,000 points but ultimately reversed direction.
This week, the index has continued its downward trend, driven by concerns surrounding the upcoming elections for Japan's House of Representatives scheduled for October 27. According to Reuters, the ruling Liberal Democratic Party (LDP) and its coalition partner, Komeito, may lose their majority in the elections.
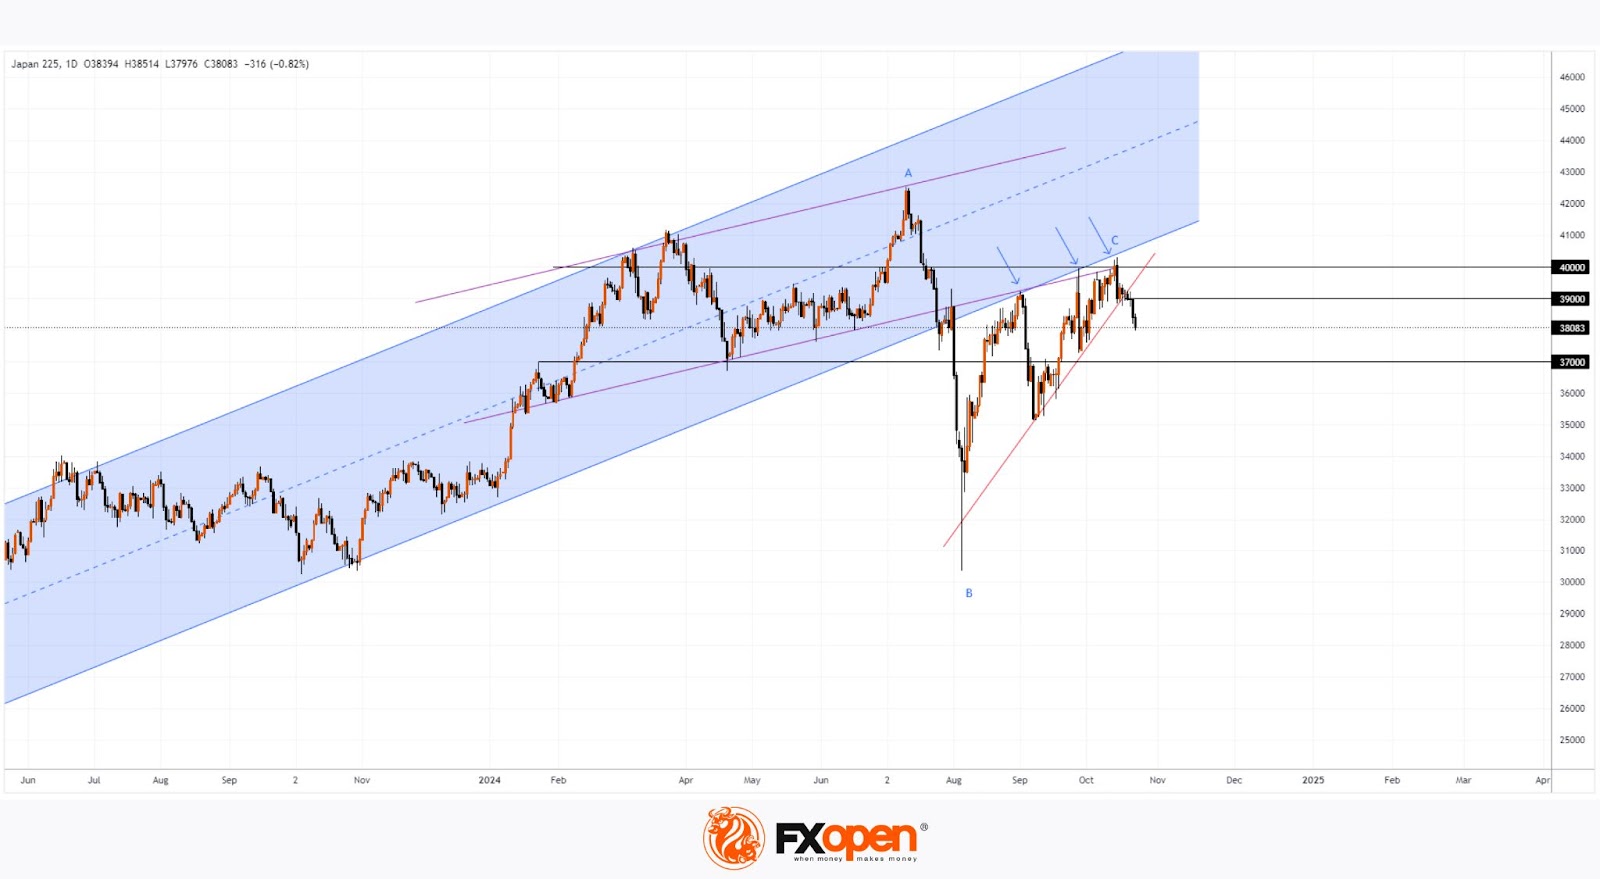
Meanwhile, technical analysis of the Nikkei 225 chart reveals several bearish indicators:
→ The lower bounds of both the previously active blue and purple ascending channels have acted as resistance, along with the noted 40,000 level.
→ The price has broken below the ascending trend line (marked in red) around 39,000, suggesting that bears have gained enough strength to push through. Consequently, the 39,000 level may now serve as resistance.
Overall, the situation appears increasingly concerning. Could the rise from point V to C be merely a corrective move following the downward impulse from A to B? If so, a downward reversal from 40,000, coupled with a bearish breach of the trend line, could signal a resumption of the downtrend, potentially leading to a decline towards the 37,000 level, which has previously interacted with the price on multiple occasions.
Trade global index CFDs with zero commission and tight spreads. Open your FXOpen account now or learn more about trading index CFDs with FXOpen.
This article represents the opinion of the Companies operating under the FXOpen brand only. It is not to be construed as an offer, solicitation, or recommendation with respect to products and services provided by the Companies operating under the FXOpen brand, nor is it to be considered financial advice.
Crypto Market Undergoes Correction
Market Picture
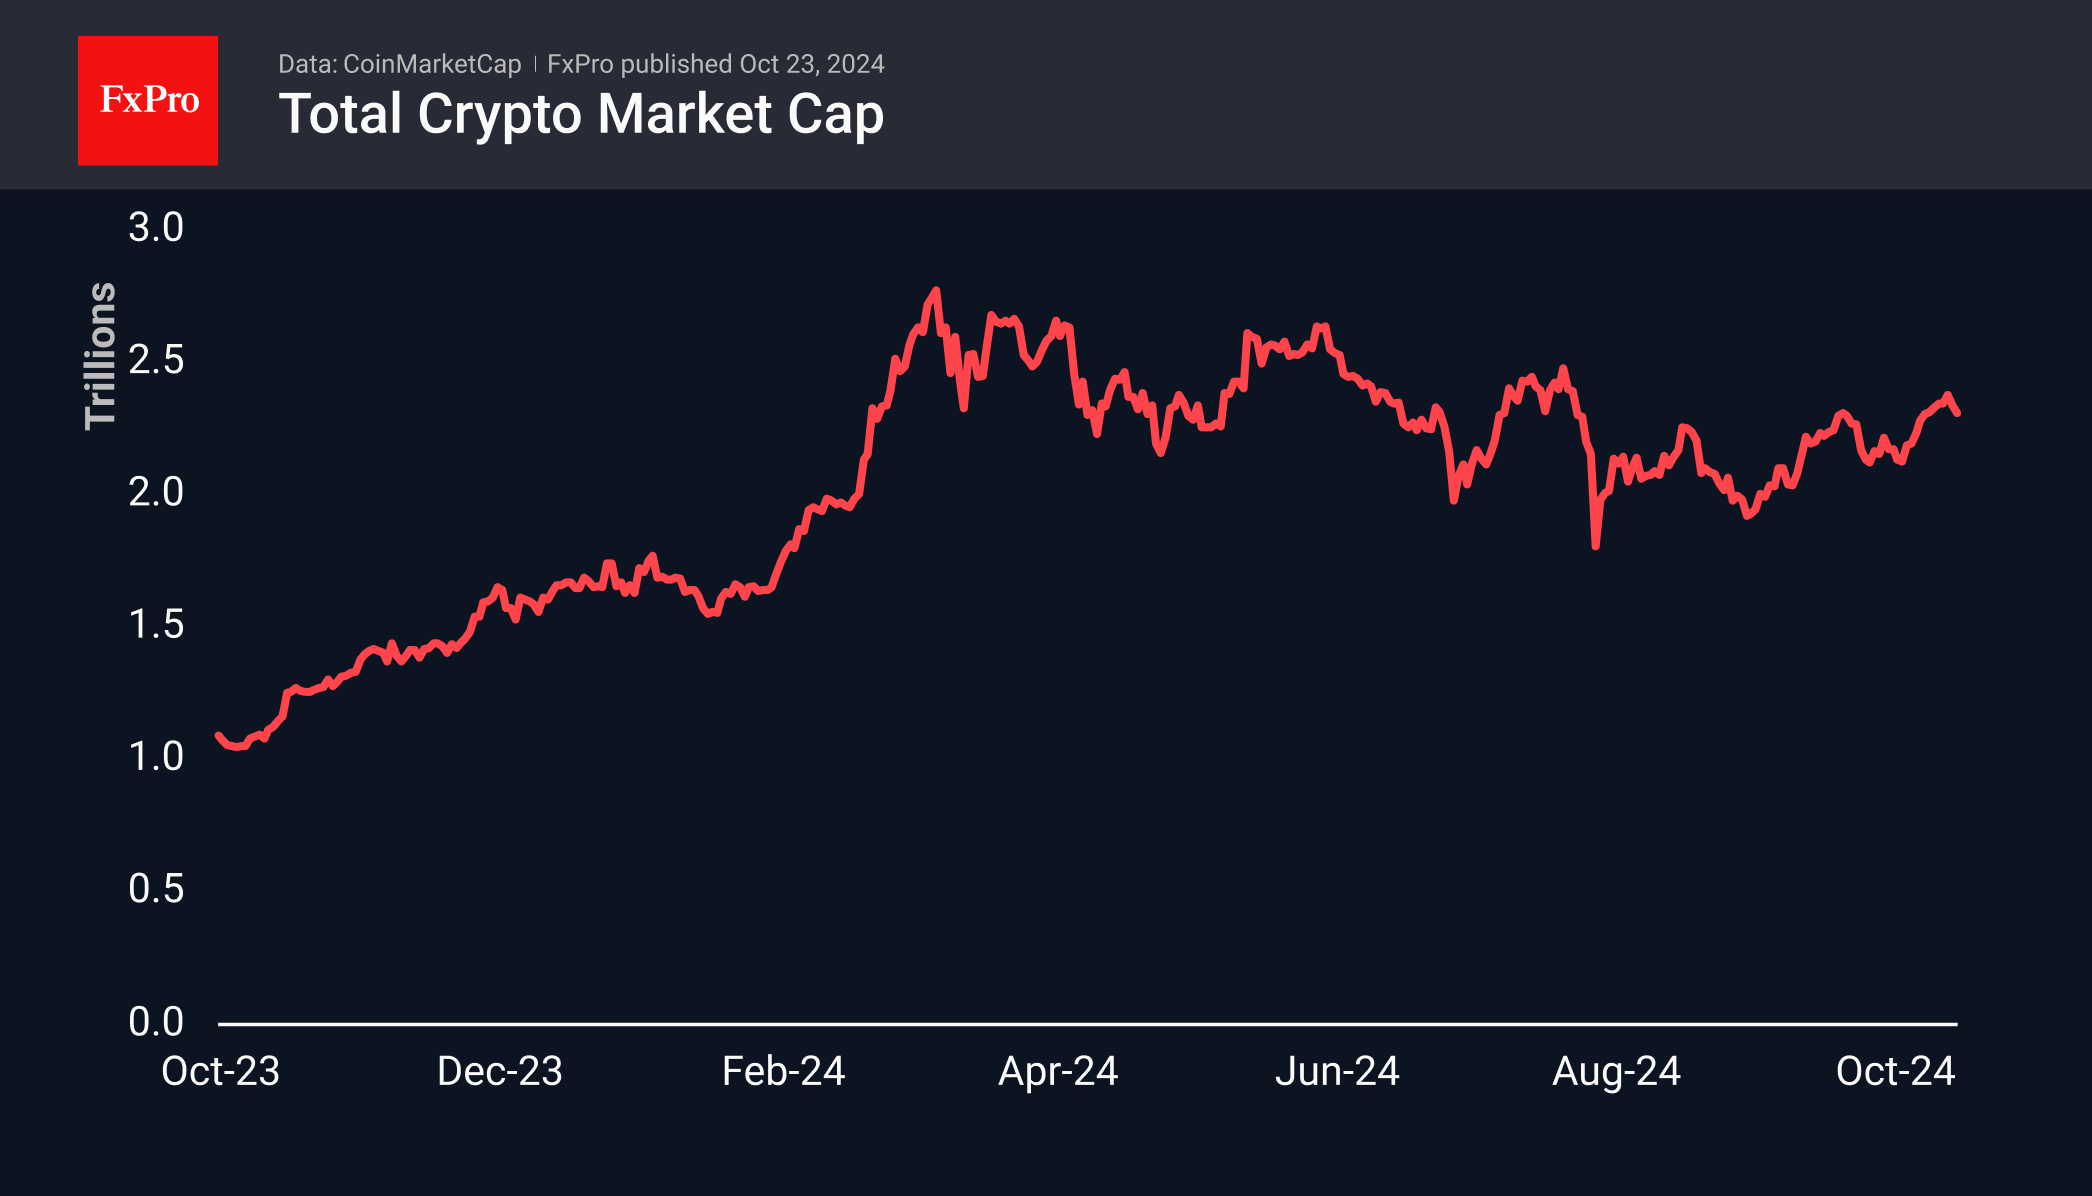
The crypto market is developing a correction at a moderate pace. It has lost 1.3% more over the last day to $2.31 trillion, down around 3% from the recent peak. At the same time, the sentiment of greed persists. The corresponding index is in the 70-73 range for the eighth day.
Ethereum continues to lose market share to Bitcoin and other altcoins. As a result, BTC’s share of all cryptocurrency capitalisation has risen to 57.3%, the highest since April 2021.
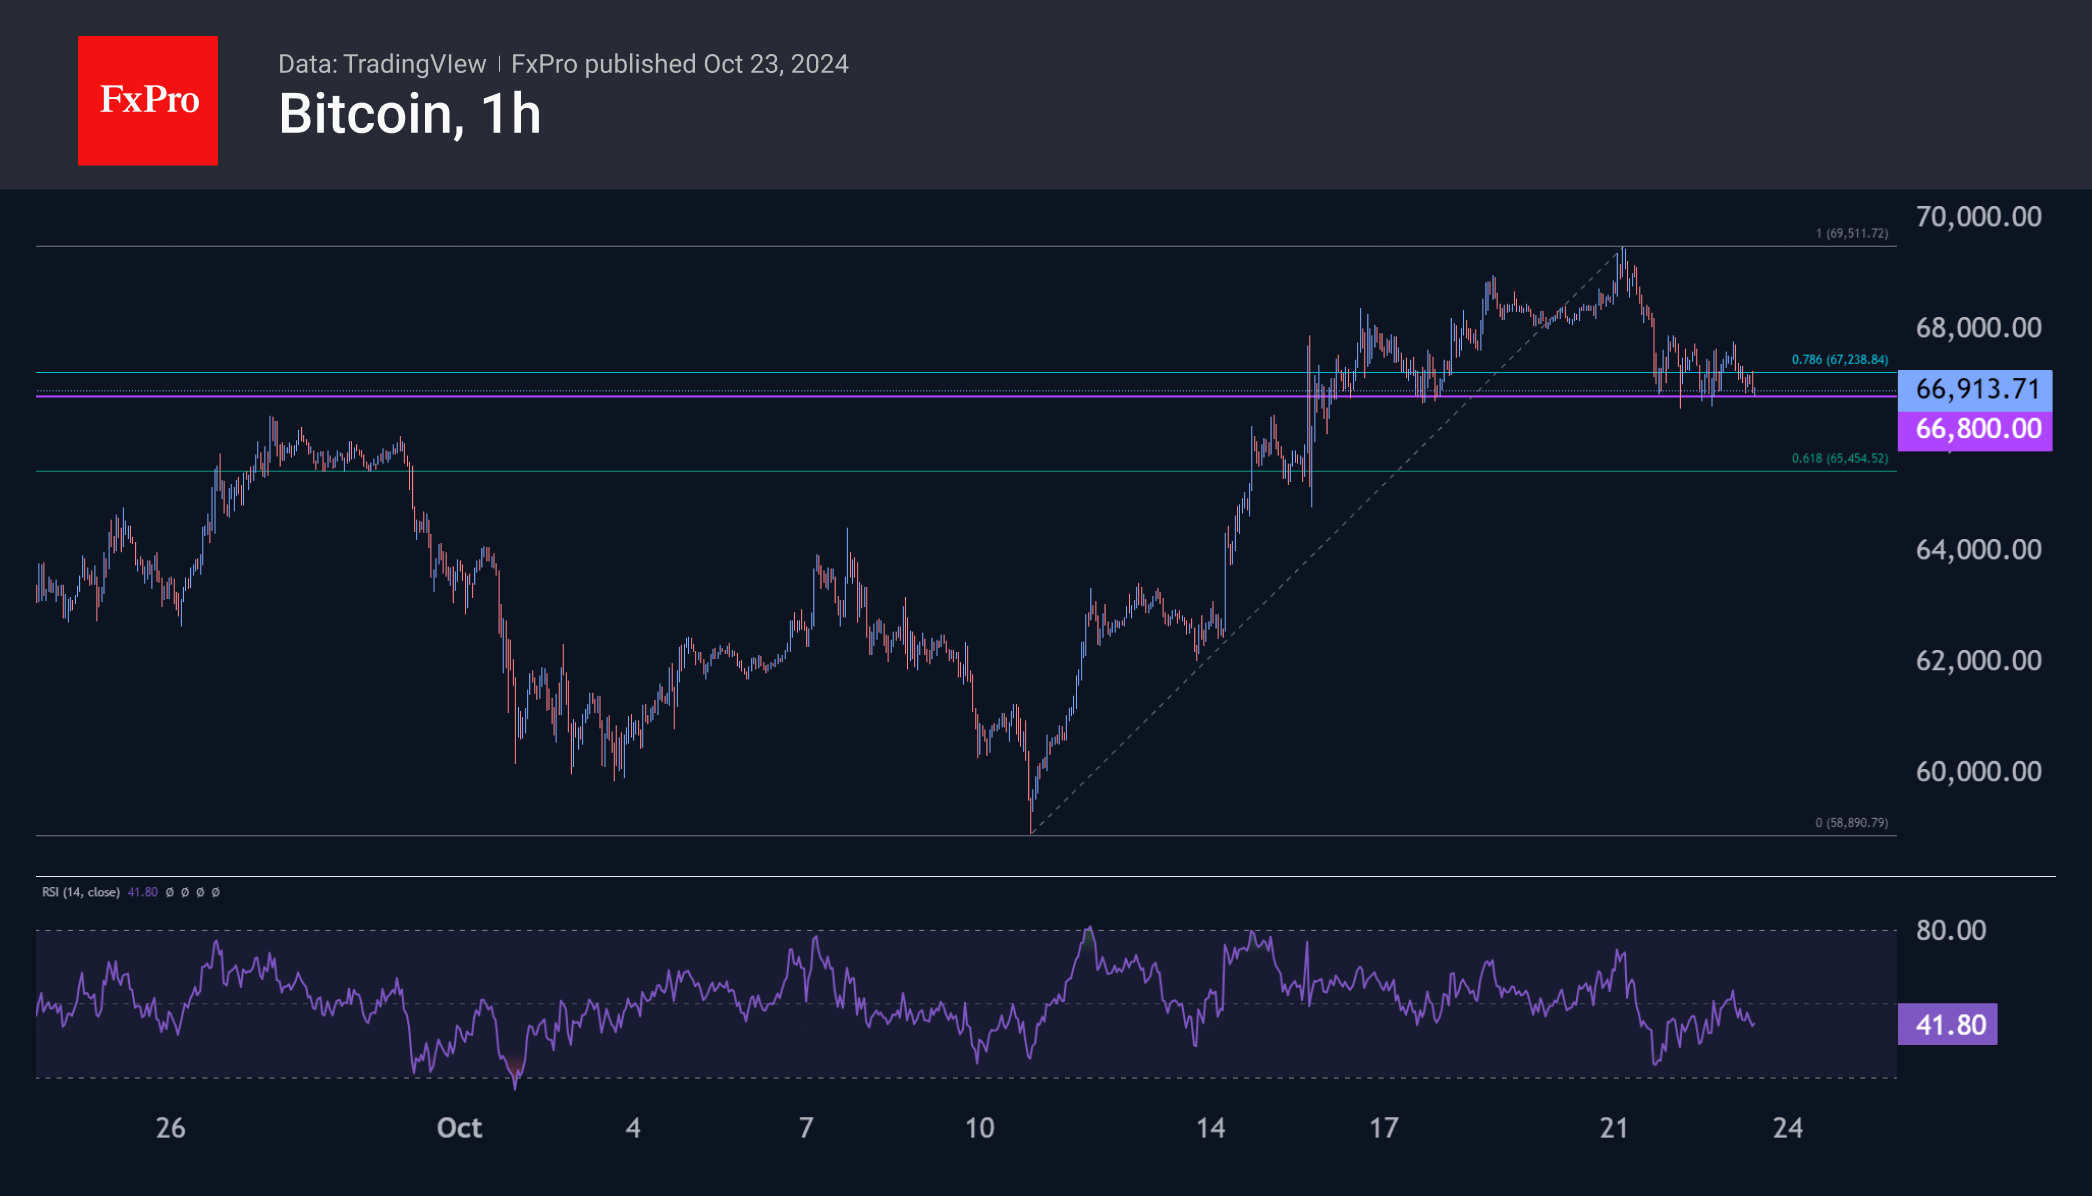
But that doesn’t necessarily mean an upward trend for the top cryptocurrency, which has pulled back below $67K, losing 1% in the last day and nearly 4% from its peak on 21 October. The price is now close to a local support level at $66.8K. A break of this support will open the way for a deeper correction to $65.5K, near the 61.8% retracement level from the last rally and the late September top.
News Background
Options traders have increased bets on Bitcoin to rise above $80K following the US election. Donald Trump, who is seen as more friendly to cryptocurrencies, has an estimated 63.5% chance of winning.
QCP Capital sees a high probability that Ethereum will break through the $2800 resistance level and reach $3000 as the US election is just two weeks away.
According to media reports, Indian authorities are considering significantly restricting or outright banning private cryptocurrencies, as unlike CBDC, they do not meet the requirements of financial inclusion and security.
German-listed mining company Northern Data is considering selling its Bitcoin mining division, Peak Mining, to focus on AI.
The Bitcoin miner, which mined its first coins on 13 January 2009, has sold a total of $9.6 million worth of BTC, according to Arkham Intelligence. That old whale still has 1,077 BTC worth $72.4 million.
S&P500 Risks Correction Ahead of Elections
The US S&P500 and Dow Jones indices closed lower on Monday and Tuesday. The Nasdaq100 followed suit yesterday. The Russell 2000 index of small public companies lost for four consecutive sessions. There are signs that we are now seeing the beginning of a correction like the one we saw in August, and there is also the risk of a bear market beginning.
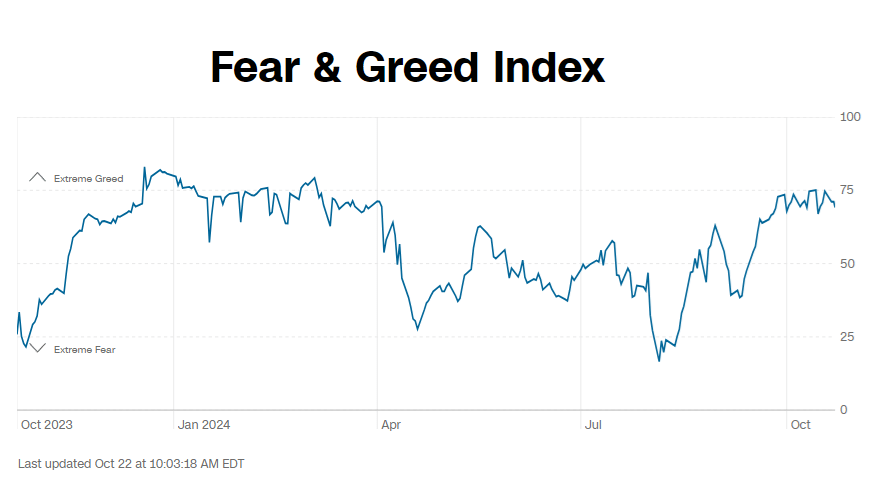
CNN’s Fear and Greed Index has been mostly in the 70-75 range since late September – on the cusp of extreme greed. A market correction often accompanies a pullback from current highs into neutral territory.
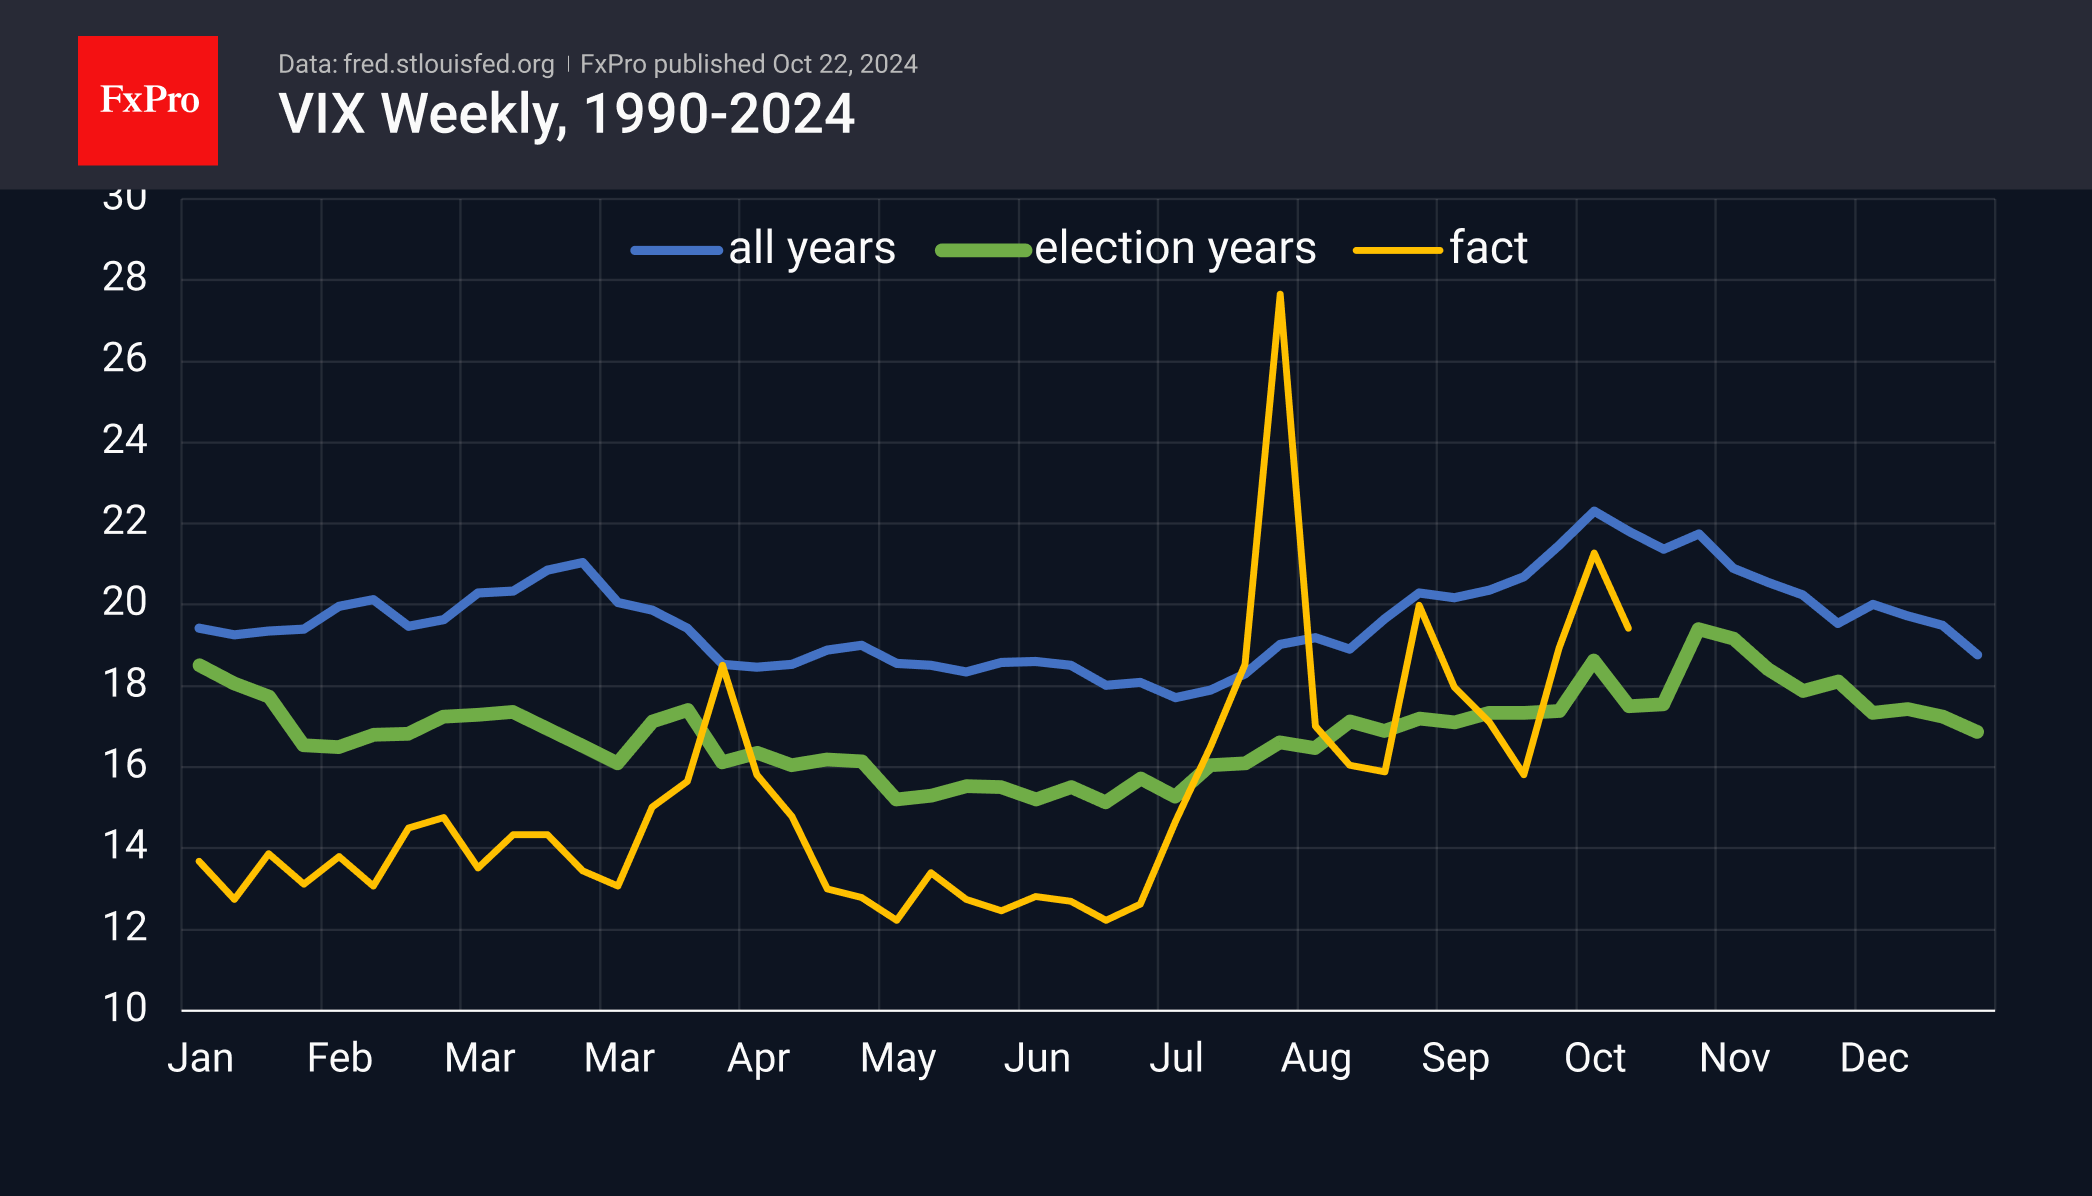
The VIX volatility index jumped above 20 in early October, indicating heightened nervousness, which is unusual in situations where historical highs are being systematically updated. Historically, however, current levels are lower than typical for this time of year, although slightly higher than in US presidential election years.
Let’s look at the dynamics rather than the absolute levels of the VIX. We are entering an important period of highest volatility, covering the week before and the week after the election. Volatility is often synonymous with falling markets.
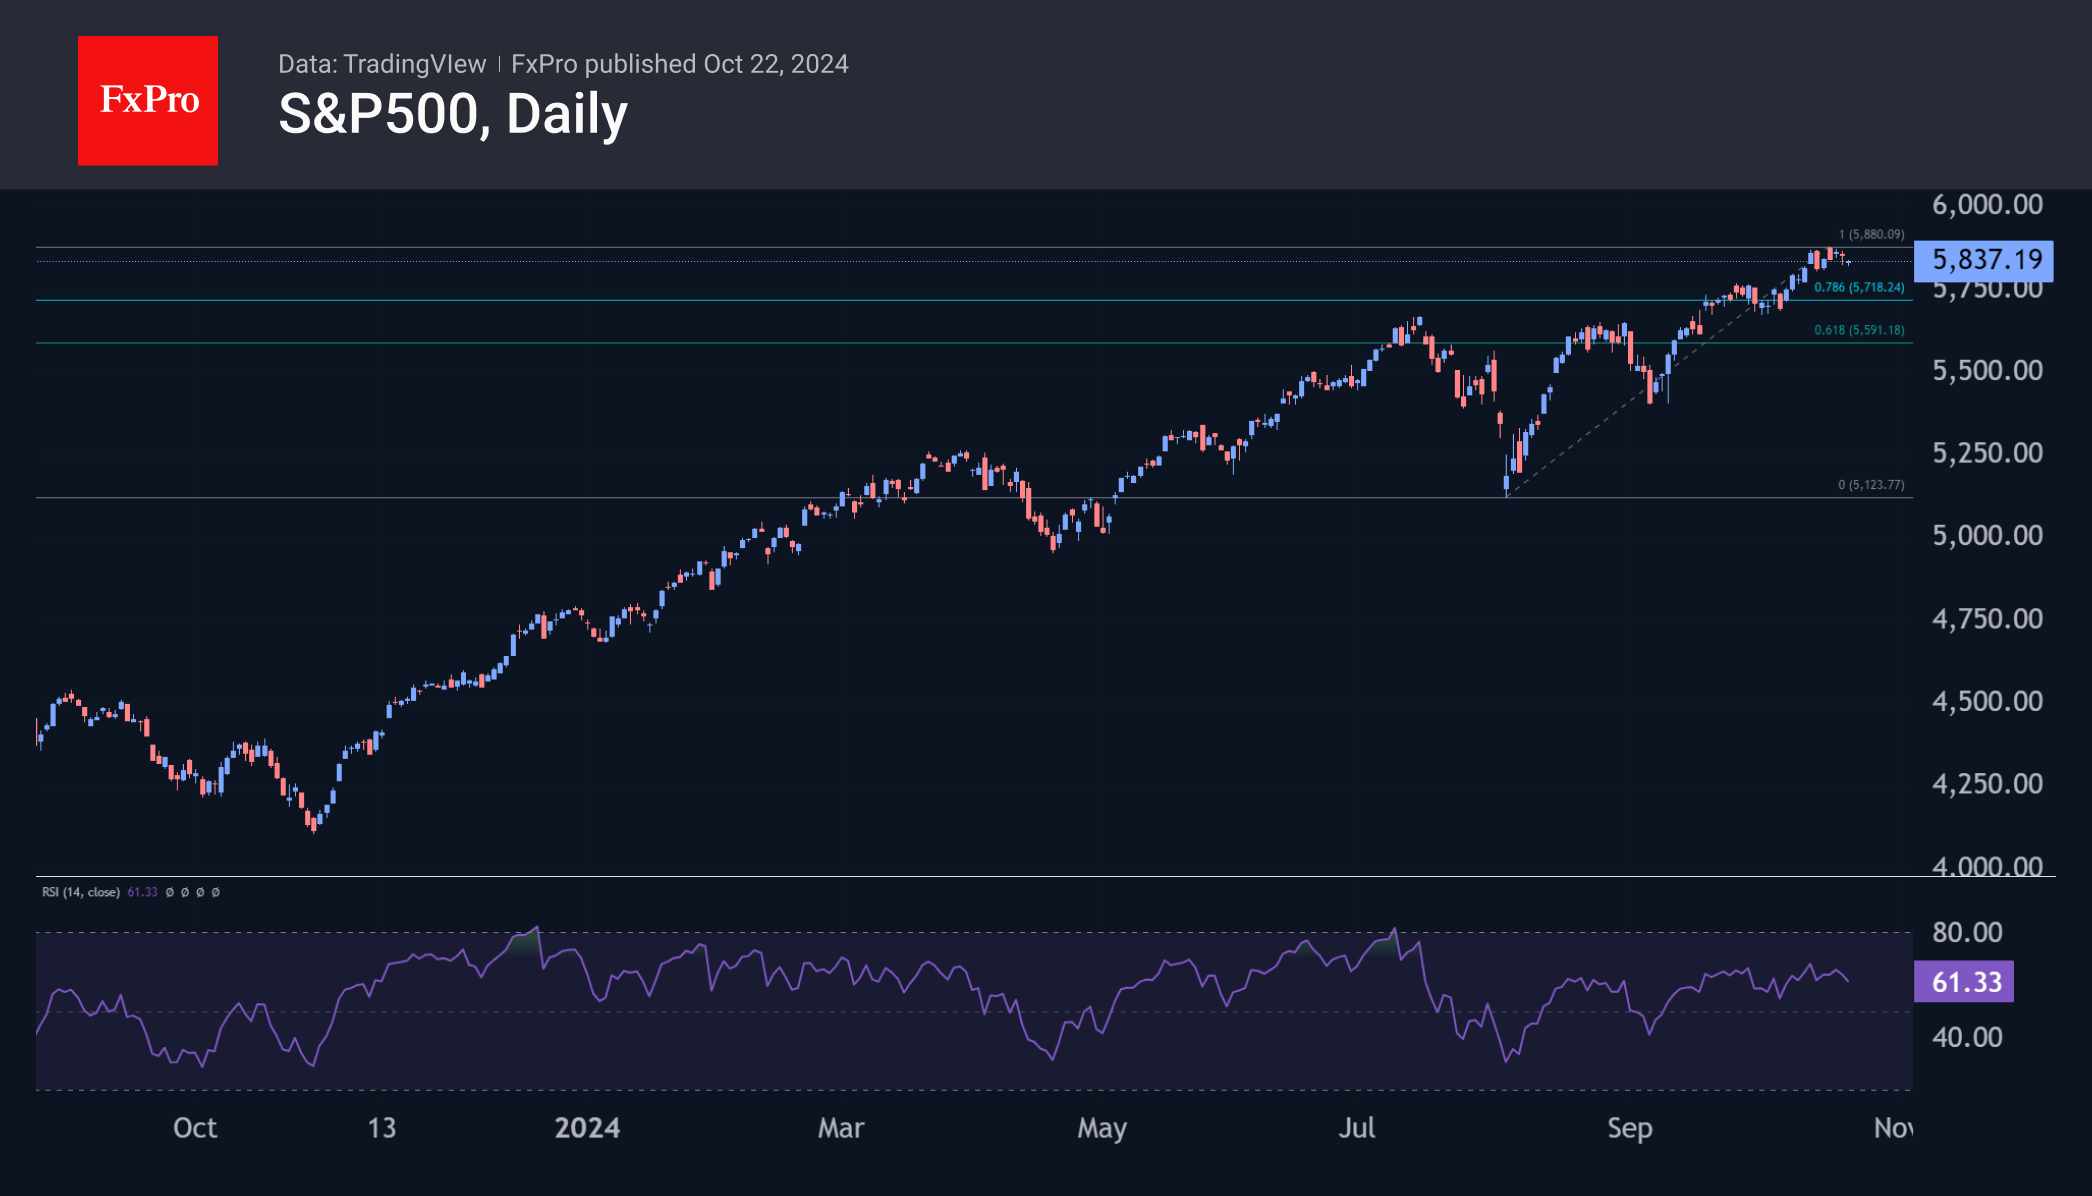
This decline also looks logical, given the typical pre-election uncertainty. This time, it is prolonged in the US due to a very close race between the candidates, with no clear winner yet. Separately, we look at the RSI and price divergence for the S&P500: the price is well above the July peak, while the Relative Strength Index peaked at 70 at the beginning of last week and has already fallen back to 59.
The risks for financial markets in the coming weeks are, therefore, tilted to the downside. Using the Fibonacci pattern, the 5600-5700 area for the S&P500 is a potential correction target if the markets do not dig deeper.
Gold Rallies To New ATH, WTI Crude Oil Eyes Recovery
Gold price started a fresh surge above $2,720. Crude oil is recovering and might rise toward the $73.85 resistance zone.
Important Takeaways for Gold and Oil Prices Analysis Today
- Gold price started a strong increase from the $2,645 zone against the US Dollar.
- A major bullish trend line is forming with support at $2,735 on the hourly chart of gold at FXOpen.
- Crude oil is recovering losses and trading above the $70.50 support.
- There was a break above a connecting bearish trend line with resistance near $70.00 on the hourly chart of XTI/USD at FXOpen.
Gold Price Technical Analysis
On the hourly chart of Gold at FXOpen, the price formed support near the $2,645 zone. The price remained in a bullish zone and started a fresh increase above $2,680.
The bulls even pushed the price above the $2,720 level and the 50-hour simple moving average. Finally, it traded to a new all-time high at $2,748. The price is now consolidating gains near the $2,745 zone and the RSI is above 50.
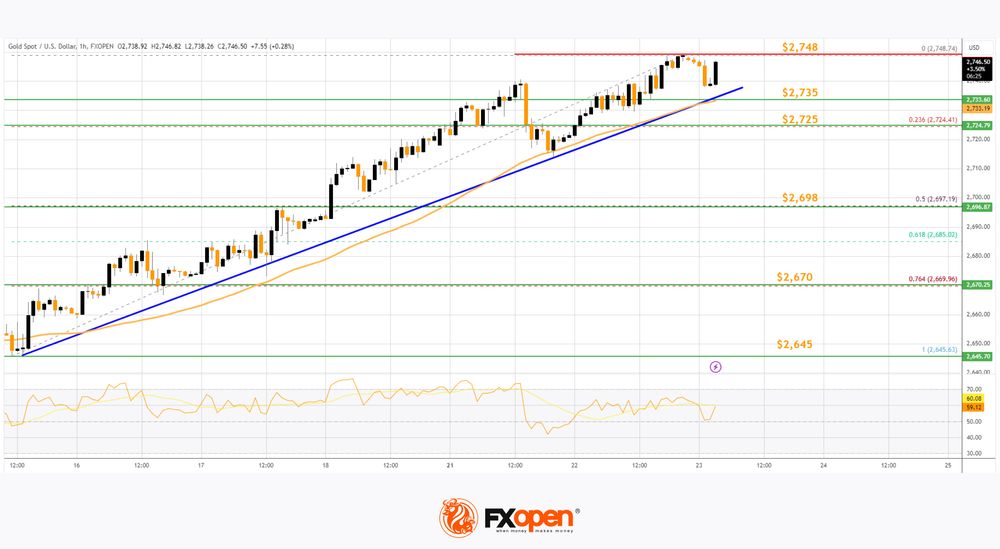
Initial support on the downside is near a major bullish trend line at $2,735 and the 50-hour simple moving average. The next support sits near the 23.6% Fib retracement level of the upward move from the $2,645 swing low to the $2,748 high at $2,725.
The first major support is near the $2,700 zone or the 50% Fib retracement level of the upward move from the $2,645 swing low to the $2,748 high.
If there is a downside break below the $2,700 support, the price might decline further. In the stated case, the price might drop toward the $2,670 support. Immediate resistance is near the $2,748 level. The next major resistance is near the $2,750 level.
An upside break above the $2,750 resistance could send Gold price toward $2,765. Any more gains may perhaps set the pace for an increase toward the $2,780 level.
WTI Crude Oil Price Technical Analysis
On the hourly chart of WTI Crude Oil at FXOpen, the price found support near the $68.15 zone against the US Dollar. The price formed a base and started a recovery wave above $70.00 and the 50-hour simple moving average.
The bulls were able to push the price toward the 50% Fib retracement level of the downward move from the $75.61 swing high to the $68.13 swing low. Besides, there was a break above a connecting bearish trend line with resistance near $70.00.
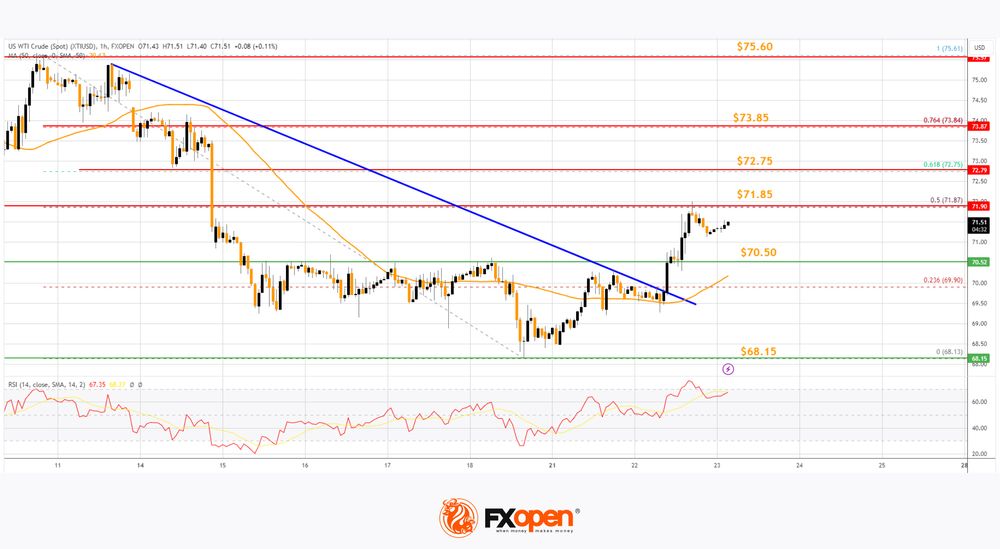
The hourly RSI is near the 70 level, but the price is struggling near $71.85. The next resistance is near the 61.8% Fib retracement level of the downward move from the $75.61 swing high to the $68.13 swing low at $72.75.
A clear move above the $72.75 could send the price toward the $73.85 resistance. Any more gains might send the price toward the $75.60 level. Conversely, the price might start a fresh decline from the $71.85 resistance.
Immediate support sits near the $70.50 level. The next major support on the WTI crude oil chart is $68.15. If there is a downside break, the price might decline toward $66.00. Any more losses may perhaps open the doors for a move toward the $65.00 support zone.
Start trading commodity CFDs with tight spreads. Open your trading account now or learn more about trading commodity CFDs with FXOpen.
This article represents the opinion of the Companies operating under the FXOpen brand only. It is not to be construed as an offer, solicitation, or recommendation with respect to products and services provided by the Companies operating under the FXOpen brand, nor is it to be considered financial advice.
EURUSD Unlocks 1.0800 Critical Level
- EURUSD dived beneath medium-term uptrend line
- Remains well below 200-day SMA
- Momentum oscillators extend bearish bias
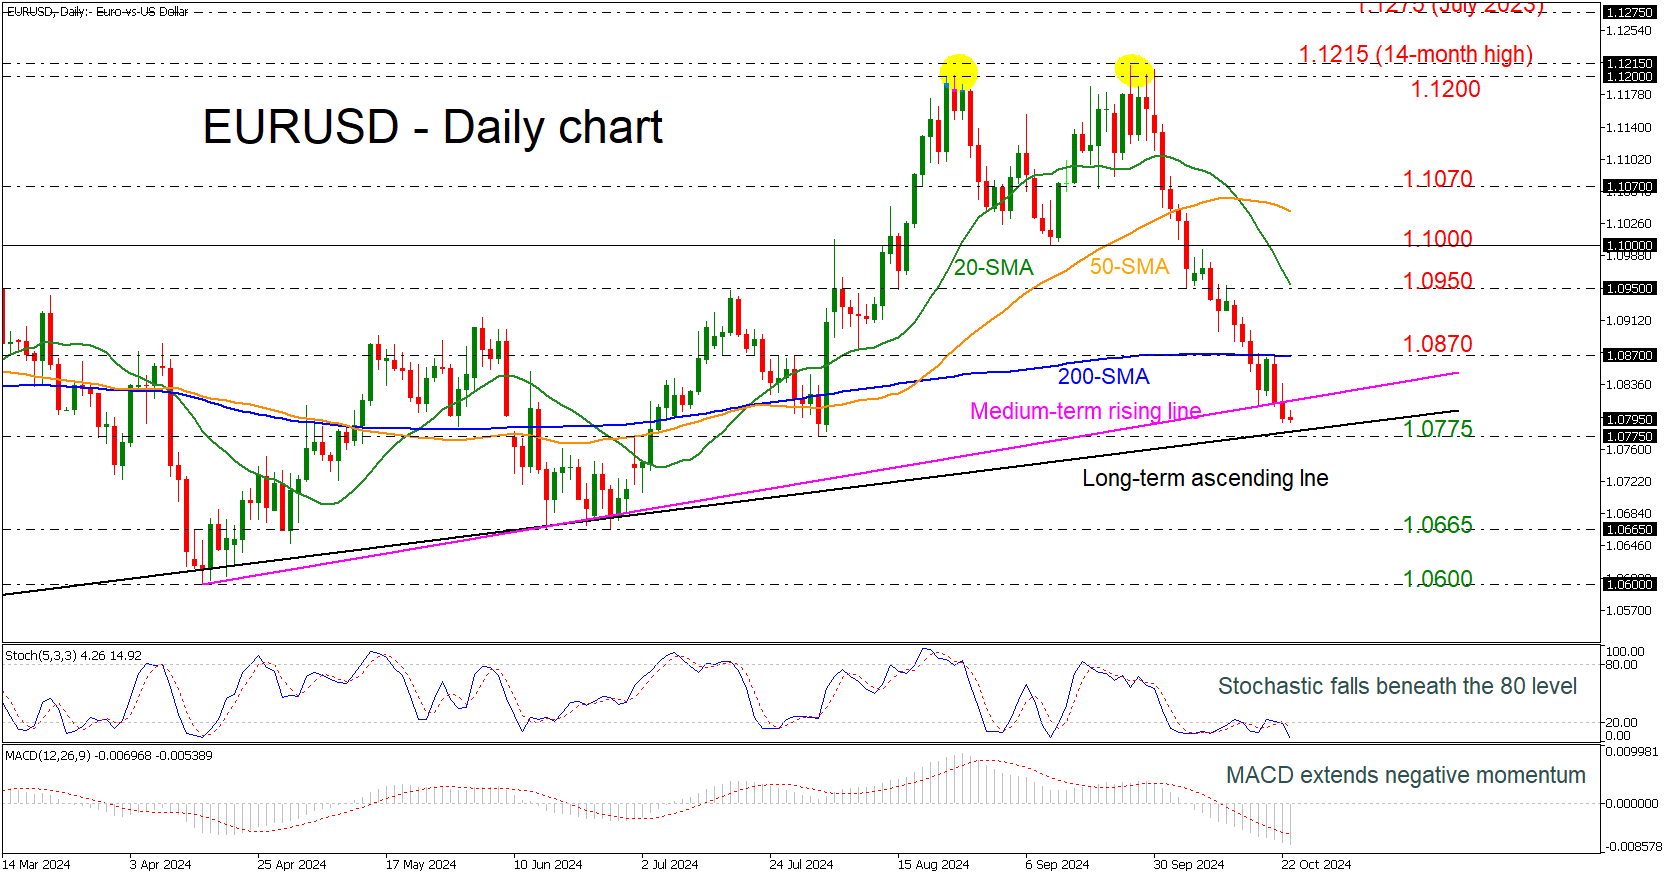
EURUSD tumbled beneath the medium-term ascending trend line, meeting a fresh almost three-month low below the 1.0800 round number. The pair lost 3.8% from the pullback at the 1.1215 resistance level, with the technical oscillators extending their negative momentum. The stochastic is still falling in the oversold territory, while the MACD is holding well below its trigger and zero lines.
If the market retreats further and the bears break the long-term uptrend line and the 1.0775 support, then they may switch the broader bullish outlook to bearish, flirting with the 1.0665 and the 1.0600 key levels.
In the positive scenario, a closing session above the 200-day simple moving average (SMA), which overlaps with the 1.0870 barrier, could drive traders toward the 1.0950 resistance. Moving higher, the 1.1000 psychological mark could halt upside movements.
In summary, the short-term view of EURUSD has been strongly negative since the end of September. However, a successful decline below the long-term rising trend line could shift the overall positive picture to a negative one.
GBP/JPY Daily Outlook
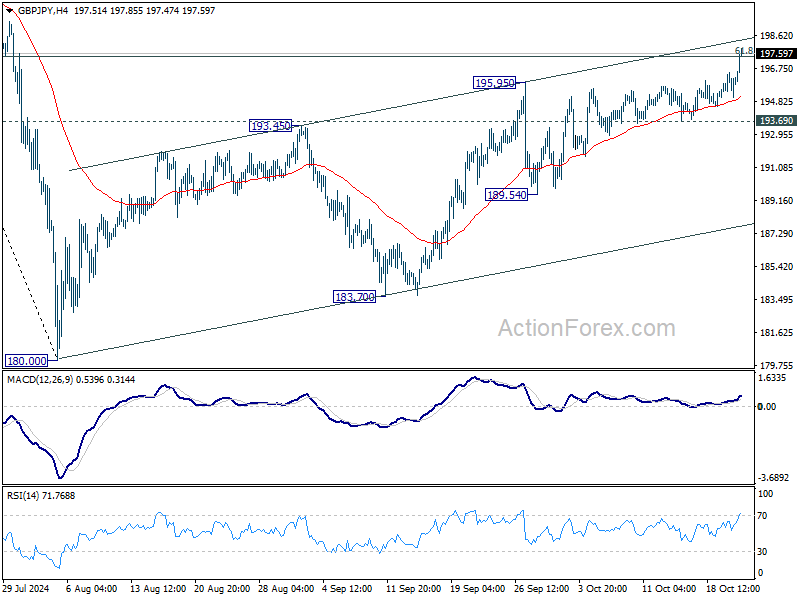
Daily Pivots: (S1) 195.36; (P) 195.95; (R1) 196.78; More...
Intraday bias in GBP/JPY stays on the upside as rise from 180.00 is extended. Sustained trading above 61.8% retracement of 208.09 to 180.00 at 197.35 will target 208.09 high. On the downside, break of 193.69 support is needed to indicate short term topping. Otherwise, further rally will remain in favor in case of retreat.
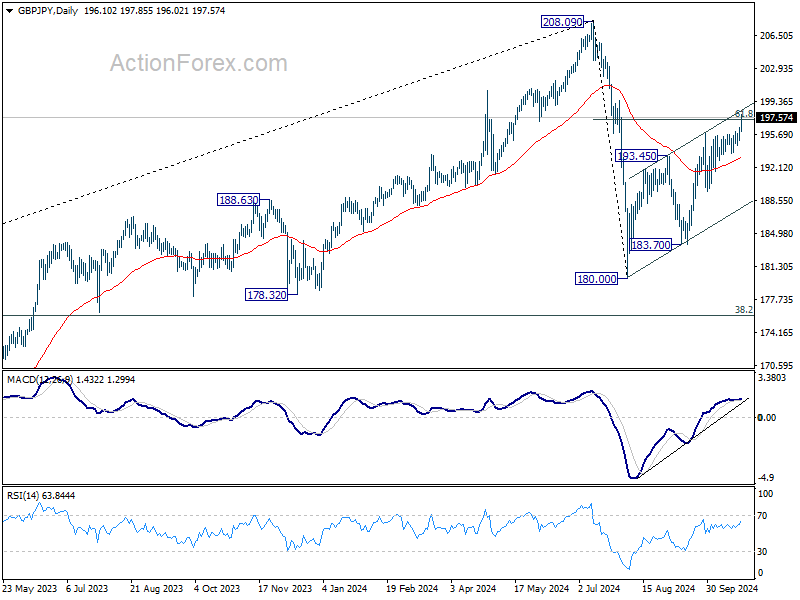
In the bigger picture, price actions from 208.09 are seen as a correction to whole rally from 123.94 (2020 low). The range of consolidation should be set between 38.2% retracement of 123.94 to 208.09 at 175.94 and 208.09. However, decisive break of 175.94 will argue that deeper correction is underway.
EUR/JPY Daily Outlook
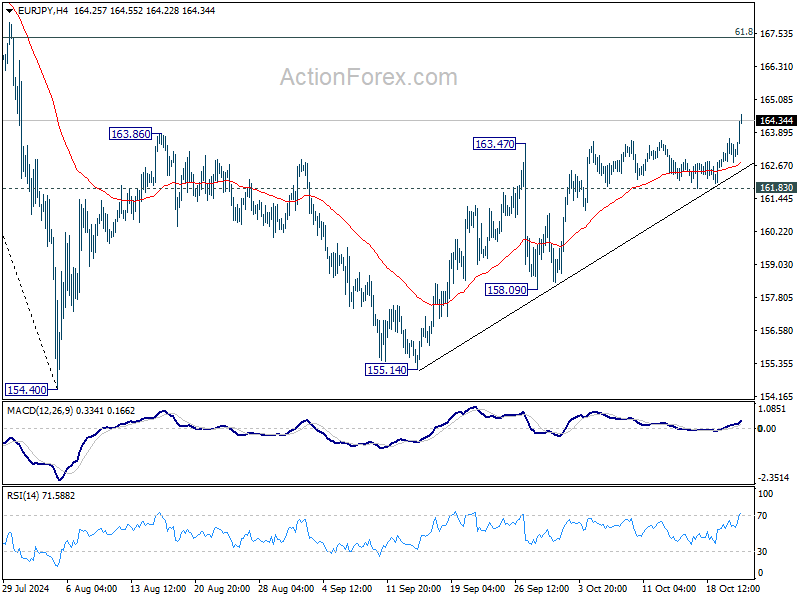
Daily Pivots: (S1) 162.74; (P) 163.20; (R1) 163.62; More....
EUR/JPY's rebound from 154.40 finally resumed by breaking through 163.86 resistance. Intraday bias is back on the upside for 61.8% retracement of 175.41 to 154.40 at 167.38. Su stained break there will pave the way to retest 175.41 high. On the downside, break of 161.83 support is needed to indicate short term topping. Otherwise, further rally will remain in favor even in case of retreat.
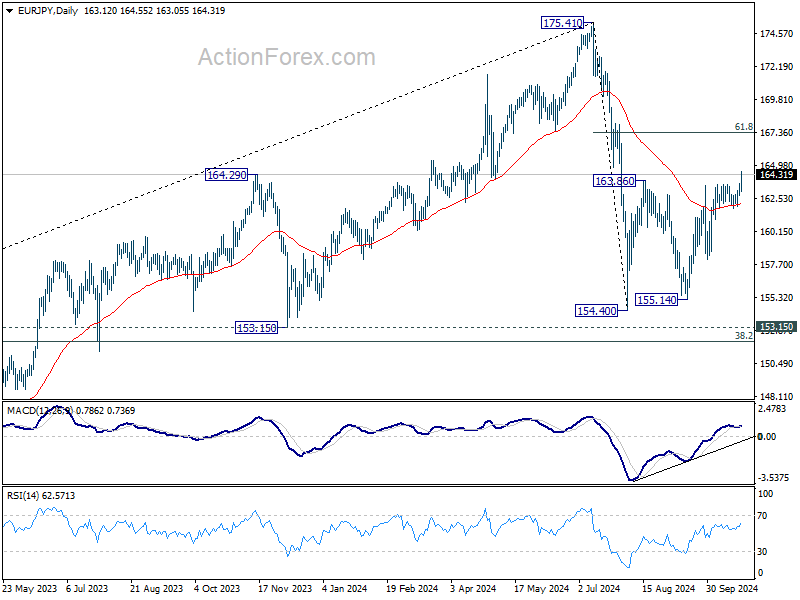
In the bigger picture, price actions from 175.41 are seen as correction to rally from 114.42 (2020 low). The range of consolidation should have been set between 38.2% retracement of 114.42 to 175.41 at 152.11 and 175.41 high. However, decisive break of 152.11 would argue that deeper correction is underway.
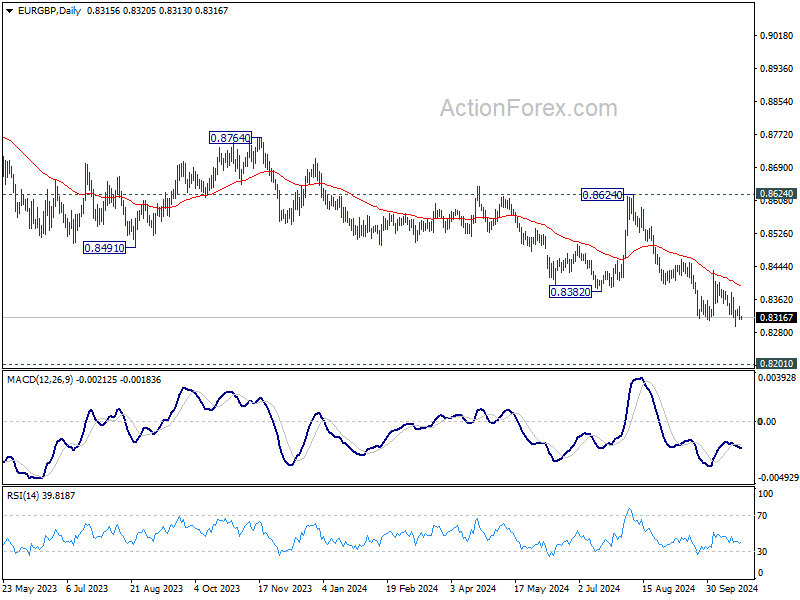
EUR/GBP Daily Outlook
Daily Pivots: (S1) 0.8304; (P) 0.8326; (R1) 0.8337; More...
No change in EUR/GBP outlook. As long as 0.8433 resistance holds, current down trend is still in progress for 0.8201 key support next. Strong support could be seen from there to bring rebound. But for now, break of 0.8433 resistance is needed to indicate short term bottoming. Otherwise, outlook will stay bearish in case of recovery.
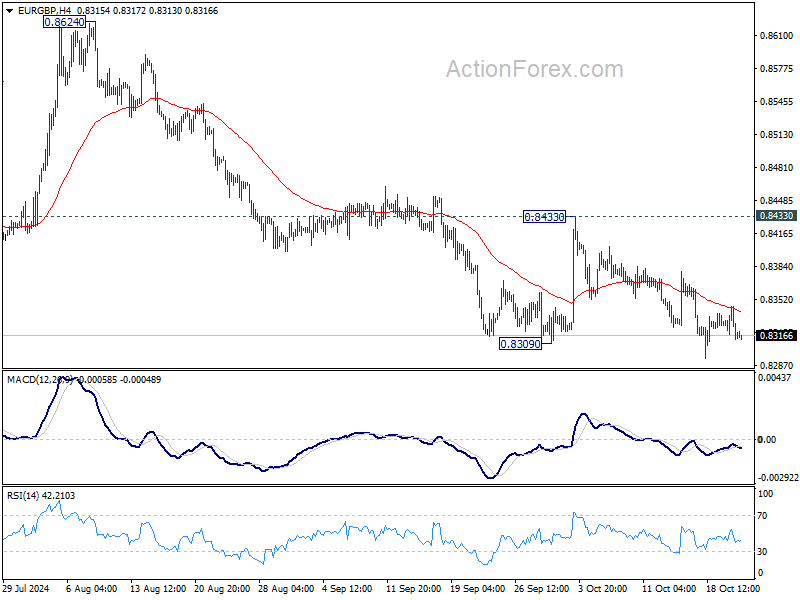
In the bigger picture, down trend from 0.9267 (2022 high) is in progress. Next target is 0.8201 (2022 low), but strong support should be seen there to bring rebound. However, outlook will remain bearish as long as 0.8624 resistance holds even in case of strong rebound. Decisive break of 0.8201 will indicate long term bearish reversal.