
Sample Category Title
Fed’s Williams Sees No Need for Rate Changes Right Now
New York Fed President John Williams signaled Thursday that he remains comfortable keeping interest rates unchanged for now, arguing that policymakers are still waiting to see how inflation pressures tied to the Middle East conflict evolve. Speaking in New York, Williams said monetary policy is currently “in a good place right now” and emphasized there is no immediate case for either tightening or easing.
“I don't see there's any reason at all to raise rates right now or lower rates right now,” Williams said. While acknowledging that the Middle East war has pushed inflation pressures higher, he stressed that “longer-term projections have been stable, which is a good thing.”
Williams suggested he is not yet seeing signs that energy-driven inflation is spreading broadly through the economy. “We're not seeing... unusual second-round effects or persistent effects. But we just have to keep watching,” he said. Williams also noted that much of the tariff-related inflation impact may already have occurred.
Dow Jones at 50,000 and S&P 500 Trades Above 7,500: Intraday Levels
- US stock benchmarks explode to new highs in today's session.
- Nasdaq and S&P 500 print fresh records, while the Dow Jones gets back above 50,000.
- Exploring technical levels for the Dow Jones, Nasdaq and S&P 500.
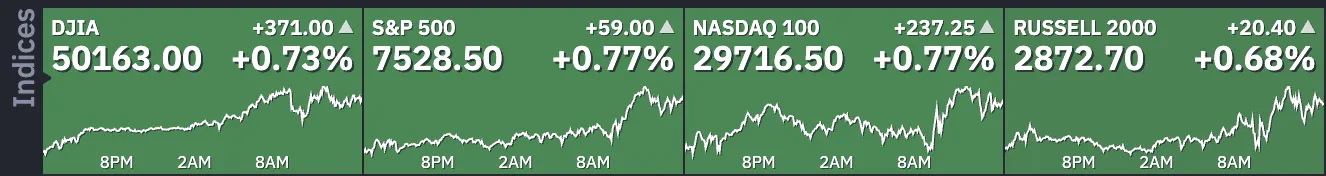
US stock indexes are reaching new all-time highs today, fueled by strong global risk appetite. The S&P 500 has moved past the 7,500 level, while the Nasdaq is also setting new records. The Dow Jones Industrial Average has climbed back above 50,000.
The Chairman Warsh trade is leading market activity. Investors see his confirmation as Federal Reserve Chair as positive for stocks. Large investors are moving money into growth and risk-oriented assets, while other asset classes are seeing less demand.
Precious metals, which recently benefited from safe-haven buying, are now giving back some of their gains as market fears ease. This rise in stocks is global, with international indexes also rising, signalling broad risk appetite.
The ongoing diplomatic summit between President Trump and China's Xi Jinping is also supporting the rally. Investors are encouraged by the positive tone from Beijing. This important meeting is improving investor sentiment and offers hope that the global economy will move away from the deglobalization trends seen in 2025.
While markets are rallying, the Federal Reserve is also seeing major changes. Kevin Warsh has joined the Fed board as its new leader, and Miran is stepping down.
Since there has been no official statement about Jerome Powell leaving, Wall Street assumes he will stay on the Board of Governors for now.
Daily market performance, May 14, 2026. Source: Finviz.
To get ready for a potentially volatile weekend, dive into intraday charts and trading levels for the Dow Jones Industrial Average, Nasdaq Composite, and S&P 500.
Current Session's Stock Heatmap
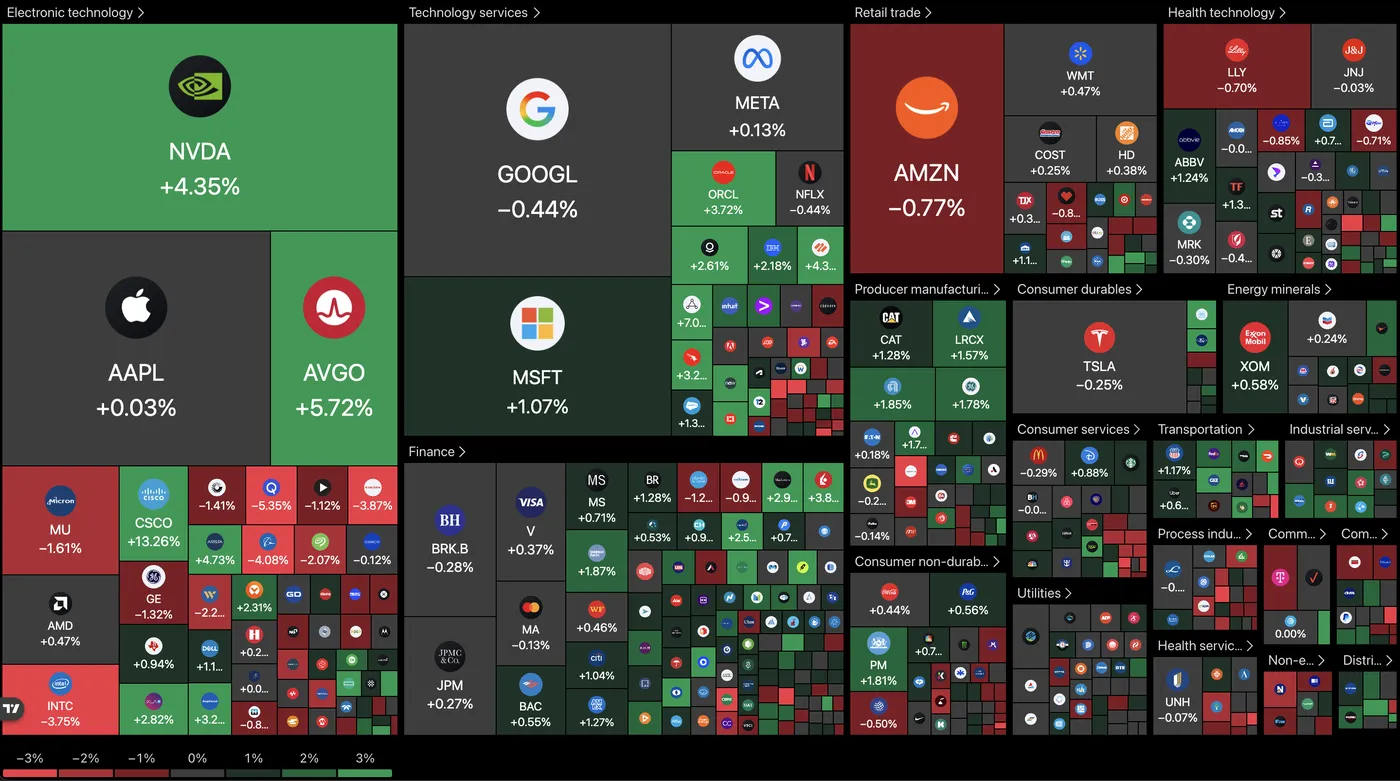
Current picture for the stock market, 15:22. Source: TradingView, May 14, 2026.
Nvidia continues to lead the push in semiconductors, with the sector pulling the rest of the market higher.
Dow Jones 2H Chart and Trading Levels
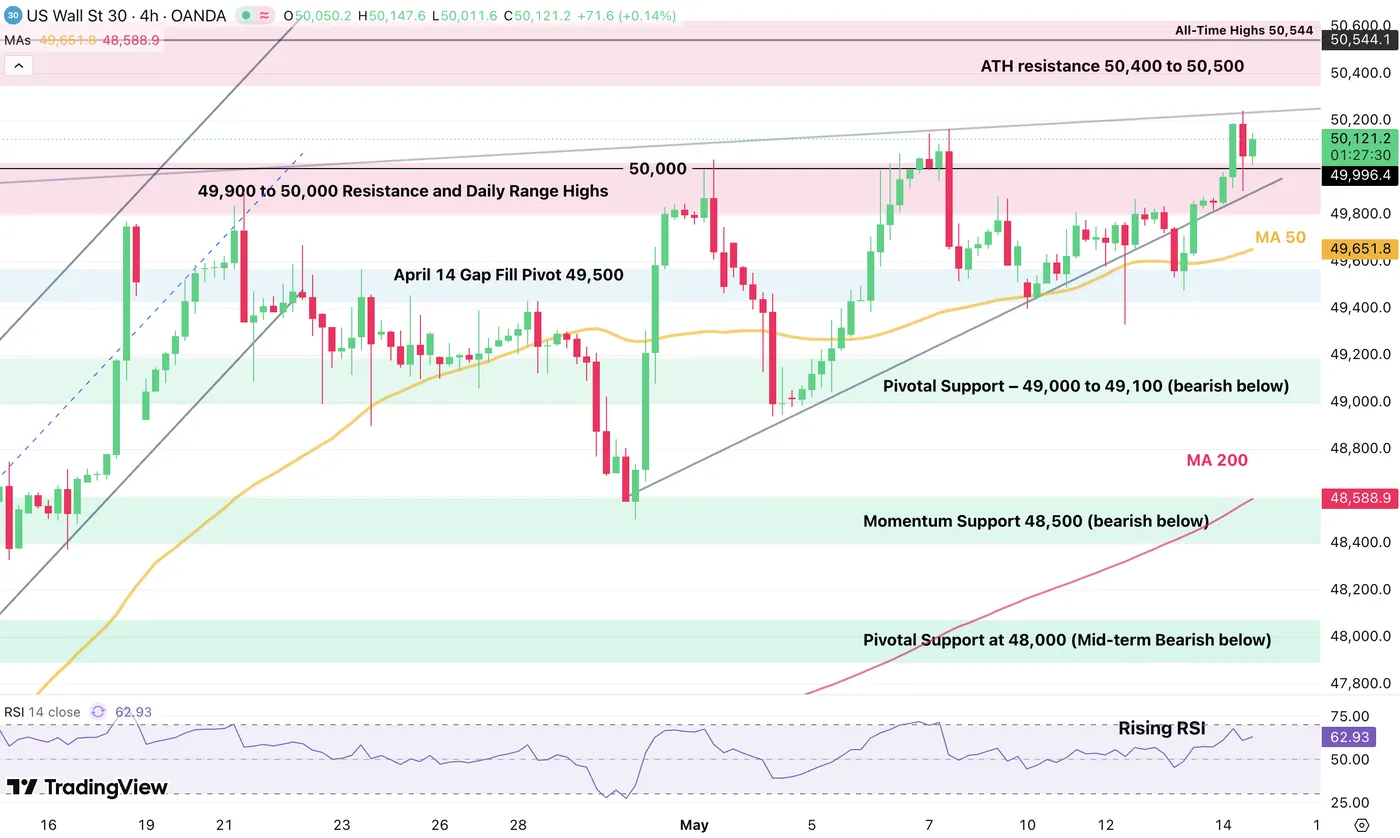
Dow Jones CFD 2H chart. Source: TradingView, May 14, 2026.
The Dow Jones broke its 49,500 to 50,000 range to the upside, looking to close above the key level for the first time since February 11.
Expect to see a continued push towards the end of the week, with the prior all-time highs being the next target for the bulls, around 50,500.
Dow Jones technical levels for trading:
Resistance Levels
- 50,200 morning highs
- ATH resistance 50,400 to 50,500
- All-time highs 50,544
Support Levels
- April 14 gap fill pivot 49,500
- Major pivot: 49,000 to 49,100, short-term bearish below
- Momentum support 48,500
- Pivotal support at 48,000, mid-term bearish below
- Mini support 47,400 to 47,600
Nasdaq 2H Chart and Trading Levels
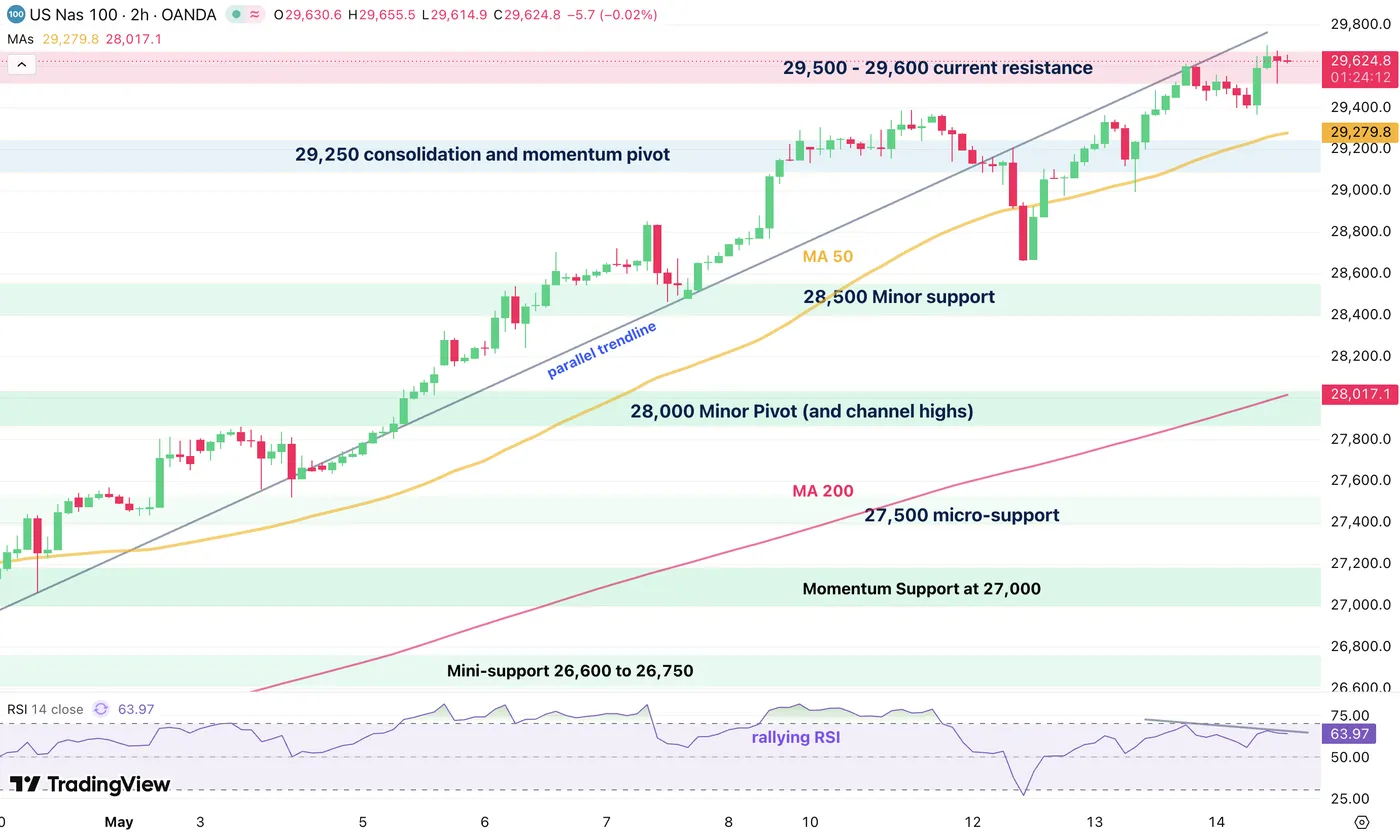
Nasdaq CFD 2H chart. Source: TradingView, May 14, 2026.
Nasdaq is now forming what seems to be the basis of a short-term top, with the 2H RSI now forming a bearish divergence, turning lower despite the daily record highs. Bears will want to see a push below 29,400 with confirmation below the 2H 50-period MA at 29,250.
Nasdaq technical levels of interest:
Resistance Levels
- 29,500 to 29,600 current resistance
- Daily highs 29,620
Support Levels
- 2H 50-period MA at 29,250, short-term bearish below
- 28,500 short-term pivot
- 28,000 major psychological resistance now pivot and channel highs
- 27,500 micro-support
- Momentum pivot at 27,000, 4H 50-period MA
- Mini-support 26,600 to 26,750
- Prior ATH support 26,200 to 26,300
S&P 500 2H Chart and Trading Levels
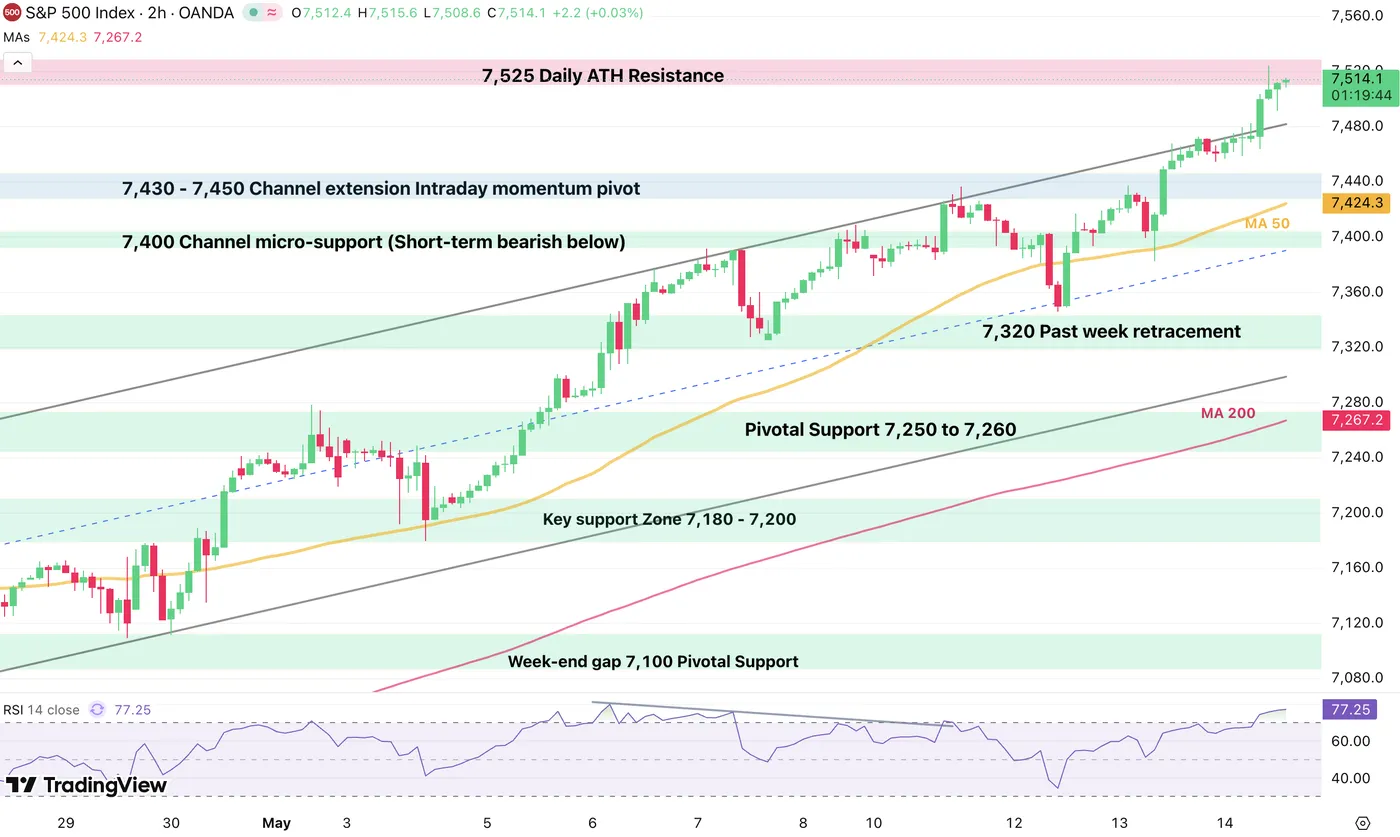
S&P 500 CFD 2H chart. Source: TradingView, May 14, 2026.
The S&P 500 showed high potential for a channel breakout and did so this morning, reaching a 7,526 new record.
Despite the overbought momentum, the index still looks strong enough to pursue its run higher. Nevertheless, keep an eye on whether the Nasdaq ends up correcting, as it may drag sentiment lower with it.
S&P 500 technical levels of interest:
Resistance Levels
- 7,525 daily ATH resistance
- Next stop 7,600
Support Levels
- Momentum pivot 7,250 to 7,260
- Channel lows 7,230, bearish below
- 7,100 psychological level
- Prior ATH pivot 7,000 to 7,020
- Minor support 6,880 to 6,900
- Pivotal support 6,750 to 6,770
- 6,300 psychological level, war lows
Keep track of WTI crude and the Trump-Xi meeting throughout the end of the week to stay ahead of the game.
Safe trades.
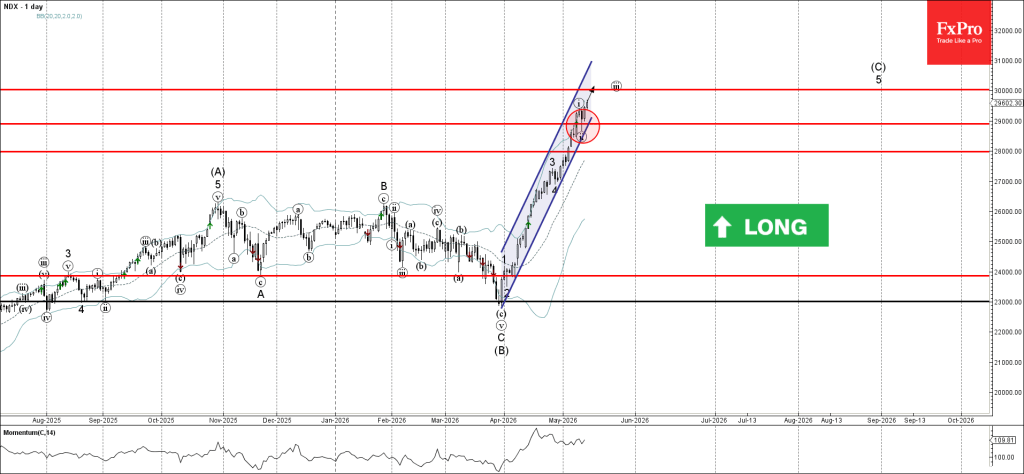
Nasdaq-100 Wave Analysis
Nasdaq-100: ⬆️ Buy
- Nasdaq-100 reversed from support level 29000.00
- Likely to rise to resistance level 30000.00
Nasdaq-100 index recently reversed up from the support level 29000.00 (which started the active minor impulse wave iii).
The support zone near the support level 29000.00 was strengthened by the support trendline of the sharp daily up channel from March.
Given the overriding daily uptrend, Nasdaq-100 index can be expected to rise to the next round resistance level 30000.00 – target for the completion of the active impulse wave iii.
Eco Data 5/15/26
| GMT | Ccy | Events | Act | Cons | Prev | Rev |
|---|---|---|---|---|---|---|
| 22:30 | NZD | Business NZ PMI Apr | 50.5 | 53.2 | 52.8 | |
| 23:50 | JPY | PPI Y/Y Apr | 4.90% | 3.00% | 2.60% | 2.90% |
| 06:00 | JPY | Machine Tool Orders Y/Y Apr | 45.10% | 28.10% | 28.10% | |
| 12:15 | CAD | Housing Starts Y/Y Apr | 279K | 245K | 236K | 240K |
| 12:30 | CAD | Manufacturing Sales M/M Mar | 3.00% | 3.50% | 3.60% | 3.40% |
| 12:30 | USD | Empire State Manufacturing May | 19.6 | 8.1 | 11 | |
| 13:15 | USD | Industrial Production M/M Apr | 0.70% | 0.20% | -0.50% | -0.30% |
| 13:15 | USD | Capacity Utilization Apr | 76.10% | 75.90% | 75.70% |
| 22:30 | NZD |
| Business NZ PMI Apr | |
| Actual | 50.5 |
| Consensus | |
| Previous | 53.2 |
| Revised | 52.8 |
| 23:50 | JPY |
| PPI Y/Y Apr | |
| Actual | 4.90% |
| Consensus | 3.00% |
| Previous | 2.60% |
| Revised | 2.90% |
| 06:00 | JPY |
| Machine Tool Orders Y/Y Apr | |
| Actual | 45.10% |
| Consensus | 28.10% |
| Previous | 28.10% |
| 12:15 | CAD |
| Housing Starts Y/Y Apr | |
| Actual | 279K |
| Consensus | 245K |
| Previous | 236K |
| Revised | 240K |
| 12:30 | CAD |
| Manufacturing Sales M/M Mar | |
| Actual | 3.00% |
| Consensus | 3.50% |
| Previous | 3.60% |
| Revised | 3.40% |
| 12:30 | USD |
| Empire State Manufacturing May | |
| Actual | 19.6 |
| Consensus | 8.1 |
| Previous | 11 |
| 13:15 | USD |
| Industrial Production M/M Apr | |
| Actual | 0.70% |
| Consensus | 0.20% |
| Previous | -0.50% |
| Revised | -0.30% |
| 13:15 | USD |
| Capacity Utilization Apr | |
| Actual | 76.10% |
| Consensus | 75.90% |
| Previous | 75.70% |
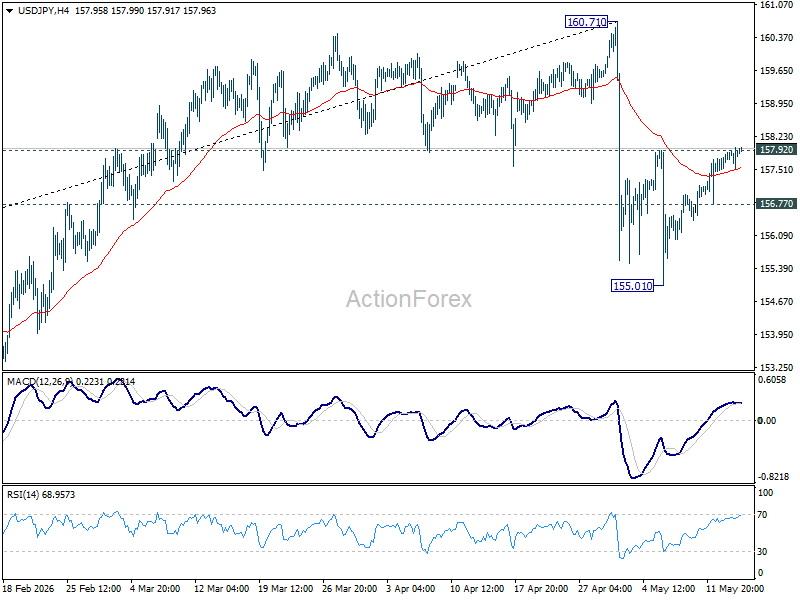
USD/JPY Mid-Day Outlook
Daily Pivots: (S1) 157.59; (P) 157.75; (R1) 158.00; More...
Intraday bias in USD/JPY remains neutral. On the upside, firm break of 157.92 will indicate that pullback from 160.71 has completed, and turn bias back to the upside for stronger rebound. On the downside, below 156.77 minor support will bring retest of 155.01. Firm break there will resume the fall from 160.71 to 152.25 support next.
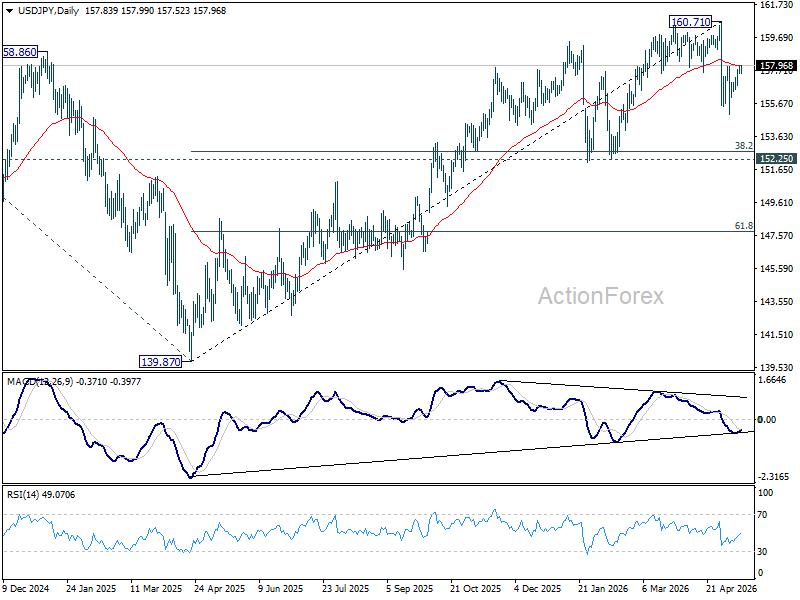
In the bigger picture, for now, corrective pattern from 161.94 (2024 high) is still seen as completed at 139.87. Rise from there is seen as resuming the long term up trend. So, break of 161.94 is expected at a later stage to resume the long term up trend. However, sustained break of 55 W EMA (now at 154.13) will dampen this view and bring deeper fall back towards 139.87 to extend the pattern from 161.94.
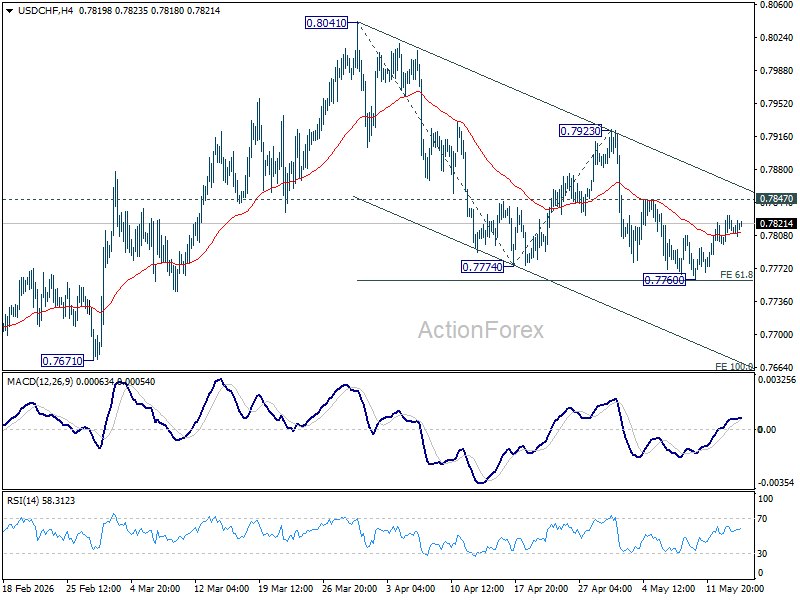
USD/CHF Mid-Day Outlook
Daily Pivots: (S1) 0.7798; (P) 0.7814; (R1) 0.7831; More….
Intraday bias in USD/CHF remains neutral as range trading continues. With 0.7847 resistance intact, further decline is expected. On the downside, decisive break of 0.7760 will resume the whole decline form 0.8041, and target 100% projection of 0.8041 to 0.7774 from 0.7923 at 0.7656. However, firm break of 0.7847 resistance will indicate short term bottoming, and bring stronger rebound back to 0.7923 resistance.
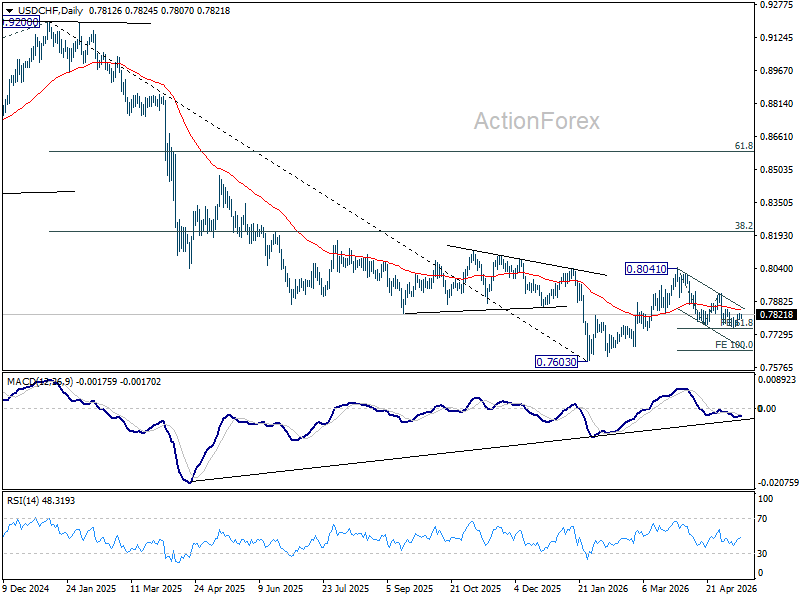
In the bigger picture, as long as 55 W EMA (now at 0.8051) holds, fall from 0.9200 is expected to continue, as part of the larger down trend. Firm break of 0.7603 will target 100% projection of 1.0146 (2022 high) to 0.8332 from 0.9200 at 0.7382.
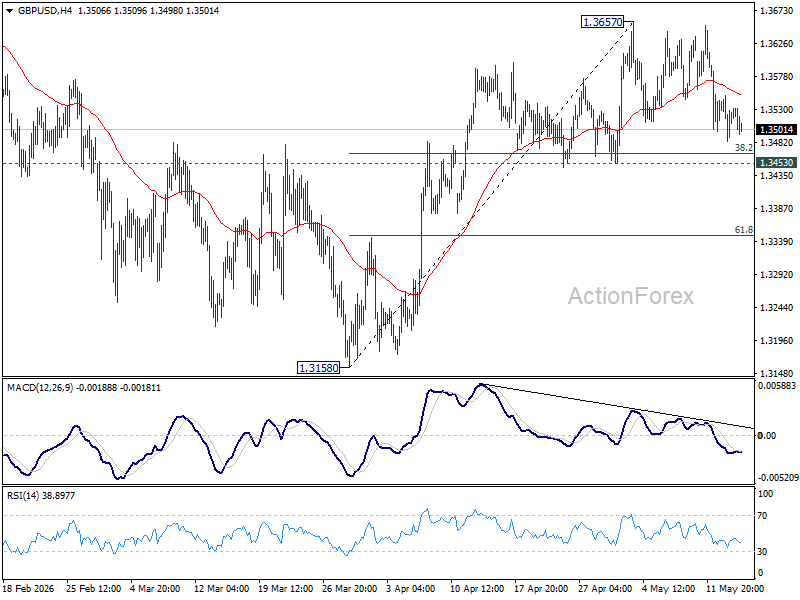
GBP/USD Mid-Day Outlook
Daily Pivots: (S1) 1.3486; (P) 1.3518; (R1) 1.3553; More...
Intraday bias in GBP/USD remains neutral as range trading continues. Further rally remains mildly in favor. On the upside, firm break of 1.3657 will resume the rally from 1.3158 to retest 1.3867 high. However, decisive break of 1.3453 will argue that the rebound has already completed, and turn bias to the downside for retesting 1.3158 instead.
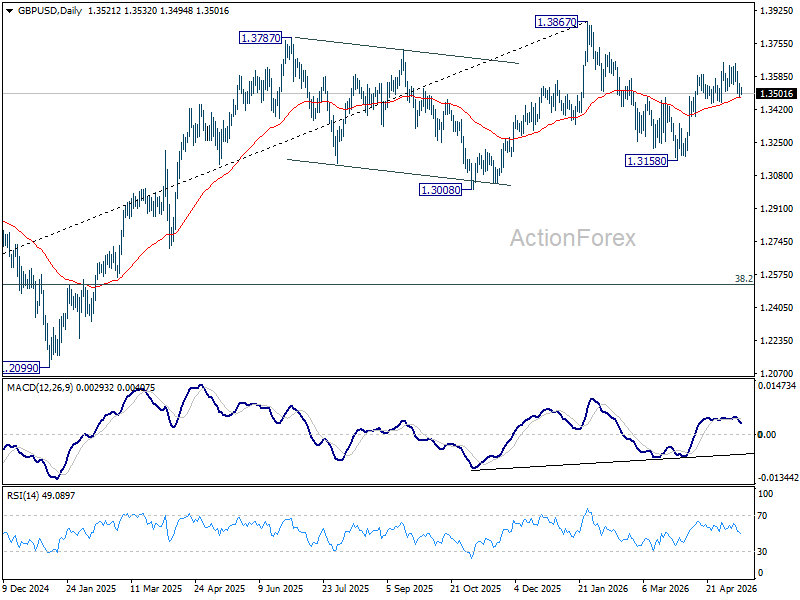
In the bigger picture, current development suggests that price actions from 1.3867 are merely a corrective pattern within the broader up trend from 1.0351 (2022 low). With 1.3008 support intact, medium term bullishness is maintained and break of 1.3867 is in favor for a later stage, towards 1.4248 key resistance (2021 high).
U.S. Retail Sales Post a Solid Gain in April, But Higher Prices a Factor
Retail and food services sales rose 0.5% month-over-month (m/m) in April, in line with consensus expectations. However, sales gains were largely due to higher prices, with inflation picking up in April, real retail and food services sales fell 0.2% m/m.
To no surprise, higher gasoline prices were part of the story, with sales at gasoline stations rising 2.8% m/m after a 14% increase in March. Meanwhile, sales of autos and parts fell 0.4% m/m and building materials and garden retailers rose only 0.1% m/m.
Looking at the “control group”—which excludes volatile sales of gasoline, autos & parts and building materials and garden equipment— sales rose 0.5% m/m, also in line with expectations. Sales in other categories were mixed. Furniture and home furnishings stores gave back March's gain (-2.0% m/m), clothing sales fell (-1.5% m/m), while general merchandise stores (+0.1% m/m) and health and personal care stores (-0.0% m/m) were basically flat. Strength was seen in electronics and appliances (+1.4% m/m) and sporting goods stores (+1.4% m/m).
Sales at non-store retailers, mostly online sales, posted another solid monthly increase (+1.1% m/m), and were up 11% from a year-ago.
Spending at bars and restaurants – the only service category included in the report – rose a healthy 0.6% m/m in April after a soft March reading. Zooming out on the longer-trend spending is only up 2.8% y/y, down from 6.9% growth a year ago.
Key Implications
As expected, retail and food services—which are measured in nominal terms—rose in April, boosted by higher prices. The drop in real sales does come after two solid months in February and March, and real sales are up 1.0% y/y. The softness in real terms is mitigated somewhat by a decent gain in "core" sales in April, coming on top of upward revision to the prior two months. Core sales were up a solid 5.7% y/y, pointing to still solid gains in real terms, and recent trends point to renewed momentum after a soft winter.
Overall, the upward revisions to prior months should give a bit of a boost to consumer spending in the first quarter, and have started the second quarter with decent momentum. That said, consumers are still contending with higher gasoline prices May, and that is likely to take a toll on discretionary purchases. In the near-term, higher tax refund checks and lower income taxes will provide some cushion.
EUR/USD Mid-Day Outlook
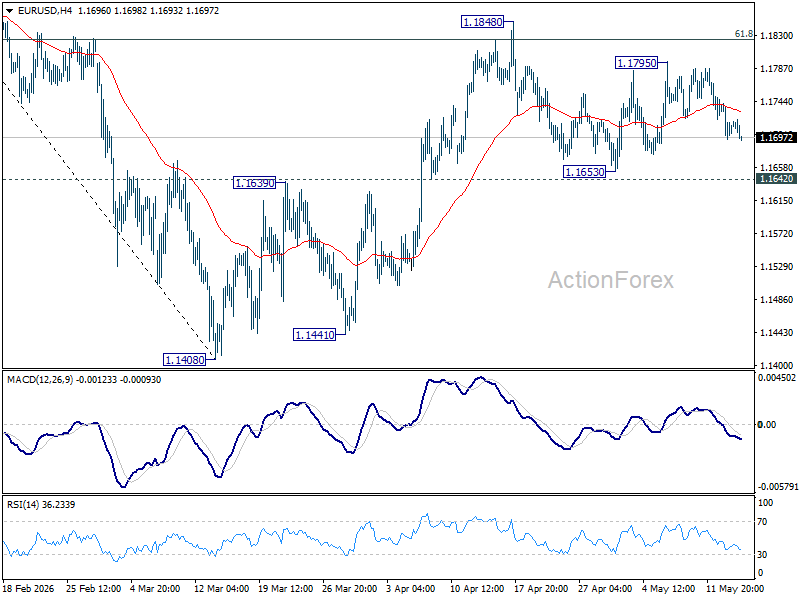
Daily Pivots: (S1) 1.1688; (P) 1.1714; (R1) 1.1734; More….
EUR/USD dips slightly today but stays in established range. Intraday bias remains neutral for the moment. Further rise is expected with 1.1642 support intact. On the upside, firm break of 1.1848 will target 1.2081 high next. However, firm break of 1.1662 support will indicate the the rebound from 1.1408 has completed, and bring deeper decline back towards this low instead.
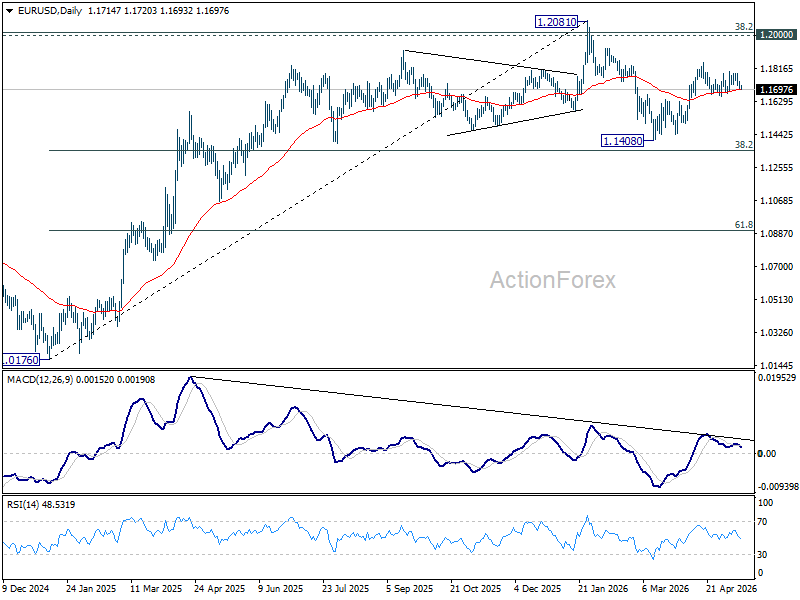
In the bigger picture, the strong support from 38.2% retracement of 1.0176 to 1.2081 at 1.1353 suggests that the pullback from 1.2081 is more likely a corrective move. Strong support was also found in 55 W EMA (now at 1.1539). Focus is back on 1.2 key cluster resistance level. Decisive break there will carry long term bullish implications. Nevertheless, break of 1.1408 support will revive the case of medium term bearish trend reversal.
Trump-Xi Summit Fails to Convince Oil Markets on Hormuz
Risk sentiment remained broadly stable on Thursday as US equity futures edged higher alongside European stocks, extending the optimistic tone already dominating global markets this week. But while equities continued drifting along the existing AI- and liquidity-driven rally, oil markets delivered a far more cautious verdict on the opening phase of the Trump-Xi summit in Beijing.
The key issue remains the Strait of Hormuz. Following talks between President Donald Trump and Chinese President Xi Jinping, the White House stated that both leaders agreed “the Strait of Hormuz must remain open to support the free flow of energy.” According to Washington, Xi also expressed opposition to “the militarization of the strait and any effort to charge a toll for its use,” while both sides reaffirmed that “Iran can never have a nuclear weapon.”
However, the Chinese side delivered a far more restrained public statement. China’s Foreign Ministry merely stated that the two leaders “exchanged views on major international and regional issues, such as the Middle East situation, the Ukraine crisis, and the Korean Peninsula,” without explicitly referencing Hormuz, Iran, maritime security, or energy flows.
That discrepancy appears to have prevented energy traders from embracing the summit as a meaningful geopolitical breakthrough. Brent crude dipped modestly below $105 but remained elevated overall, suggesting markets still see substantial war premium embedded in oil prices. If investors truly believed the Strait of Hormuz was on a credible path toward normalization, oil prices would likely be falling much more aggressively.
Equity investors are still willing to maintain the broader risk-on narrative supported by AI optimism and resilient global liquidity conditions. But oil traders continue signaling that the underlying geopolitical crisis has not actually been resolved. As long as the threat of partial blockage, tanker disruption, or Iranian “toll” measures remains alive, the war premium is unlikely to disappear from energy markets.
The concern now is that if diplomacy fails to deliver more concrete progress during the second day of talks, Washington could eventually pivot back toward a harder security response. Without operational guarantees on shipping access, the US may eventually return to naval escort operations or even military strike preparation to force the Strait open.
In currency markets, Dollar regained the top position for the week as stronger US inflation data continued supporting expectations for higher-for-longer Fed policy. Aussie remained the second strongest performer thanks to resilient risk appetite, while Loonie benefited from still-elevated crude prices. Sterling remained the weakest major currency amid continuing UK political instability, followed by Yen and Euro.
GBP/AUD Sinks to 1½-Year Lows as Aussie Risk Rally Meets UK Political Paralysis
GBP/AUD fell to fresh 2½-year lows as markets increasingly favored Australia’s growth-and-yield story over Britain’s rising political uncertainty. AI-driven risk appetite, hawkish RBA expectations, and Sterling’s growing political discount continue reinforcing the pair’s bearish trend. Read More.
Silver's Momentum Stalls Below $90, but Bigger Breakout Risks Are Building
Silver momentum slowed near $90, but narrowing Gold-Silver Ratio and strong industrial demand continue building the case for a larger breakout toward $100. Read More.
US Retail Sales Rise 0.5% in April, Reinforcing Resilient Demand
US retail sales rose 0.5% in April while core spending measures came in stronger than expected, reinforcing the view that consumer demand remains resilient despite elevated inflation and higher interest rates. Read More.
US initial jobless claims rise to 211k vs exp 205k
US jobless claims rose slightly above expectations last week, suggesting the labor market is gradually cooling but still remains relatively resilient overall. The data is unlikely to shift the Fed’s focus away from persistent inflation risks for now. Read More.
UK GDP Expands 0.6% in Q1, up 0.3% in March
Britain’s economy held up better than expected in early 2026 as stronger services and construction activity lifted both quarterly and monthly GDP growth. The figures offer some reassurance for policymakers even as rising energy costs and political instability continue clouding the outlook. Read More.
EUR/USD Mid-Day Outlook
Daily Pivots: (S1) 1.1688; (P) 1.1714; (R1) 1.1734; More….
EUR/USD dips slightly today but stays in established range. Intraday bias remains neutral for the moment. Further rise is expected with 1.1642 support intact. On the upside, firm break of 1.1848 will target 1.2081 high next. However, firm break of 1.1662 support will indicate the the rebound from 1.1408 has completed, and bring deeper decline back towards this low instead.
In the bigger picture, the strong support from 38.2% retracement of 1.0176 to 1.2081 at 1.1353 suggests that the pullback from 1.2081 is more likely a corrective move. Strong support was also found in 55 W EMA (now at 1.1539). Focus is back on 1.2 key cluster resistance level. Decisive break there will carry long term bullish implications. Nevertheless, break of 1.1408 support will revive the case of medium term bearish trend reversal.