Sample Category Title
Markets Await Concrete Signals as Trump-Xi Summit Begins in Beijing
Markets are still waiting for the real signals. As US President Donald Trump’s two-day summit with Chinese President Xi Jinping began in Beijing today, investors largely avoided making aggressive bets, preferring instead to wait for the kinds of concrete announcements and joint language that typically emerge near the end of high-level diplomatic visits. Beneath the surface calm, however, the summit could shape the direction of everything from oil prices and AI stocks to inflation expectations and global trade stability.
The biggest issue remains the Strait of Hormuz crisis.
Washington is reportedly asking Beijing to use its enormous economic leverage over Iran to help reopen the vital shipping corridor. China is currently the largest buyer of Iranian oil, giving it influence over Tehran that no other governments possess. Trump may be willing to offer selective sanctions relief for Chinese firms tied to Iranian shipments if Beijing pressures Iran toward de-escalation and maritime reopening.
Markets are watching closely for any joint language mentioning “maritime stability” or “de-escalation in the Gulf.” Such wording would likely be interpreted as a major diplomatic breakthrough and could trigger a sharp fall in oil prices from current elevated levels near $106 Brent. Airline and logistics shares, which have suffered under rising fuel costs, would likely rally strongly, while Dollar could weaken as safe-haven demand fades.
But the summit is about far more than oil alone.
One of the biggest surprises of the visit was Nvidia CEO Jensen Huang joining the delegation alongside Elon Musk and Apple CEO Tim Cook. Their presence intensified speculation that AI chip restrictions may be part of a broader geopolitical negotiation framework involving rare earth exports, technology access, and cooperation over Iran. There is possibility of selective carve-outs on advanced semiconductor exports if China helps stabilize the Hormuz situation or loosens restrictions on critical minerals.
Such a development would likely provide another major boost to US technology shares, particularly as NASDAQ continues extending its record-setting rally on AI optimism despite elevated geopolitical tensions.
Another important area of discussion is the proposed US-China “Board of Trade” framework — a permanent institutional mechanism designed to manage disputes and reduce the risk of repeated tariff escalations. While probably less immediately market-moving than oil or semiconductor announcements, institutional investors would likely welcome any framework that increases long-term trade predictability between Washington and Beijing.
Meanwhile, Kevin Warsh was officially confirmed by the Senate as the next Chair of the Federal Reserve in a historically partisan 54–45 vote. Warsh is expected to formally assume the role on May 14 ahead of his first policy meeting in June. Markets continue monitoring the leadership transition carefully following this week’s hotter-than-expected CPI and PPI data, which further strengthened expectations that the Fed may need to maintain restrictive policy for longer.
In currency markets, the overall picture remains unusually mixed rather than purely risk-on or risk-off. Aussie is now the strongest major currency this week thanks to resilient risk appetite and AI-driven optimism. Dollar stayed supported by rising Fed expectations after hot inflation data. Loonie benefited from elevated crude prices. On the other hand, Sterling remained pressured by Britain’s political instability, and Yen continued struggling as intervention effects faded.
In Asia, at the time of writing, Nikkei is down -0.69%. Hong Kong HSI is up 0.36%. China Shanghai SSE is down -0.76%. Singapore Strait Times is down -0.38%. Japan 10-year JGB yield is up 0.037 at 2.630. Overnight, DOW fell -0.14%. S&P 500 rose 0.58%. NASDAQ rose 1.20%. 10-year yield rose 0.02 to 4.48.
Fed’s Kashkari Reinforces Hawkish Stance Amid Iran-Driven Inflation
Fed’s Neel Kashkari said the labor market is looking stronger while inflation pressures tied to the Iran war are worsening, reinforcing the case for keeping the door open to additional rate hikes. His remarks add to growing evidence that the Fed is shifting away from rate-cut discussions and back toward inflation control. Read More.
Collins: Fed Should Hold for Now but Hike Risk Has Increased
Boston Fed President Susan Collins signaled that while holding rates remains the Fed’s base case, policymakers are becoming far less willing to ignore supply-driven inflation shocks. Persistent energy pressures tied to the Middle East conflict are increasing the risk that another hike may eventually be needed. Read More.
ECB's Lane Lays Out Case for June Hike Amid Global Energy Shock
ECB Chief Economist Philip Lane warned that the Iran war’s oil shock is a global inflation problem rather than a regional one, laying out the case for a June ECB rate hike to prevent higher energy costs from spreading into wages and broader prices. Read More.
BoE’s Mann Warns Bond Market Fragility Matters for Future Rate Hikes
BoE policymaker Catherine Mann warned that fragile UK bond markets could amplify the impact of future rate hikes, especially as political instability and foreign investor flows increase volatility risks. Even one of the MPC’s most hawkish members now appears increasingly cautious about financial market fragility. Read More.
EUR/AUD Daily Outlook
Daily Pivots: (S1) 1.6082; (P) 1.6153; (R1) 1.6196; More...
Intraday bias in EUR/AUD stays on the downside at this point. Decisive break of 1.6125 will resume larger fall from 1.8554. Next target is 1.5913 fibonacci level. Nevertheless, break of 1.6293 resistance will indicate short term bottoming, and turn bias back to the upside for stronger rebound to 55 D EMA (now at 1.6491).
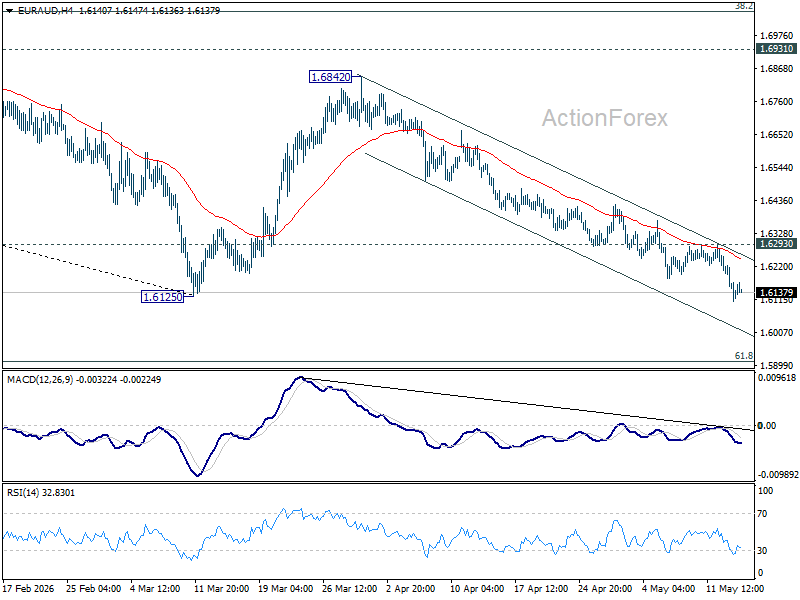
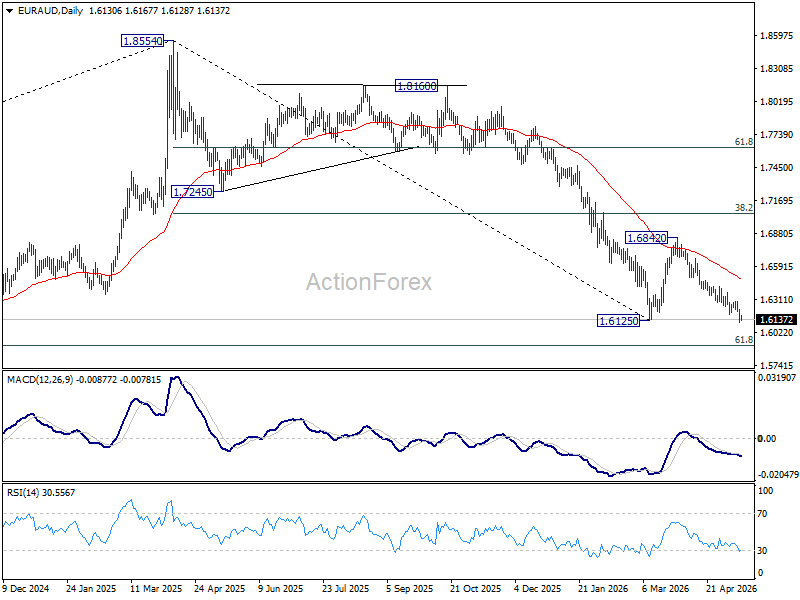
In the bigger picture, fall from 1.8554 (2025 high) is in progress and deeper decline should be seen to 61.8% retracement of 1.4281 to 1.8554 at 1.5913, which is slightly below 1.5963 structural support. Decisive break there will pave the way back to 1.4281 (2022 low). For now, risk will stay on the downside as long as 55 W EMA (now at 1.7039) holds, even in case of strong rebound.
US PPI Surges as Inflation Heat Derails Rate Cut Hopes Ahead of Trump-Xi Summit
Key Takeaways
- US inflation pressures intensified after April PPI surged 6.0% y/y, reinforcing the “higher for longer” Federal Reserve narrative and fuelling expectations that any future Fed move could shift toward rate hikes rather than cuts.
- Donald Trump and Xi Jinping began high-stakes talks in Beijing, with AI competition, semiconductor restrictions, and Middle East geopolitical tensions dominating market focus.
- Despite rising bond yields and inflation shocks, AI-driven equity momentum remained resilient as the Nasdaq 100 and S&P 500 climbed to fresh record highs, while energy markets stayed elevated above $100/bbl due to worsening Strait of Hormuz supply concerns.
- Chart of the day: AUD/USD bullish breakout from minor range configuration, 0.7210 key short-term support with next intermediate resistances at 0.7265, 0.7300, and 0.7340.
Top Macro Headlines
- US producer prices surge: April PPI jumped 1.4% month-over-month and 6.0% year-over-year, marking the biggest gain in four years. The hotter-than-expected print confirms inflation is accelerating amid the ongoing conflict with Iran.
- Trump arrives in Beijing for high-stakes summit: President Donald Trump arrived in Beijing for meetings with Chinese President Xi Jinping. Nvidia CEO Jensen Huang joined the US delegation, highlighting the focus on the global AI race and the proposed US "MATCH Act" targeting Chinese chipmakers.
- EIA drastically revises oil supply hit: The US Energy Information Administration revised its forecasts, projecting a much longer and more severe disruption to global oil supplies as Iran moves to formalize control over the Strait of Hormuz.
- Kevin Warsh confirmed as Fed official: The US Senate confirmed Kevin Warsh to a 14-year term as a Federal Reserve governor, setting him up as the likely successor to Fed Chair Jerome Powell.
- Alibaba posts operating loss on AI spending: Alibaba Group ADRs slipped 3% after posting its first operating loss since the pandemic, underscoring the massive capital expenditures required to compete in the AI space. Interestingly, its ADR recovered as the US session progressed and ended with a gain of 8% to close at a near 5-month high.
Key Macro Themes
- Inflation resurgence cements “higher for longer”: Following the 3.8% CPI print, the massive 6.0% y/y headline PPI surge has completely wiped out remaining hopes for Fed rate cuts in 2026 and reflected an increase in rate hike bets coming in the first half of 2027, according to data from the CME FedWatch tool.
- The cost of the AI arms race: Alibaba's earnings reflect a growing reality: the AI supercycle requires staggering, profitability-draining capital expenditures. Markets will increasingly scrutinize tech giants to balance AI spending with near-term margins.
- Structural geopolitical premiums: The oil market is shifting from pricing a “temporary disruption” to a “persistent geopolitical premium” as the Middle East conflict restricts global supply chain norms.
Global Market Impact: Last 24 Hours
Equities: US stock markets remained buoyant despite a red-hot PPI print. Supported by tech stocks, the S&P 500, up 0.6%, and the Nasdaq 100, up 1%, rallied to another record high.
Fixed Income: The US 10-year Treasury yield climbed to an intraday high of 4.5% on Wednesday, 13 May, hitting a 10-month high as bond markets fully absorb the dual CPI and PPI inflation shocks.
FX: The US Dollar Index, DXY, extended gains to 98.45, marking a third consecutive session of strength as investors increased bets on a prolonged restrictive Fed policy.
Commodities: WTI and Brent crude remain elevated over $100/bbl following the EIA's grim supply revisions. Spot Gold is holding near $4,645/oz, supported by haven demand ahead of the Beijing summit.
Asia Pacific Impact
- Stock markets: Chinese and Hong Kong equities will be in focus, following Alibaba's earnings miss, China's vocal opposition to the US MATCH Act, and the start of the Trump-Xi summit. Tech heavyweights like Tencent, Alibaba, Baidu, and Xiaomi will be closely watched. In today’s early Asia session, China and Hong Kong stock markets opened with an upbeat tone; CSI 300 up 0.1%, China A50 up 0.1%, and Hang Seng Index up 1.1% at the time of writing.
- Currencies: The yuan traded almost unchanged against the USD at 6.7855 per US dollar in today’s Asia opening hours as the Trump-Xi summit gets underway. The offshore yuan, CNH, has rallied for six consecutive sessions against the USD. It is now eyeing a near 3-year high of 6.7740 per US dollar as the market seems to be pricing a status quo in terms of US-China trade relations after the summit.
- Economic outlook: All regional eyes are on the Beijing summit. Any signs of diplomatic progress regarding Iran or AI trade regulations could trigger massive, rapid reversals in regional risk sentiment.
Top 5 Events to Watch Today
- Trump-Xi Summit Developments Impact: USD/CNH, global equities, WTI, Brent crude
- UK Q1 GDP Prelim - 2.00 pm SGT; consensus: 0.8% y/y, Q4 2025: 1.0% y/y Impact: GBP/USD, GBP crosses, FTSE 100
- US Retail Sales (Apr) - 8.30 pm SGT; consensus: 0.5% m/m, Mar: 1.7% m/m Impact: USD, US Treasuries, US stock indices
- US Initial Jobless Claims, week ending 9 May - consensus: 205K, prior: 200K Impact: USD, short-term US Treasuries, US stock indices
- Applied Materials Earnings - after US session close Impact: Semiconductor stocks, Nasdaq 100
Chart of the Day: AUD/USD Bullish Breakout from Minor Range
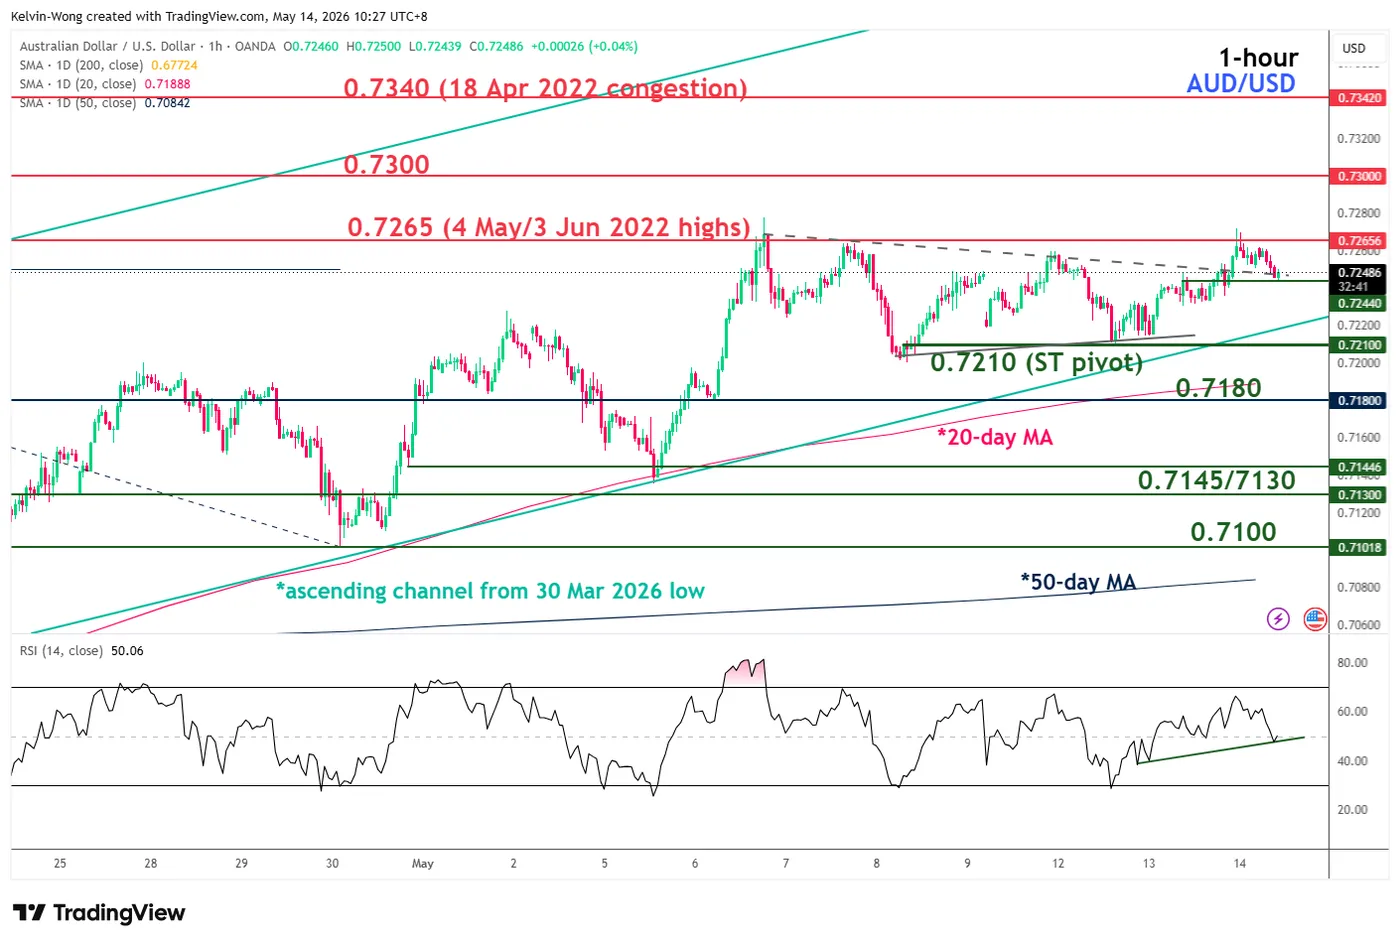
Fig. 1: AUD/USD minor trend as of 14 May 2026. Source: TradingView.
The price actions of AUD/USD staged a bullish breakout from a minor “Symmetrical Triangle” range configuration on Wednesday, 13 May 2026.
Currently, it is retesting the former “Symmetrical Triangle” range resistance, which has now become a near-term pullback support at 0.7244, as indicated by the hourly RSI momentum indicator, which is holding at the 50 level.
Watch the 0.7210 key short-term pivotal support on AUD/USD. A clearance above 0.7265 triggers the next intermediate resistances at 0.7300 and 0.7340.
However, a break and an hourly close below 0.7210 negates the bullish tone for another round of potential minor corrective decline to expose the next intermediate support at 0.7180, also the 20-day moving average. Below it may see further weakness towards 0.7145/7130 next.
GBP/USD Reversal Triggers Bearish Pressure, $1.3450 In Focus
Key Highlights
- GBP/USD was rejected near the 1.3650 resistance.
- It traded below a bullish trend line with support at 1.3580 on the 4-hour chart.
- EUR/USD could struggle to stay above 1.1650 if it remains below 1.1750.
- USD/JPY is showing signs of more upside above the 158.00 resistance.
GBP/USD Technical Analysis
The British Pound failed to surpass 1.3650 against the US Dollar. GBP/USD reacted to the downside and traded below the 1.3600 support.
Looking at the 4-hour chart, the pair traded below a bullish trend line with support at 1.3580. There was a sharp decline below 1.3550 and the 100 simple moving average (red, 4-hour). If the bears remain in action, the pair could continue to move down.
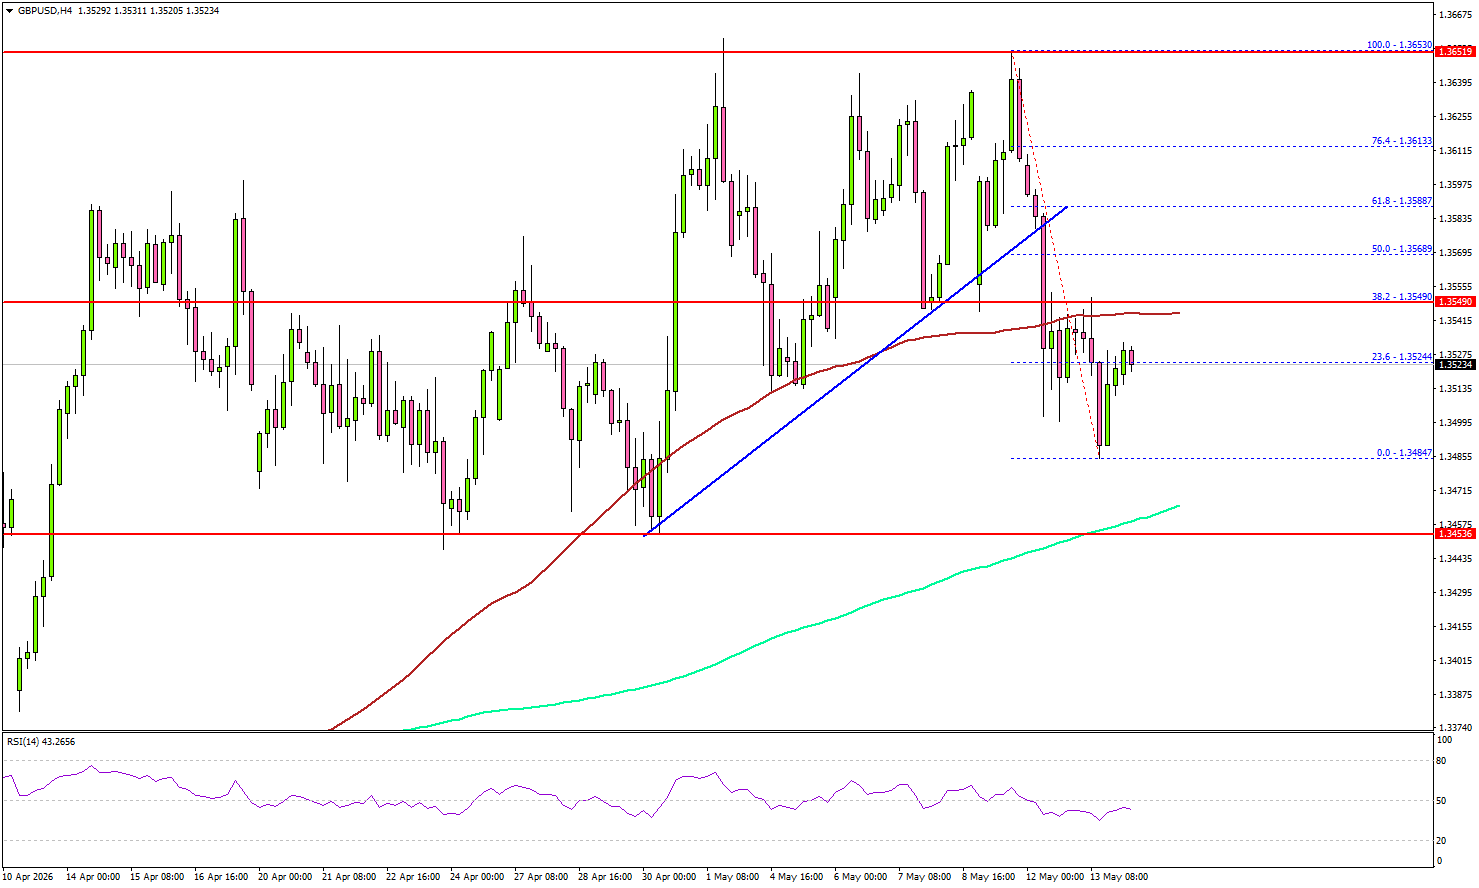
The first major support sits at the 200 simple moving average (green, 4-hour) at 1.3455. The next support could be 1.3400. A close below 1.3400 might initiate a drop to 1.3320.
On the upside, the pair faces resistance at 1.3550 and the 100 simple moving average (red, 4-hour). The first major resistance sits at 1.3580. The main resistance could be 1.3650. A close above 1.3650 could open doors for gains above 1.3680. In the stated case, the bulls could aim for a move to 1.3800.
Looking at EUR/USD, the pair is again moving lower, and the bears could aim for a clear move below the 1.1650 support.
Upcoming Key Economic Events:
- US Initial Jobless Claims - Forecast 205K, versus 200K previous.
- US Retail Sales for April 2026 (MoM) – Forecast +0.5%, versus +1.7% previous.
Fed’s Kashkari Reinforces Hawkish Stance Amid Iran-Driven Inflation
Minneapolis Fed President Neel Kashkari signaled Wednesday that the Federal Reserve remains firmly focused on inflation risks, warning that stronger labor market conditions and rising energy-driven price pressures are strengthening the case for maintaining a hawkish policy stance.
Kashkari said the labor market now looks “a bit better” than it did earlier this year, while inflation pressures linked to the Iran war have intensified. “We are dead serious about getting inflation back down,” he said, reinforcing the Fed’s growing concern that higher oil prices may eventually spill more broadly into underlying inflation. His comments align with the increasingly hawkish tone emerging from several Fed officials following hotter-than-expected CPI and PPI reports this week.
The Minneapolis Fed chief was one of three policymakers who dissented at the Fed’s April meeting, advocating for language that would explicitly preserve the possibility of future rate hikes. His remarks suggest that policymakers see little urgency to pivot toward cuts while the economy remains relatively resilient and inflation continues running well above target.
Instead, the combination of stable employment conditions and persistent price pressures is increasingly shifting the Fed debate toward how long restrictive policy may need to remain in place — and whether another hike could eventually become necessary.
Collins: Fed Should Hold for Now but Hike Risk Has Increased
Boston Fed President Susan Collins said on Wednesday that while holding interest rates steady remains her base case, the Federal Reserve may still need to tighten policy further if inflation pressures fail to ease. Speaking at the Boston Economic Club, Collins stressed that the longer the Middle East conflict persists, the greater the inflation risks become, particularly through energy prices and supply chain disruptions.
“While it is not in my most likely outlook, I could envision a scenario in which some policy tightening is needed to ensure that inflation returns durably to 2% in a timely manner,” Collins said. She emphasized that the Fed’s current “slightly restrictive” policy stance remains appropriate for now, but warned policymakers can no longer comfortably dismiss supply-side inflation shocks as temporary. “More than five years of above-target inflation has reduced my patience for ‘looking through’ another supply shock,” she said.
Collins acknowledged the US economy is more resilient to energy shocks than in previous decades, describing demand as “resilient” and growth as still “solid.” However, she warned that prolonged conflict in the Middle East could generate broader spillovers and keep inflation elevated well into next year. “The likelihood of other scenarios — with higher and more persistent inflation, more adverse labor market outcomes, or both — has increased,” Collins said. Her remarks reinforce the growing shift inside the Fed away from discussing rate cuts and toward managing the risk that inflation may remain persistently above target.
ECB’s Lane Lays Out Case for June Hike Amid Global Energy Shock
ECB Chief Economist Philip Lane signaled on Wednesday that the Iran-related oil shock may require ECB tightening to prevent higher energy prices from spreading into wages, inflation expectations, and broader consumer prices. Speaking in London, Lane laid out the intellectual case for a likely June rate hike while acknowledging the Eurozone economy is already slowing under the weight of higher energy costs and weak demand.
“The optimal response might be smaller for an exogenous supply disruption than for a demand shock but there are several reasons why an active response may be required,” Lane said. He warned that the current energy shock differs from the 2022 Ukraine crisis because it is now a “global shock” rather than a regional European one.
“Global shock means that costs are increasing around the world such that there is no relief via the import channel,” he said, adding that this creates “a compounding effect” as rising costs feed through international supply chains into final consumer prices.
Lane also stressed that the inflation environment is now more dangerous because firms and consumers remain highly sensitive to prices after the post-pandemic inflation surge and the Ukraine war. While he acknowledged weak Eurozone demand may limit companies’ pricing power, he warned that second-round effects remain the ECB’s key concern.
Lane reiterated that “a mid-size but not-too-persistent overshoot could warrant some measured adjustment,” but added that a more persistent inflation surge could require an “appropriately forceful or persistent” policy response.
The comments reinforce market expectations for a June ECB rate hike, though uncertainty remains over how far tightening may ultimately go if growth continues deteriorating.
BoE’s Mann Warns Bond Market Fragility Matters for Future Rate Hikes
Bank of England policymaker Catherine Mann warned that future interest rate hikes could trigger larger-than-intended tightening in UK financial conditions because of growing fragility in Britain’s gilt market. Speaking on Wednesday, Mann said the increasing role of hedge funds and overseas investors has made the market more sensitive to sudden shifts in sentiment, particularly during periods of political and economic uncertainty.
“Given fragilities and economic uncertainties in the domestic and global financial markets, investor sentiment can shift abruptly,” Mann said. She cautioned that “a tighter monetary policy stance could trigger volatility as the new actors unwind positions,” potentially tightening financial conditions far beyond what the BoE intends. Her remarks came after UK government bond yields surged earlier this week amid mounting political pressure on Prime Minister Keir Starmer, with 30-year gilt yields briefly hitting their highest level since 1998.
Importantly, Mann also signaled that broader market conditions are now becoming a direct factor in her policy thinking. In a later Q&A session, she said: “With regard to the 10-year yield and exchange rates, I take the financial landscape as a key factor in my decision-making.”
The comments are notable because Mann is traditionally viewed as one of the MPC’s most hawkish members. Her remarks suggest that even policymakers are concerned about inflation risks tied to higher energy prices and the Strait of Hormuz disruption, they are becoming wary that aggressive tightening could destabilize UK bond markets and Sterling simultaneously.
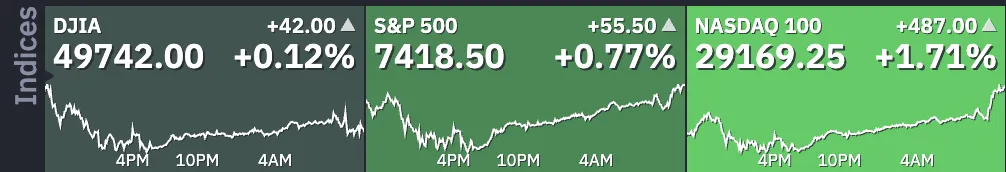
Kevin Warsh Confirmed as Fed Chairman: Reactions for Dow Jones, Nasdaq and S&P 500
- US stock benchmarks rise but show mixed reactions to the confirmation of Kevin Warsh as the next Fed Chair.
- Nasdaq and S&P 500 continue to explode to new all-time highs, while the Dow Jones still struggles.
- Exploring technical levels for the Dow Jones, Nasdaq and S&P 500.
After a long and uncertain process, the Senate has confirmed that Kevin Warsh will officially replace Jerome Powell as the head of the Federal Reserve for a four-year term.
Although he has not served on the Federal Reserve board since 2011, the new Fed Chair has stayed close to economics and finance as a partner at Stanley Druckenmiller's family office, one of the world’s top-performing hedge funds.
US stock benchmarks are mostly rising after the news, but the market’s reaction to Warsh’s confirmation is mixed.
The tech-heavy Nasdaq continues to jump to new all-time highs, signalling a welcome change and benefiting from strong momentum in growth stocks.
In contrast, the Dow Jones Industrial Average is still struggling, as blue-chip investors try to figure out how a Fed led by Warsh will address persistent inflation and ongoing global challenges.
Daily market performance, May 8, 2026. Source: Finviz.
Overall, the reaction across different asset classes shows that participants are feeling uncertain.
Both the US Dollar and precious metals are still rising, building on their strong weekly gains as investors look to cover bearish positions in the asset class, while cryptocurrencies and US Treasuries continue to struggle.
The market division shows that investors are still unsure about the new Fed Chair’s approach. Traders will have to assess his views at the coming FOMC meeting on June 17.
Explore the different reactions in stock markets by diving into intraday charts and trading levels for the Dow Jones Industrial Average, Nasdaq Composite, and S&P 500.
Current Session's Stock Heatmap
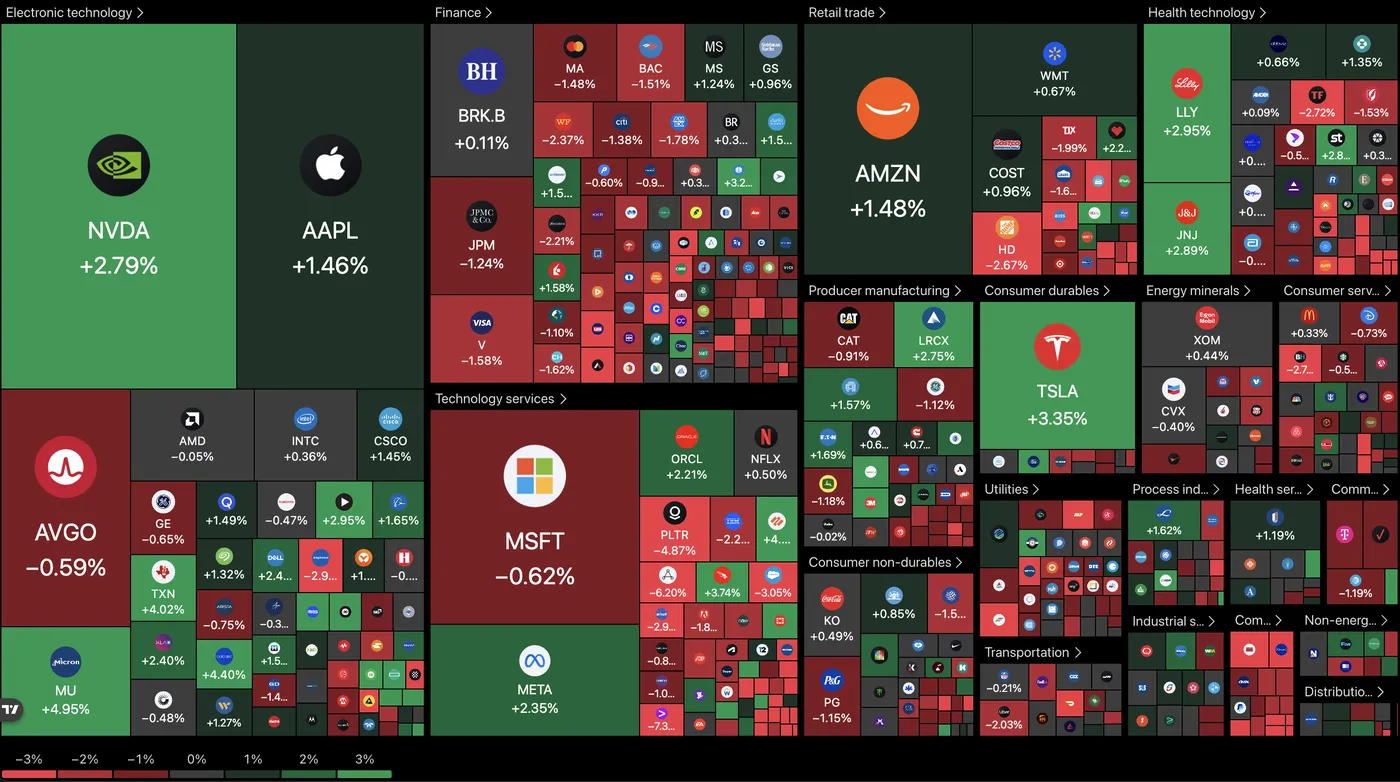
Current picture for the stock market, 15:14. Source: TradingView, May 13, 2026.
The stock market heatmap is still heavily fractured. Stock market leaders like Nvidia, Tesla, Eli Lilly and a few semiconductors are doing the heavy lifting, while other names largely struggle and the AI boom continues to bulldoze the Nasdaq to new records.
Dow Jones 1H Chart and Trading Levels
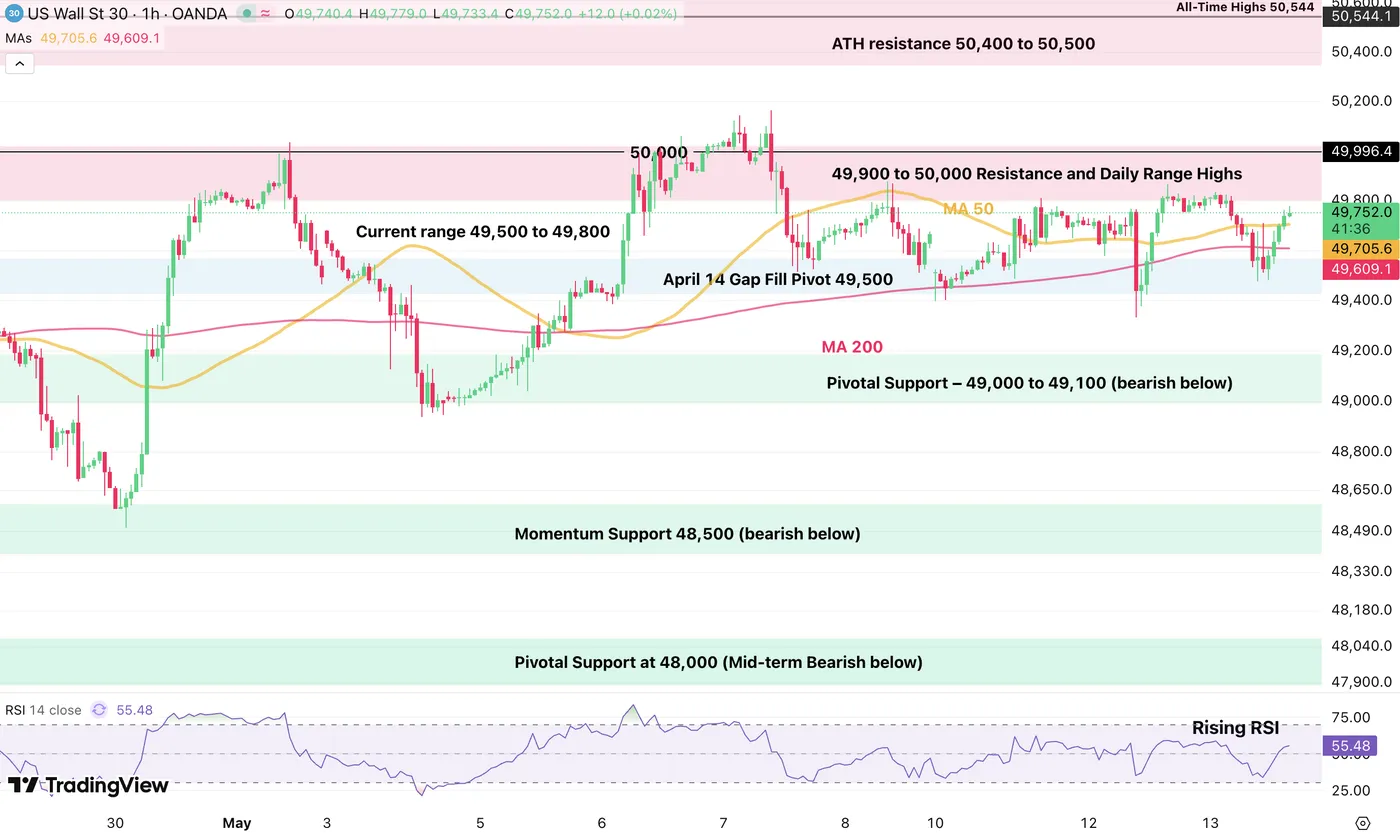
Dow Jones CFD 1H chart. Source: TradingView, May 13, 2026.
After initial struggles, the Dow Jones is rallying back to the top of its tighter consolidation between 49,500 and 49,800, which provides further strength of support and resistance levels.
For an upside breakout, look for a 1H candle break on high volume above 49,800. The confirmation comes on a close above 50,000.
On the other hand, bears will want to see a break below 49,500 and a longer-run pullback below 49,000.
Dow Jones technical levels for trading:
Resistance Levels
- 49,780 post-Warsh confirmation highs
- 49,900 to 50,000 resistance and early 2026 highs, range highs
- ATH resistance 50,400 to 50,500
- All-time highs 50,544
Support Levels
- April 14 gap fill pivot 49,500, mini range lows and short-term bearish below
- Major pivot: 49,000 to 49,100, mid-term bearish below
- Momentum support 48,500
- Pivotal support at 48,000
- Mini support 47,400 to 47,600
Nasdaq 1H Chart and Trading Levels
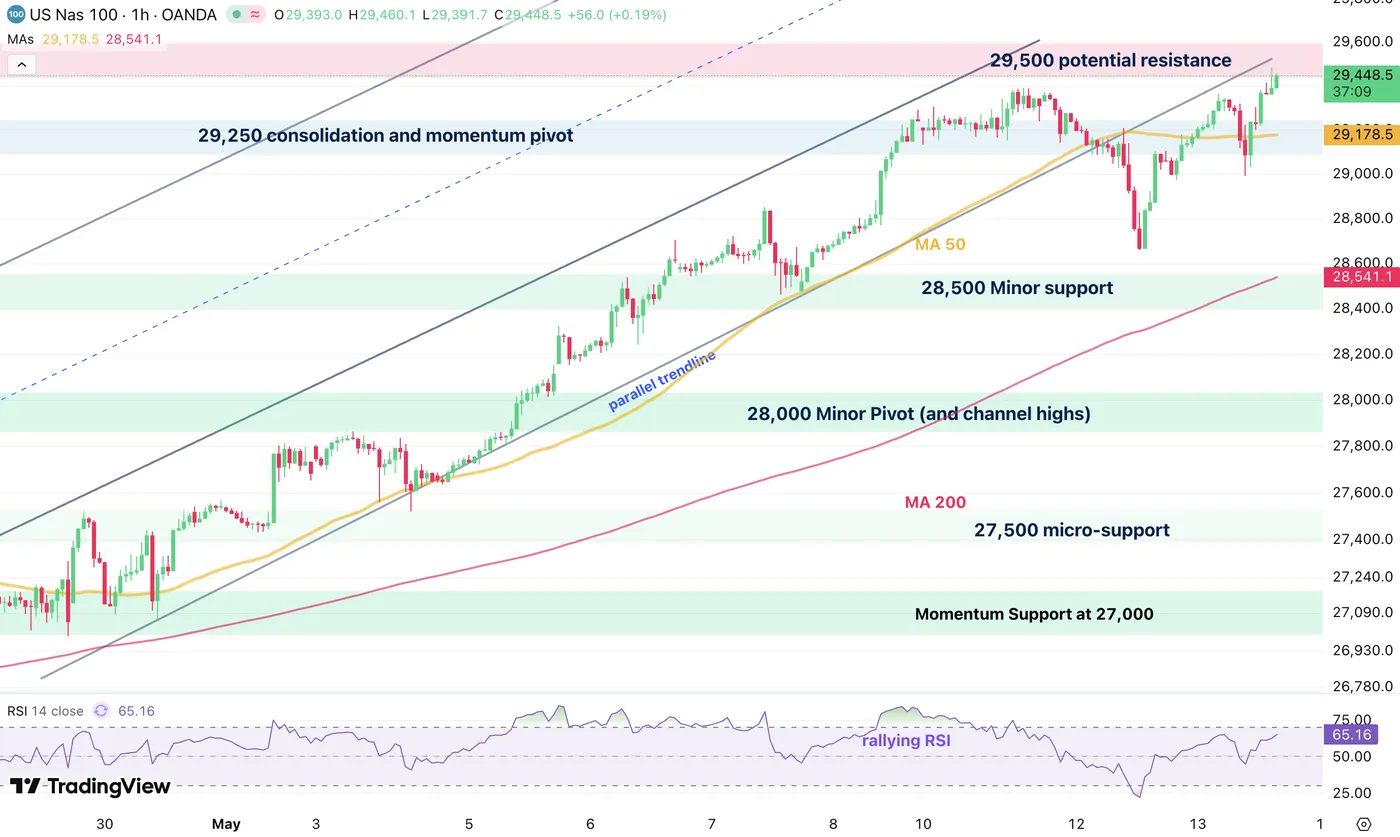
Nasdaq CFD 1H chart. Source: TradingView, May 13, 2026.
Despite the record highs reached in today's session, led by a gigantic rebound after yesterday's rough correction, the immediate highs are not so optimistic.
Indeed, the new record is stalling right above the previous record, a price action that hints at stop chasing rather than a continuous rise. Still, the previous rally hints at decent potential for upside, but to confirm, the index will have to print above 29,600.
On the other hand, if the action falls below the 50-hour MA at 29,160, the action may get dire.
Nasdaq technical levels of interest:
Resistance Levels
- 29,485 morning highs
- Next level 29,600, short-term bullish above
Support Levels
- 50-hour MA at 29,160, short-term bearish below
- 28,500 short-term pivot
- 28,000 major psychological resistance now pivot and channel highs
- Momentum pivot at 27,000, 4H 50-period MA
- Mini-support 26,600 to 26,750
- Prior ATH support 26,200 to 26,300
S&P 500 2H Chart and Trading Levels
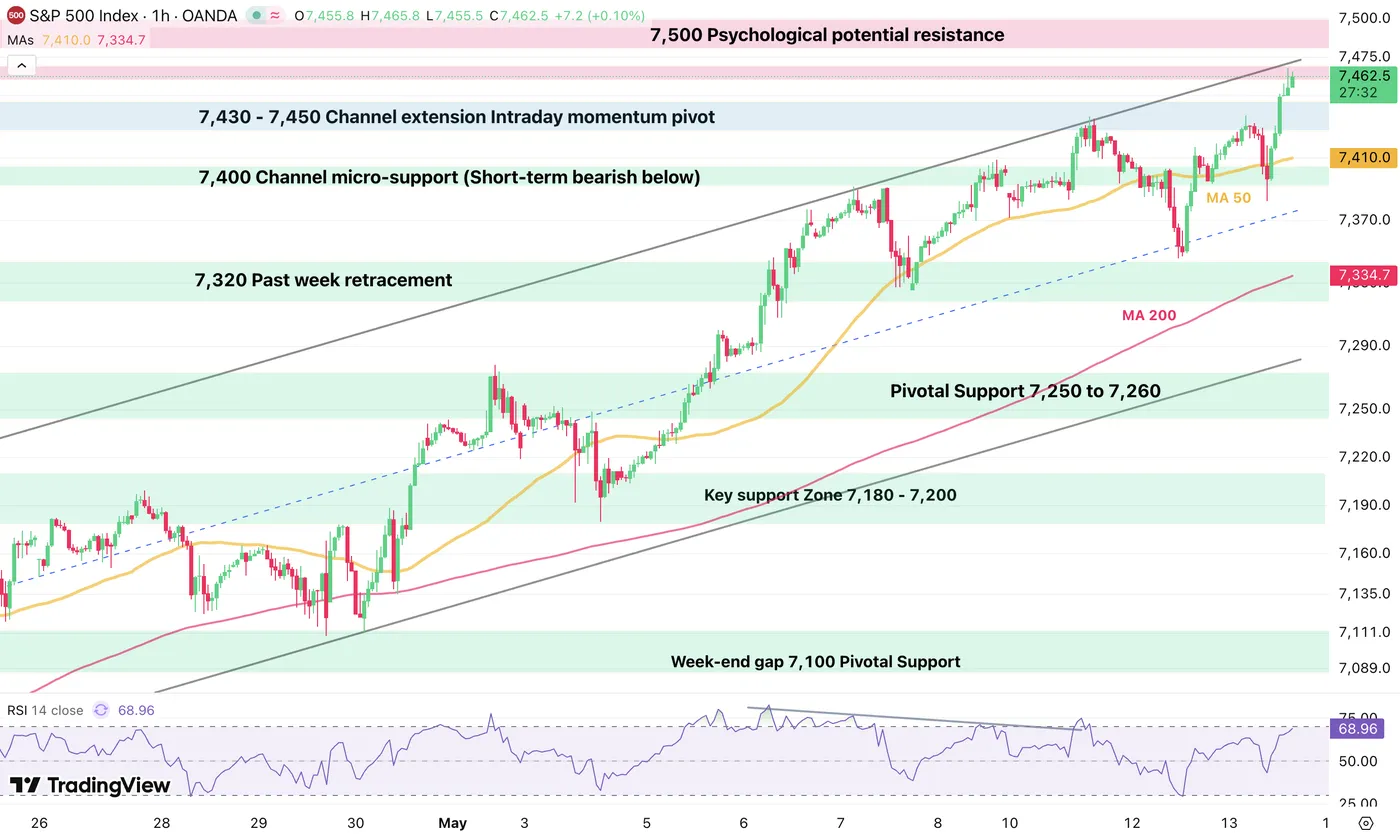
S&P 500 CFD 1H chart. Source: TradingView, May 13, 2026.
The S&P 500 is continuously following the higher part of its bull channel, helping a consistent bounce to new all-time highs. The index is showing the strongest intraday price action out of the three major US benchmarks.
As long as the action remains above the channel's mid-line at 7,375, expect the rally to persistent records to continue.
S&P 500 technical levels of interest:
Resistance Levels
- 7,390 to 7,400 channel extension resistance, morning highs
- 7,415 161.% Fib
- Next stop 7,480
Support Levels
- Momentum pivot 7,250 to 7,260
- Channel lows 7,230, bearish below
- 7,100 psychological level
- Prior ATH pivot 7,000 to 7,020
- Minor support 6,880 to 6,900
- Pivotal support 6,750 to 6,770
- 6,300 psychological level, war lows
Keep track of WTI crude and the latest headlines throughout the week to stay ahead of the game.
Safe trades.
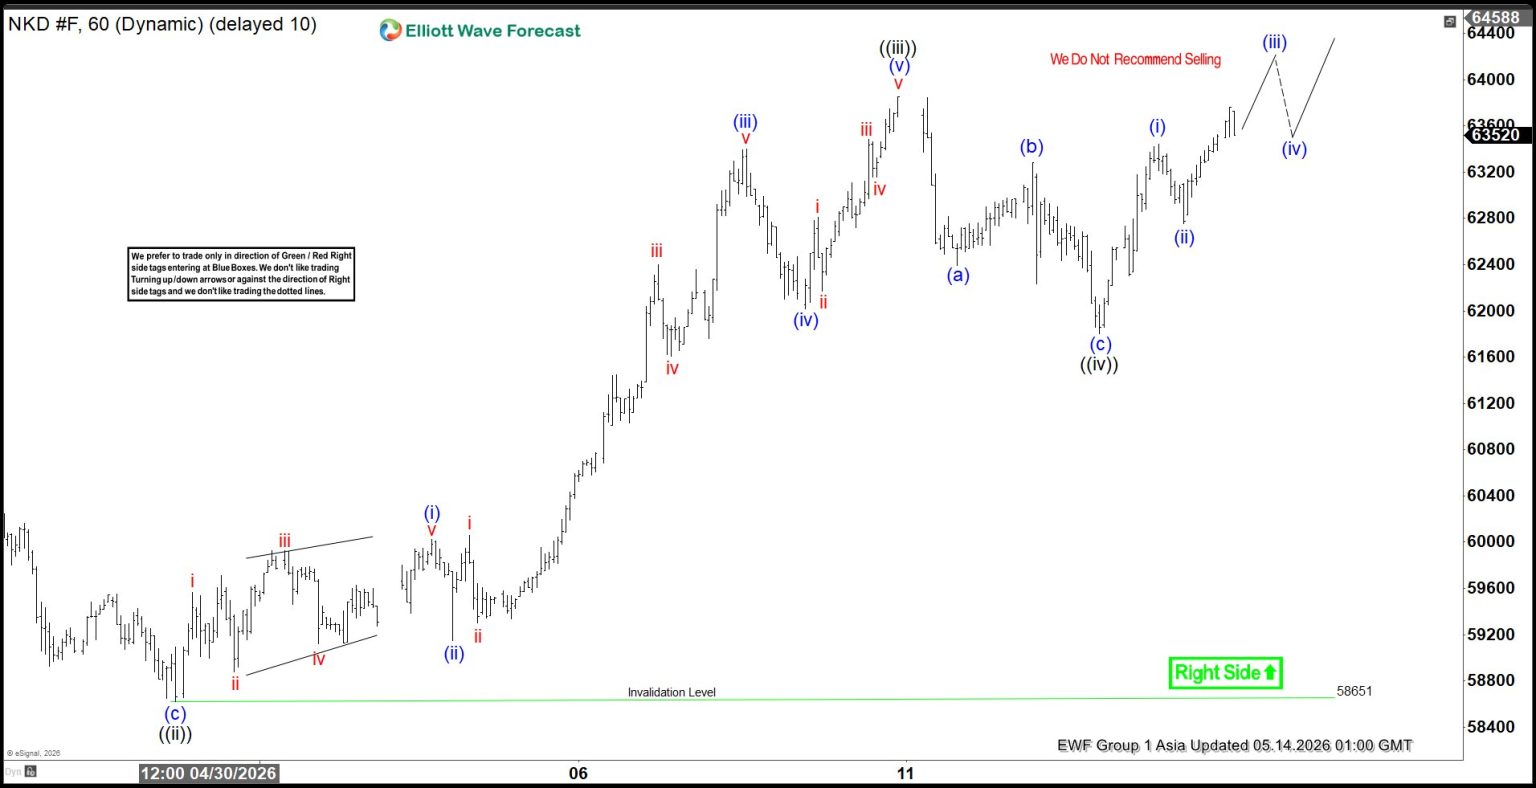
Elliott Wave View: Nikkei Futures (NKD) Approaches End of Cycle from March 2026 Low
The short‑term Elliott Wave view in Nikkei Futures (NKD) shows the cycle from the March 30, 2026 low unfolding as an impulse. This sequence is now approaching completion. From that low, wave ((i)) advanced to 61,000, followed by a corrective decline in wave ((ii)) that ended at 58,651. The Index then resumed higher in wave ((iii)), which subdivided into a smaller impulsive structure.
From the end of wave ((ii)), wave (i) advanced to 60,025, while wave (ii) corrected to 59,150. The Index rallied in wave (iii) toward 63,400, before a dip in wave (iv) concluded at 62,020. The final leg, wave (v), reached 63,850, completing wave ((iii)) at a higher degree. A subsequent pullback unfolded in wave ((iv)) as a zigzag. Down from wave ((iii)), wave (a) ended at 62,390, wave (b) advanced to 63,285, and wave (c) declined to 61,805. This completed wave ((iv)) at a higher degree.
Near term, as long as price remains above 58,651, the Index retains scope to extend higher and complete wave ((v)). That move would also finalize the cycle from the March 30 low. Once this sequence concludes, a larger degree pullback should correct the entire cycle. Such a correction will serve as consolidation, balancing prior gains and preparing the structure for the next bullish advance.
Nikkei Futures (NKD_F) 60-Minute Elliott Wave Chart
NKD_F Elliott Wave Video:
https://www.youtube.com/watch?v=S3TFAxlMZBM
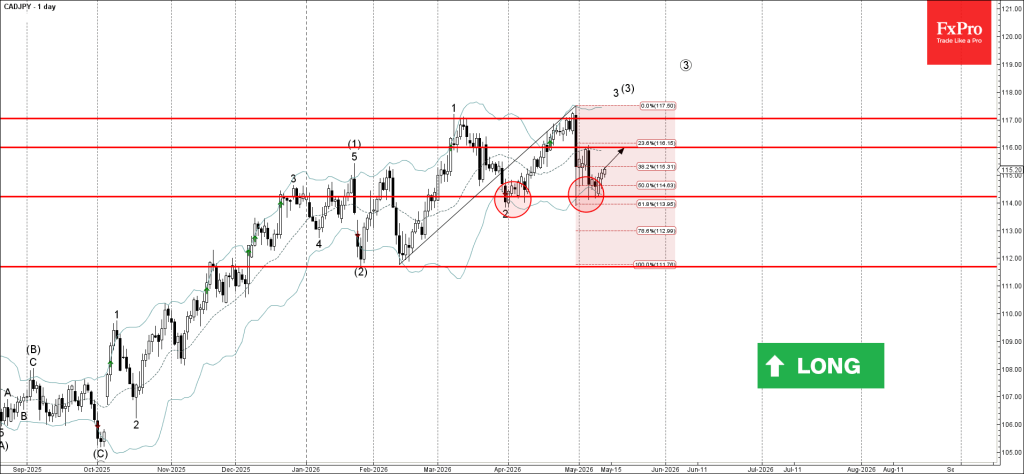
CADJPY Wave Analysis
CADJPY: ⬆️ Buy
- CADJPY reversed from support level 114.20
- Likely to rise to resistance level 116.00
CADJPY recently reversed up from the support level 114.20 (which has been reversing the pair from the end of March), standing near the lower daily Bollinger Band and the 61.8% Fibonacci correction of the upward impulse from February.
The upward reversal from the support level 114.20 continued the active impulse waves 3 and (3).
Given the clear daily uptrend, CADJPY can be expected to rise to the next resistance level 116.00 – former minor resistance from the start of May.