Sample Category Title
Eco Data 5/14/26
| GMT | Ccy | Events | Act | Cons | Prev | Rev |
|---|---|---|---|---|---|---|
| 23:01 | GBP | RICS Housing Price Balance Apr | -34% | -25% | -23% | |
| 23:50 | JPY | Money Supply M2+CD Y/Y Apr | 2.30% | 2.10% | 2.00% | |
| 06:00 | GBP | GDP Q/Q Q1 P | 0.60% | 0.60% | 0.10% | |
| 06:00 | GBP | GDP M/M Mar | 0.30% | -0.10% | 0.50% | 0.40% |
| 06:00 | GBP | Goods Trade Balance (GBP) Mar | -27.2B | -20.1B | -18.8B | |
| 12:30 | CAD | Wholesale Sales M/M Mar | 1.90% | 1.30% | 2.00% | |
| 12:30 | USD | Initial Jobless Claims (May 8) | 211K | 205K | 200K | 199K |
| 12:30 | USD | Retail Sales M/M Apr | 0.50% | 0.50% | 1.70% | |
| 12:30 | USD | Retail Sales ex Autos M/M Apr | 0.70% | 0.60% | 1.90% | |
| 12:30 | USD | Import Price Index M/M Apr | 1.90% | 1.10% | 0.80% | |
| 14:00 | USD | Business Inventories Mar | 0.90% | 0.30% | 0.40% | |
| 14:30 | USD | Natural Gas Storage (May 8) | 85B | 86B | 63B |
| 23:01 | GBP |
| RICS Housing Price Balance Apr | |
| Actual | -34% |
| Consensus | -25% |
| Previous | -23% |
| 23:50 | JPY |
| Money Supply M2+CD Y/Y Apr | |
| Actual | 2.30% |
| Consensus | 2.10% |
| Previous | 2.00% |
| 06:00 | GBP |
| GDP Q/Q Q1 P | |
| Actual | 0.60% |
| Consensus | 0.60% |
| Previous | 0.10% |
| 06:00 | GBP |
| GDP M/M Mar | |
| Actual | 0.30% |
| Consensus | -0.10% |
| Previous | 0.50% |
| Revised | 0.40% |
| 06:00 | GBP |
| Goods Trade Balance (GBP) Mar | |
| Actual | -27.2B |
| Consensus | -20.1B |
| Previous | -18.8B |
| 12:30 | CAD |
| Wholesale Sales M/M Mar | |
| Actual | 1.90% |
| Consensus | 1.30% |
| Previous | 2.00% |
| 12:30 | USD |
| Initial Jobless Claims (May 8) | |
| Actual | 211K |
| Consensus | 205K |
| Previous | 200K |
| Revised | 199K |
| 12:30 | USD |
| Retail Sales M/M Apr | |
| Actual | 0.50% |
| Consensus | 0.50% |
| Previous | 1.70% |
| 12:30 | USD |
| Retail Sales ex Autos M/M Apr | |
| Actual | 0.70% |
| Consensus | 0.60% |
| Previous | 1.90% |
| 12:30 | USD |
| Import Price Index M/M Apr | |
| Actual | 1.90% |
| Consensus | 1.10% |
| Previous | 0.80% |
| 14:00 | USD |
| Business Inventories Mar | |
| Actual | 0.90% |
| Consensus | 0.30% |
| Previous | 0.40% |
| 14:30 | USD |
| Natural Gas Storage (May 8) | |
| Actual | 85B |
| Consensus | 86B |
| Previous | 63B |
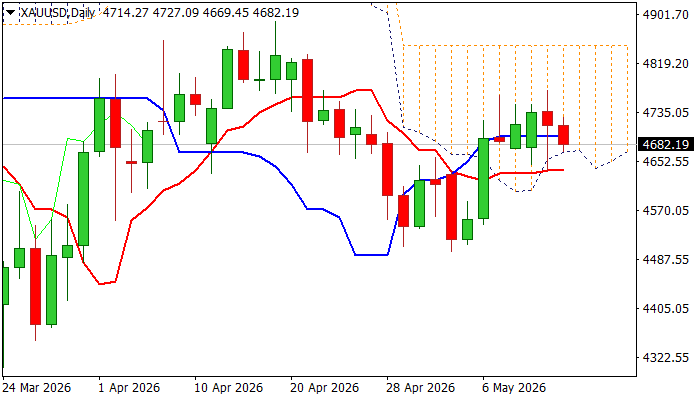
Gold Stands at the Back Foot as Dollar Benefits from Higher US Inflation
Gold holds in red for the second consecutive day, pressured by stronger dollar on growing uncertainty in the Middle East and sidelined expectations for potential Fed rate cuts, as inflation in the US rose further (both consumer and producer price index rose significantly in April).
Fundamentals, however, show mixed signals as Fed is likely to stay on hold until the end of the year that would add support to dollar, while growing worries of further economic slowdown would partially counter negative impact and keep the metal’s price afloat.
Near-term action moves within $4650/$4770 congestion (also holds within daily cloud) and moving around range’s mid-point ($4700 zone) after repeated upside rejection ($4764/$4773), with the range floor being reinforced by daily cloud base ($4667) and daily Tenkan-sen ($4637).
Technical picture on daily chart is mixed (neutral momentum studies / MAs in mixed setup), although currently forming 55/100DMA may produce stronger pressure.
Look for initial negative signals on violation of near-term range floor that would boost downside potential on formation of double-top ($4764/73) and unmask next key support at $4500 zone.
On the flip side, break above $4773 and 100DMA ($4790) would brighten near-term outlook and open way for attack at daily cloud top ($4848).
Res: 4700; 4773; 4790; 4835
Sup: 4650; 4636; 4546; 4500
Sunset Market Commentary
Markets
The geopolitical focus turns from the Middle East to China the next two days as US President Trump pays a high-profile visit to Beijing. Expectations going into the summit with Chinese President Xi Jinping are rather low. An extension of the current, fragile, stabilization on trade and an agreement to a follow-up meeting seems to be the best outcome. The US hopes to secure more Chinese promises for purchases US goods and maybe also some help with forcing Iran to the negotiation table. By granting a predictable trade framework, the US hopes to avoid that China uses its stronghold on the export of critical minerals. China on its side might seek concessions on Taiwan which is a thorny issue and potential pitfall for the capricious US president.
April US producer prices surged more than expected. Headline PPI accelerated to 1.4% M/M. That monthly pace is the second fastest since the start of the series at the end of 2009. It ranks second to March 2022 (1.7% M/M) with the start of the Russian invasion coming on top op reopening post-Covid economies. On an annual level, producer price inflation increased from an upwardly revised 4.3% to 6% (vs 4.8% consensus). That’s the strongest pace since December 2022. Core PPI markets showed the same dynamic. Producer prices excluding food and energy rose by 1% M/M and 5.2% Y/Y. Also stripping out trade resulted in 0.6% M/M and 4.4% Y/Y. Services costs rose by 1.2% M/M, the most in four years. Broadening price pressures triggered intraday underperformance of US Treasuries. The US 2-yr yield briefly breached the psychologic 4% barrier. The US 10-yr yield was a whisker away of 4.5%, reaching the highest level since July of last year. The US 30-yr yield extends its stay above 5% and keeps the multi-annual highs around 5.15% withing sight. Tonight’s $25bn 30-yr bond sale will be closely monitored after yesterday’s sluggish $10-yr Note sale. Interest rate support and sticky oil prices ($107.5/b) continue to offer some support for the dollar with EUR/USD currently changing hands around 1.17. The EMU eco calendar was thin so far this week, but speeches by ECB President Lagarde and chief economist Lane after European trading have market moving potential. Lane is expected to update the slide deck he’s used on a number of occasions since the start of the war in Iran. It will be especially interesting to see how current pricing relates to the central bank’s base and adverse scenario’s. Lagarde and other ECB members recently suggested that we’re moving further away from base. An adverse scenario calls for a measured adjustment of policy as currently discounted in money markets. The market-implied probability of a June 25 bps rate hike currently stands at 83% with markets discounting a cumulative 75 bps of tightening by end 2026.
News & Views
The Hungarian forint slipped intraday, moving from as high as EUR/HUF 357 to 360. The pair is currently changing hands around 358.7. The currency weakened after the central bank unexpectedly lowered the interest rate on FX swaps by 50 bps to 5.25%. “The purpose of the instrument is to serve as a back-up option on the FX-swap market, thereby ensuring the effective interest rate transmission,” the statement noted. But with market and liquidity conditions having improved, Budapest saw “greater room for market-based developments to prevail”. The current rate is 100 bps lower below the base rate but that should not be seen as a change “in the strict and careful monetary policy stance”. The MNB decision comes after a strong surge Hungarian assets, in the currency but also government bonds. EUR/HUF traded north of 390 in the wake of the Iran war before staging an impressive comeback, supported by the ceasefire and later pro-European Tisza’s election victory mid-April.
OPEC lowered its forecast for oil demand growth in 2026 today. It now projects demand to expand by 1.2 mln barrels per day compared to the 1.4 mln it had pencilled in last month. That should rise to approximately 1.5 mln in 2027, an upward revision by 200k from the April forecast. OPEC stuck to its supply growth forecast coming from countries outside the cartel, amounting to 600k barrels a day both in 2026 and 2027. Brazil, Canada, the US and Argentina were the prime drivers. Its views on global economic GDP growth also remained unchanged at 3.1% and 3.2% this year and the next respectively.
Time Is on Crude’s Side
- Global oil reserves are falling due to the closure of the Strait of Hormuz.
- Several buffers have prevented oil prices from soaring.
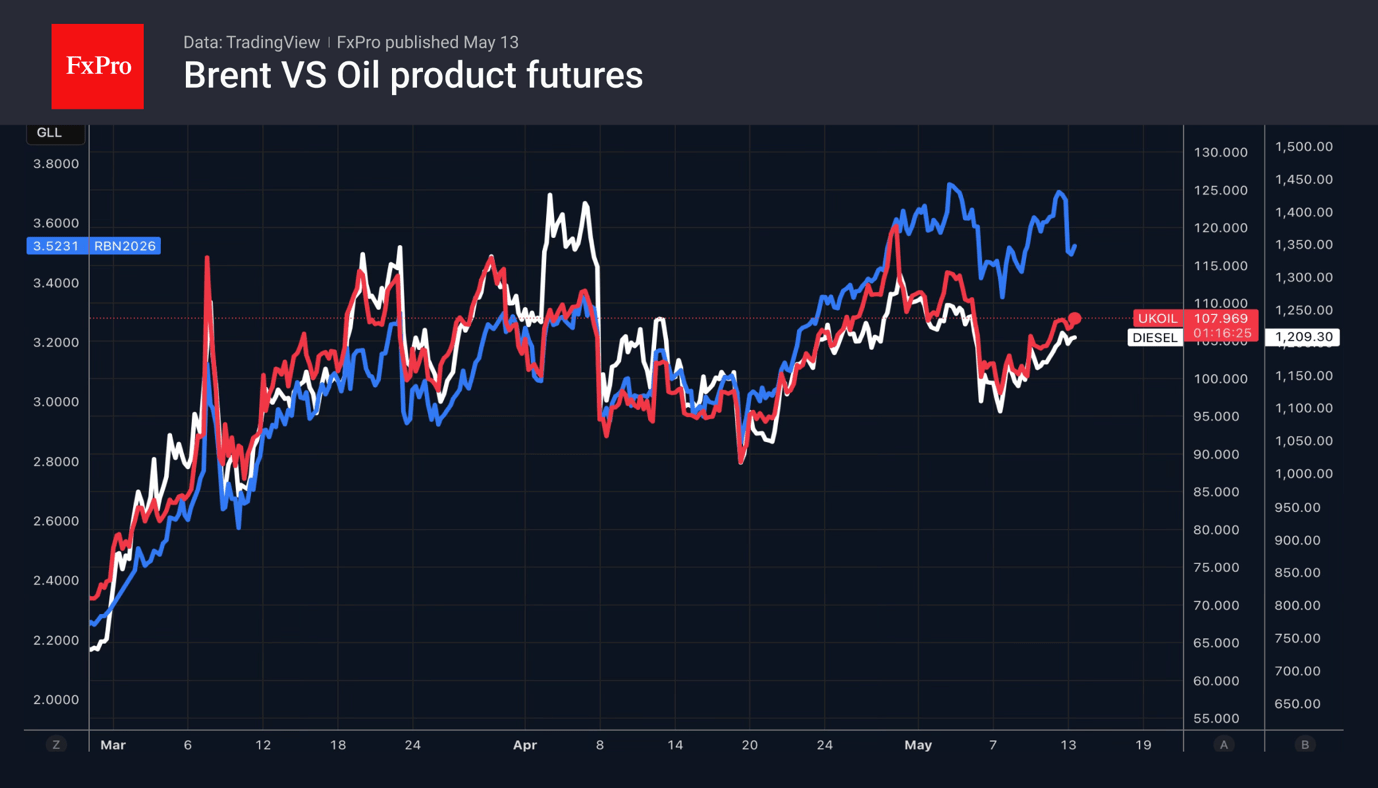
Oil is in a race against time. The longer the Strait of Hormuz remains blocked, the greater the chances of higher Brent and WTI prices in the longer term. The US Energy Information Administration estimates a reduction in global oil reserves of 2.6 mln bpd, assuming the world’s main artery resumes operations by summer. This figure is significantly higher than the previous forecast of 0.3 mln bpd. The average price of North Sea crude in 2026 is expected to be $95 per barrel.
The International Energy Agency estimates the oil market deficit at 1.78 mln bpd. In April and December, it forecast surpluses of 0.41 mln bpd and 4 mln bpd, respectively. Even if the conflict in the Middle East ends by early June, a serious imbalance will persist until the end of the third quarter.
Given these figures, the price of a barrel of Brent at around $105 seems too low, as it has hovered near this level since the second half of March. Moreover, there is now almost no difference between futures and spot prices, whereas at the start of April, the spread exceeded $30, a record high. What is the reason for this?
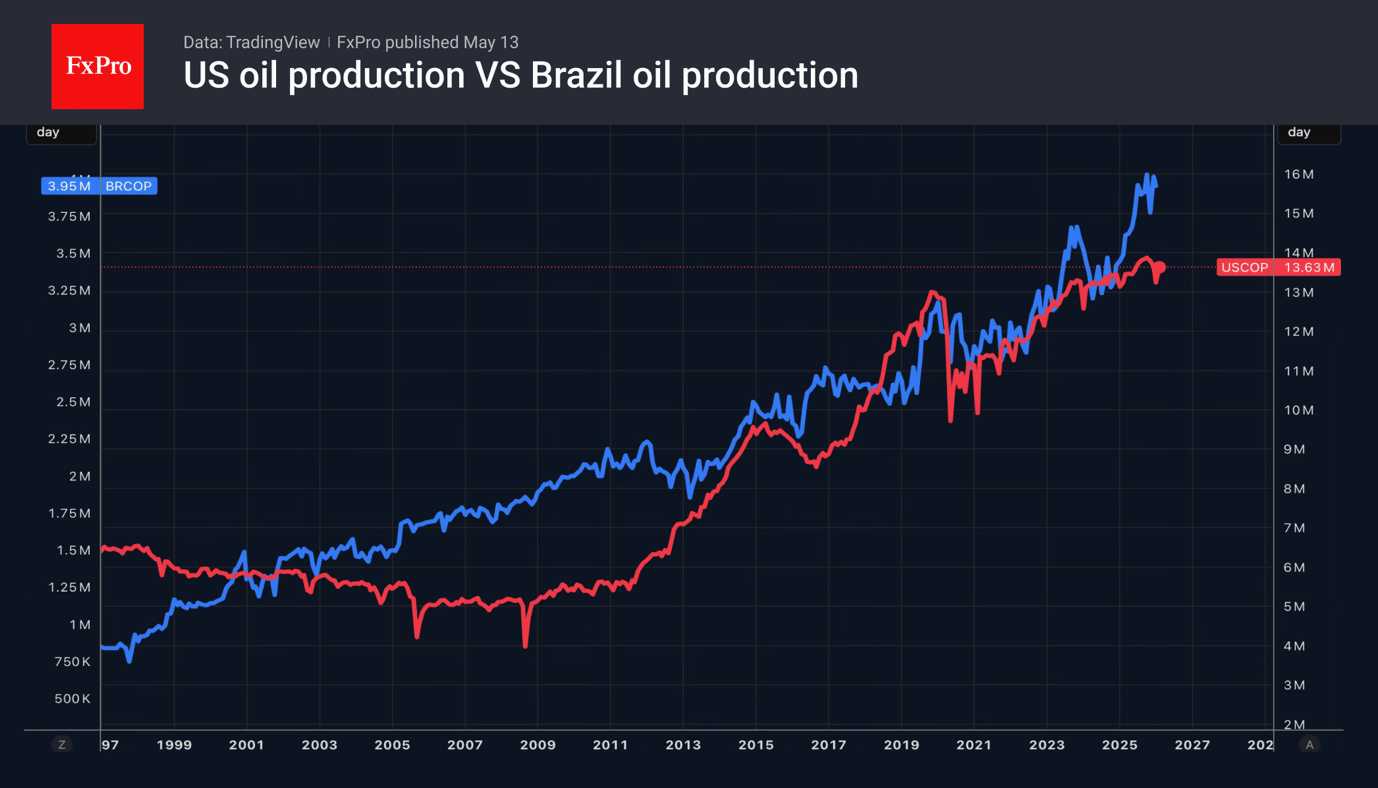
The global oil market has managed to utilise several buffers that are currently holding back price rises. Before the conflict in the Middle East, it was in surplus, building stocks and bringing China’s reserves to an impressive 1.4 bn barrels—more than a year’s consumption. The US is exporting nearly 10 mln bpd, compared with 4–6 mln bpd in the previous couple of years. Canada has increased exports by 0.4 mln bpd compared with a year earlier; Venezuela and Norway by 0.2 mln each; and Brazil by 0.1 mln. Saudi Arabia and the UAE have also found workarounds.
JP Morgan points to faster growth in petrol and diesel prices compared with crude oil. This reduces consumer demand and decreases refineries’ need for feedstock. The US Energy Information Administration forecasts a slower increase in global demand in 2026—from +0.6 mln bpd in the previous estimate to +0.2 mln bpd. Furthermore, calculations indicate a drop in demand of approximately 5 mln bpd. This is too significant to be considered a sustainable trend, signalling that consumers are simply trying to weather the storm, whereas in 2022, they were rushing to stock up. It is worth noting separately that some of the lost demand may not return to the market at all, reviving interest in alternative energy sources.
Nevertheless, the oil shortage created by the closure of the Strait of Hormuz is laying the foundations for future price growth. The blockade of the world’s key oil artery is leading to overflowing storage tanks, reduced production, and destroyed capacity. Thus, time is on the side of the Brent bulls.
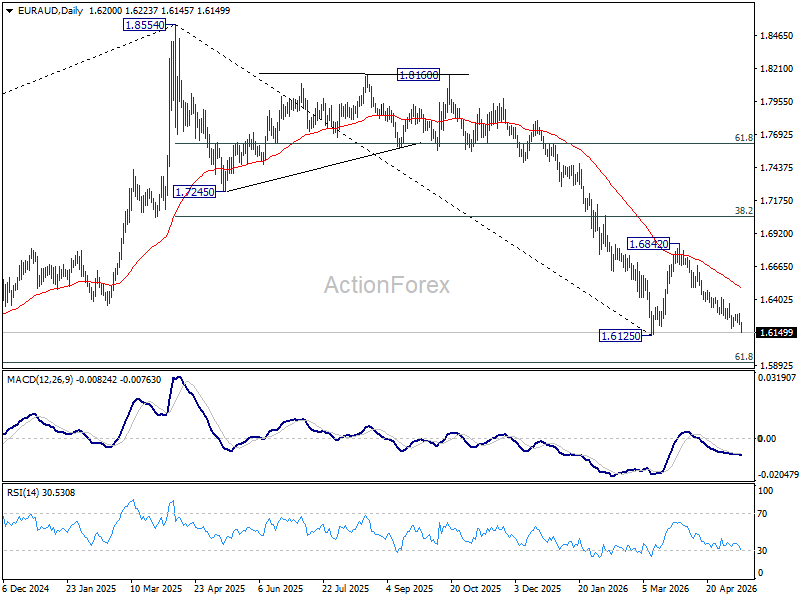
EUR/AUD Mid-Day Outlook
Daily Pivots: (S1) 1.6169; (P) 1.6231; (R1) 1.6262; More...
EUR/AUD's fall from 1.6842 resumed after brief consolidations and intraday bias is back on the downside. Decisive break of 1.6125 will resume larger fall from 1.8554. Next target is 1.5913 fibonacci level. Nevertheless, break of 1.6293 resistance will indicate short term bottoming, and turn bias back to the upside for stronger rebound to 55 D EMA (now at 1.6494).
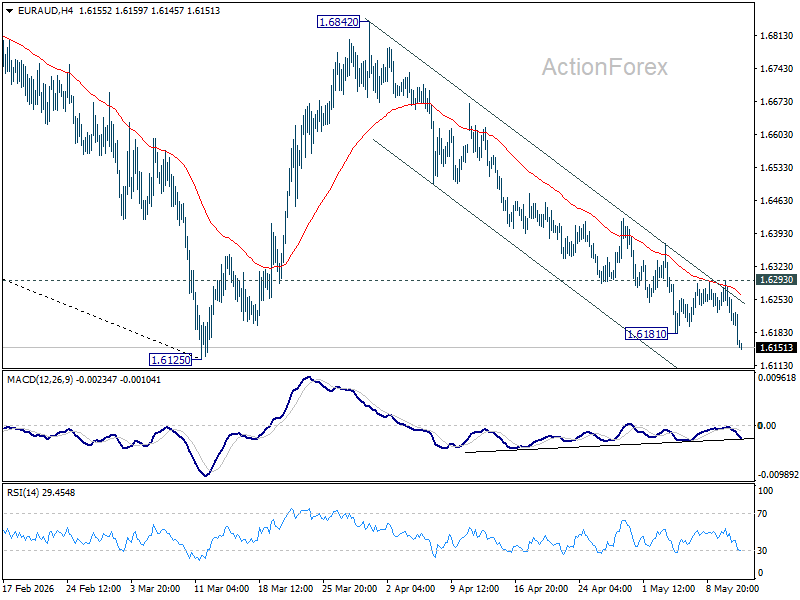
In the bigger picture, fall from 1.8554 (2025 high) is in progress and deeper decline should be seen to 61.8% retracement of 1.4281 to 1.8554 at 1.5913, which is slightly below 1.5963 structural support. Decisive break there will pave the way back to 1.4281 (2022 low). For now, risk will stay on the downside as long as 55 W EMA (now at 1.7039) holds, even in case of strong rebound.
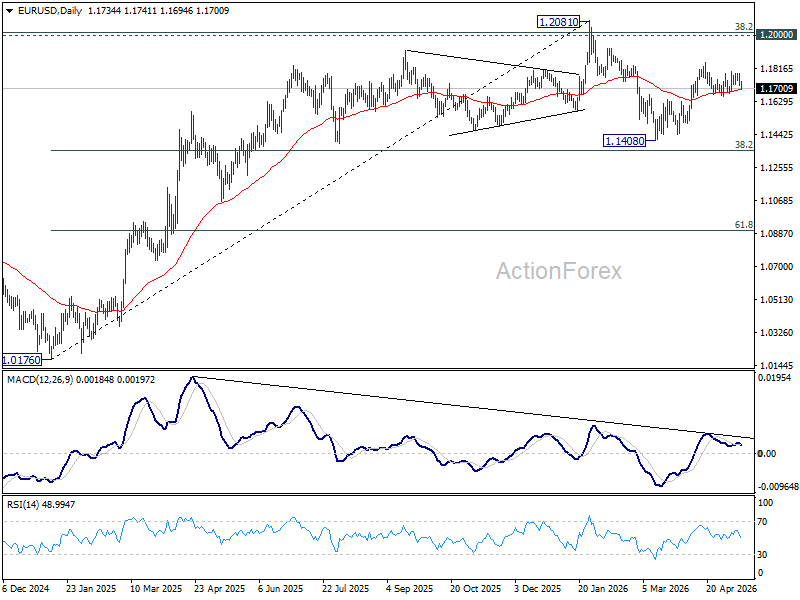
EUR/USD Mid-Day Outlook
Daily Pivots: (S1) 1.1709; (P) 1.1748; (R1) 1.1775; More….
Intraday bias remains neutral as EUR/USD is still bounded in range trading. Further rise is expected with 1.1642 support intact. On the upside, firm break of 1.1848 will target 1.2081 high next. However, firm break of 1.1662 support will indicate the the rebound from 1.1408 has completed, and bring deeper decline back towards this low instead.
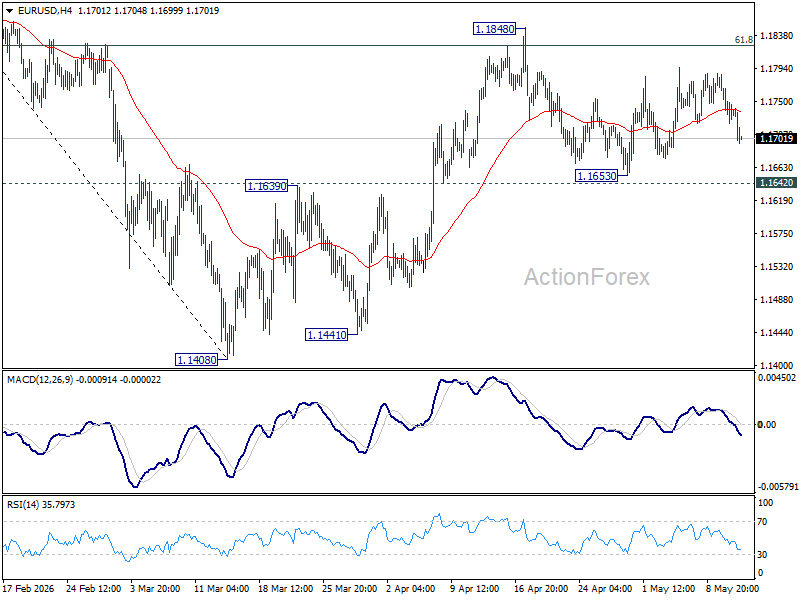
In the bigger picture, the strong support from 38.2% retracement of 1.0176 to 1.2081 at 1.1353 suggests that the pullback from 1.2081 is more likely a corrective move. Strong support was also found in 55 W EMA (now at 1.1539). Focus is back on 1.2 key cluster resistance level. Decisive break there will carry long term bullish implications. Nevertheless, break of 1.1408 support will revive the case of medium term bearish trend reversal.
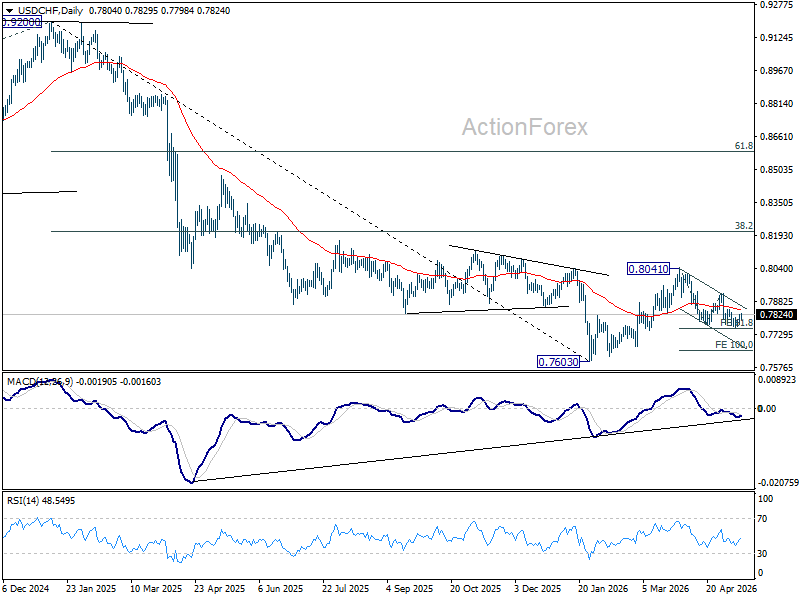
USD/CHF Mid-Day Outlook
Daily Pivots: (S1) 0.7770; (P) 0.7796; (R1) 0.7827; More….
No change in USD/CHF's outlook as range trading continues, and intraday bias remains neutral. With 0.7847 resistance intact, further decline is expected. On the downside, decisive break of 0.7760 will resume the whole decline form 0.8041, and target 100% projection of 0.8041 to 0.7774 from 0.7923 at 0.7656. However, firm break of 0.7847 resistance will indicate short term bottoming, and bring stronger rebound back to 0.7923 resistance.
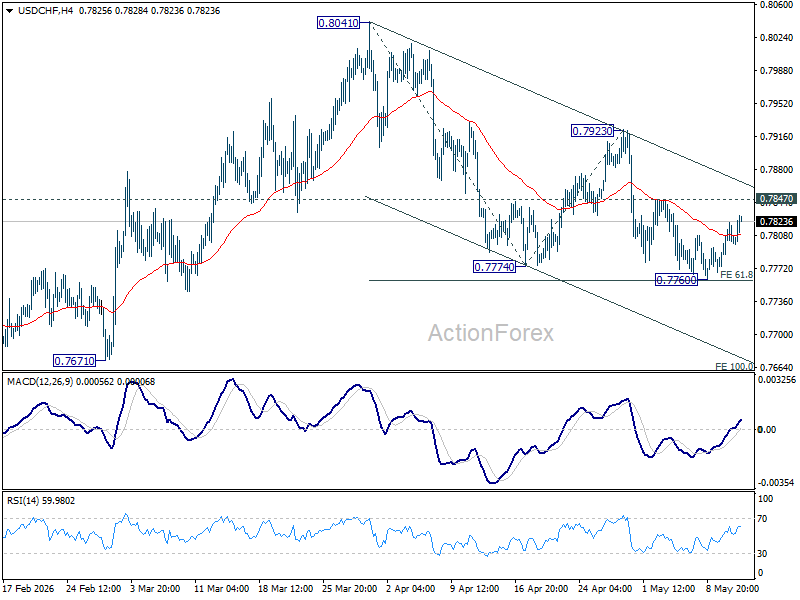
In the bigger picture, as long as 55 W EMA (now at 0.8051) holds, fall from 0.9200 is expected to continue, as part of the larger down trend. Firm break of 0.7603 will target 100% projection of 1.0146 (2022 high) to 0.8332 from 0.9200 at 0.7382.
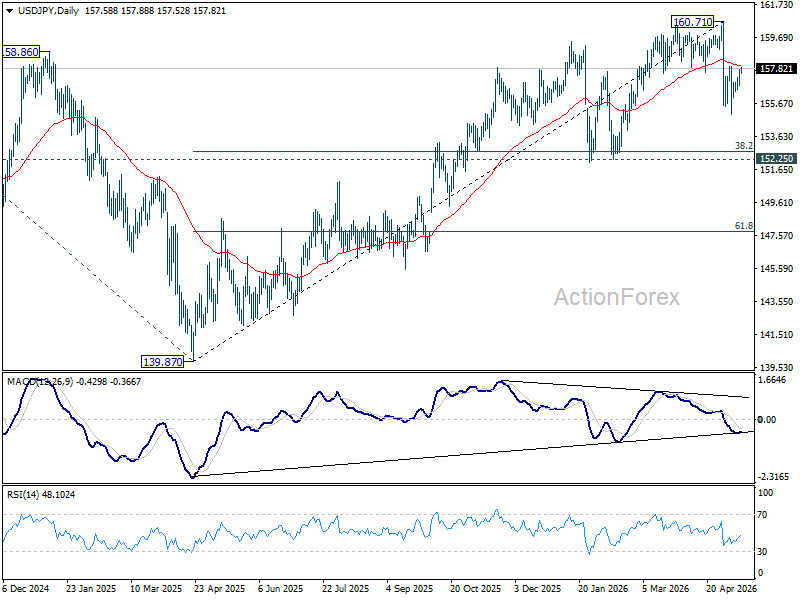
USD/JPY Mid-Day Outlook
Daily Pivots: (S1) 156.96; (P) 157.36; (R1) 157.99; More...
Intraday bias in USD/JPY remains neutral and outlook is unchanged. On the downside, below 156.77 minor support will bring retest of 155.01. Firm break there will resume the fall from 160.71 to 152.25 support next. On the upside, however, firm break of 157.92 will indicate that pullback from 160.71 has completed, and turn bias back to the upside for stronger rebound.
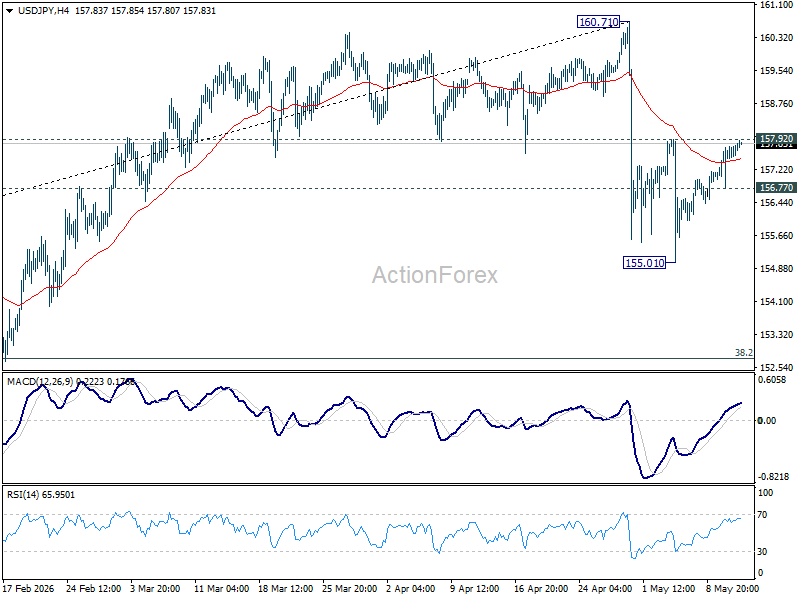
In the bigger picture, for now, corrective pattern from 161.94 (2024 high) is still seen as completed at 139.87. Rise from there is seen as resuming the long term up trend. So, break of 161.94 is expected at a later stage to resume the long term up trend. However, sustained break of 55 W EMA (now at 154.13) will dampen this view and bring deeper fall back towards 139.87 to extend the pattern from 161.94.
Dollar Firm as Sticky Inflation Lifts Fed Expectations, Sterling Hit by UK Leadership Crisis
Dollar stayed broadly firm after another major upside surprise in US inflation data reinforced expectations that the Federal Reserve will need to keep policy restrictive for longer. Sterling, meanwhile, remained under heavy pressure as Britain’s political crisis deepened further amid growing speculation that Prime Minister Keir Starmer could soon face a formal leadership challenge.
The latest US Producer Price Index report added to inflation concerns that had already intensified following Tuesday’s hotter-than-expected CPI release. The data reinforced concerns that elevated energy prices tied to the Middle East conflict are beginning to spread more deeply through the broader economy. PPI is widely viewed as a leading indicator for consumer inflation because higher production costs are eventually passed through to retail prices.
Fed rate expectations shifted further in response. Futures markets continued reducing expectations for policy easing this year, while implied odds of an additional Fed hike by year-end rose toward 40%. Some investors believe policymakers may eventually consider an “insurance” rate hike if inflation data over the coming months fails to reverse meaningfully.
Sterling, by contrast, came under renewed selling pressure as UK political instability intensified. Reports suggested Health Secretary Wes Streeting is preparing for his resignation and a possible formal leadership challenge against Prime Minister Keir Starmer as early as Thursday. According to reports, Streeting’s allies have already begun canvassing MPs in an effort to secure the 81 members needed to trigger a formal contest. The developments reinforced fears that Britain may be entering a prolonged period of political paralysis just as markets grow increasingly sensitive to rising gilt yields and fiscal risks.
Meanwhile, comments from ECB policymakers highlighted growing divisions inside the Governing Council over how to respond to the latest energy-driven inflation shock. Finland’s Olli Rehn warned of stagflation risks, arguing the ECB should avoid reacting mechanically to oil-driven inflation spikes while growth remains near stagnation. He stressed the importance of monitoring second-round effects such as wages and inflation expectations before committing to further tightening.
By contrast, Estonia’s Madis Muller adopted a significantly more hawkish tone, saying a June rate hike is “likely” unless there is a rapid resolution to Strait of Hormuz disruptions and a sharp decline in oil prices. French policymaker François Villeroy de Galhau struck the most cautious tone of the three, emphasizing that current inflation pressures remain largely energy-driven and warning against tightening prematurely before there is clearer evidence of persistent core inflation acceleration.
Overall for the week so far, Dollar is staying as the strongest performer but capped below last week's high against all but Sterling. Aussie is the second best, and then Loonie. The Pound is currently the worst, followed by Swiss Franc, and then Yen. Euro and Kiwi are positioning in the middle.
In Europe, at the time of writing, FTSE is down -0.10%. DAX is up 0.35%. CAC is down -0.44%. UK 10-year yield is down -0.014 at 5.093. Germany 10-year yield is down -0.003 at 3.107. Earlier in Asia, Nikkei rose 0.84%. Hong Kong HSI rose 0.15%. China Shanghai SSE rose 0.67%. Singapore Strait Times rose 1.17%. Japan 10-year JGB yield rose 0.049 to 2.593.
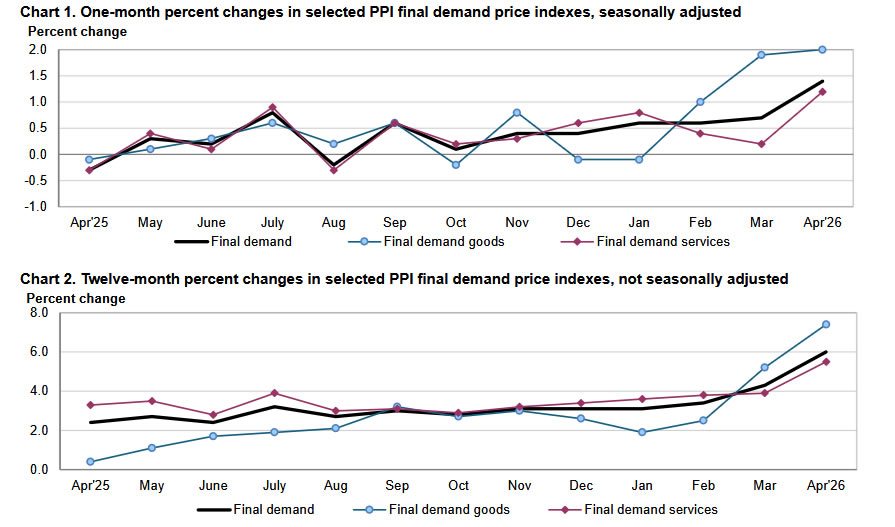
US PPI Surges to Highest Since 2022 as Upstream Inflation Pressures Intensify
US wholesale inflation delivered a major upside surprise in April as producer prices surged at the fastest monthly pace since 2022. Importantly, the pressure was not limited to energy alone, with both services and core producer prices accelerating sharply and reinforcing “higher for longer” Fed expectations. Read More.
Eurozone GDP Expands Just 0.1% in Q1, Annual Growth Slows to 0.8%
Eurozone growth lost momentum again in early 2026 as high energy prices and weak industrial activity continued weighing on the economy. Employment growth also softened, reinforcing concerns that Europe’s recovery remains fragile despite still-resilient labor markets. Read More.
Eurozone Industrial Production Misses Forecast as Energy Output Falls
Eurozone industrial production improved modestly in March, but the underlying details showed a highly uneven recovery. While capital goods and investment-related sectors strengthened, consumer goods output weakened sharply, highlighting persistent softness in household demand across Europe. Read More.
OECD Sees BoJ Raising Rates to 2% by End-2027
The OECD believes Japan’s monetary normalization cycle is still in its early stages, projecting the BOJ’s policy rate will rise from 0.75% to 2% by the end of 2027. Strong wage growth, resilient domestic demand, and improving inflation dynamics are increasingly supporting the case for continued tightening. Read More.
New Zealand Inflation Expectations Jump as RBNZ OCR Outlook Turns Hawkish
The RBNZ’s latest Survey of Expectations showed inflation concerns intensifying sharply in New Zealand, with one-year CPI expectations surging above 3.4% while markets also lifted their outlook for future OCR settings. At the same time, growth expectations weakened noticeably, highlighting a more difficult balancing act for policymakers. Read More.
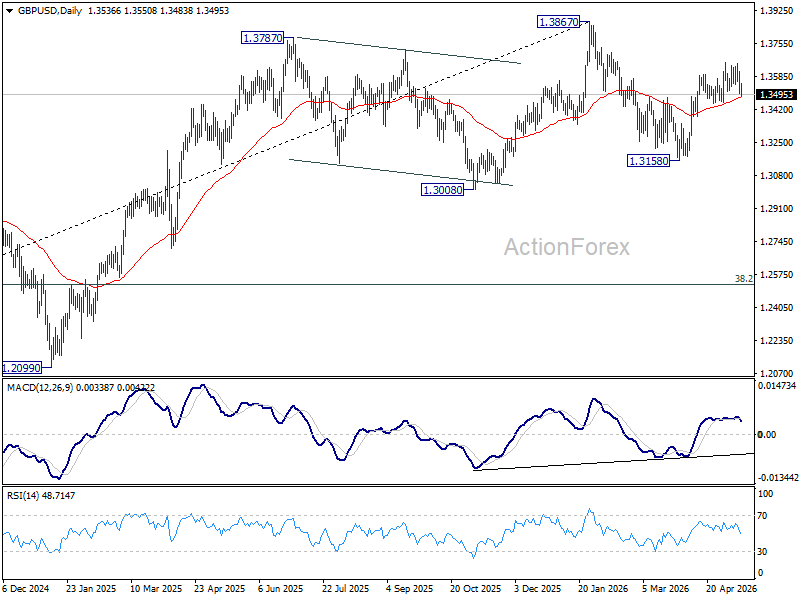
GBP/USD Mid-Day Outlook
Daily Pivots: (S1) 1.3488; (P) 1.3548; (R1) 1.3597; More...
GBP/USD weakens again today but stays above 1.3453 support. Intraday bias remains neutral and further rally is still mildly in favor. On the upside, firm break of 1.3657 will resume the rally from 1.3158 to retest 1.3867 high. However, decisive break of 1.3453 will argue that the rebound has already completed, and turn bias to the downside for retesting 1.3158 instead.
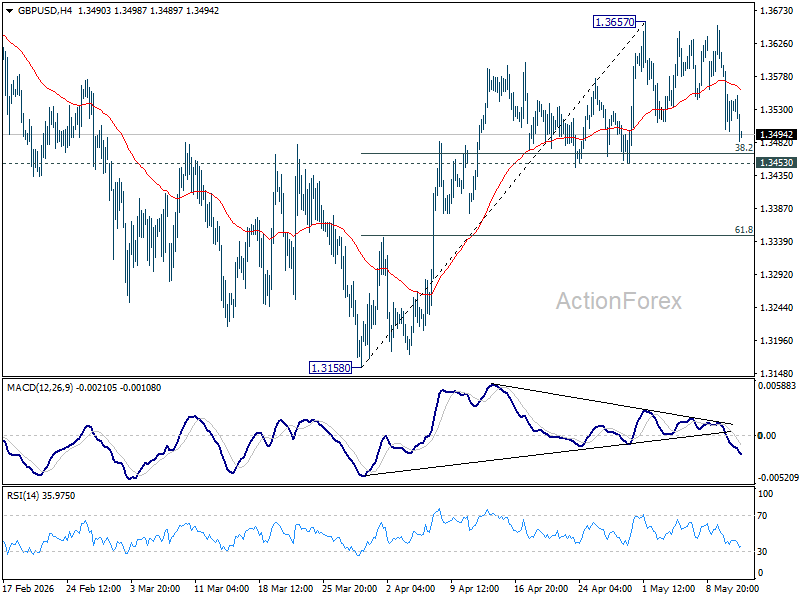
In the bigger picture, current development suggests that price actions from 1.3867 are merely a corrective pattern within the broader up trend from 1.0351 (2022 low). With 1.3008 support intact, medium term bullishness is maintained and break of 1.3867 is in favor for a later stage, towards 1.4248 key resistance (2021 high).
US PPI Surges to Highest Since 2022 as Upstream Inflation Pressures Intensify
US producer prices surged far more than expected in April, reinforcing concerns that inflation pressures are broadening across the economy and strengthening the case for the Federal Reserve to keep policy restrictive for longer. Headline PPI rose 1.4% mom, accelerating from 0.7% mom previously and well above expectations of 0.5% mom. The increase marked the largest monthly rise since March 2022.
The details of the report showed inflation pressures spreading across both services and goods categories. Nearly 60% of the monthly increase came from a 1.2% mom rise in final demand services prices, while final demand goods prices climbed 2.0% mom. Core producer prices excluding foods, energy, and trade services increased 0.6% mom, matching the strongest monthly gain since October 2025 and suggesting that underlying inflation momentum remains firm even beyond volatile commodity categories.
On an annual basis, headline PPI accelerated sharply from 4.3% yoy to 6.0% yoy, far exceeding expectations of 4.9% yoy and marking the strongest yearly increase since December 2022. Core PPI excluding foods, energy, and trade services rose 4.4% yoy, the highest since February 2023.
The report is likely to reinforce market expectations that the Fed will remain firmly on hold in the near term, while also increasing concern that rising energy prices linked to the Middle East conflict may now be feeding more persistently into broader inflation across the economy.
| Indicator | Previous | Latest |
|---|---|---|
| Headline PPI (MoM) | 0.7% | 1.4% |
| Headline PPI (YoY) | 4.3% | 6.0% |
| Ex Food, Energy & Trade (MoM) | 0.6% | |
| Ex Food, Energy & Trade (YoY) | 4.4% | |
| Final Demand Services | 1.2% | |
| Final Demand Goods | 2.0% |