
Sample Category Title
Weekly Focus – China Makes a Big Push to Turn the Economy
The big news this week was the barrage of new stimulus measures from China. At an economic briefing on Tuesday, People's Bank of China and financial regulators announced a wide range of measures to shore up the ailing economy: the policy rate was cut by 30bp, Reserve Requirement Ratios for banks were cut by 50bp, measures to increase buying in the stock market was launched and mortgage rates on existing loans will be cut by 50bp. On top of this reports suggested China's big banks will be recapitalized with 1 trillion CNY (142 billion USD). On Thursday, China top leaders dedicated their monthly meeting in the Politburo to the economy, which is not normally the case in September. They sent a clear signal that stimulus will be stepped up across the board and turning the economy has the number one priority now. It is the biggest round of stimulus since the current crisis started three years ago and could turn out to be China's 'whatever-it-takes' moment. We now see upside risk to our growth estimate of 4.8% this year and next.
The Chinese stock market rallied strongly all week and is up 15% from the start of the week (offshore stocks); albeit coming from very low levels. The CNY also strengthened significantly. It is probably not a coincidence the measures were launched a week before China goes into the one-week National Holiday starting on Tuesday as policy makers hope for the measures to lift confidence when millions of families get together across China.
It has also been an eventful week on the data front. Flash PMIs from the euro zone and US kicked off the week with disappointing readings. Euro manufacturing PMI slipped further to 44.8 from 45.8 signalling clear contraction and raising the chance that the ECB could cut rates again next month. Service PMI also dropped, although it was probably more related to the end of the Olympics. US manufacturing PMIs also disappointed but the service PMI stayed at robust levels alleviating recession fears. Focus is also still on US labour market data as they are key for Fed policy. This week provided a mixed bag with the 'jobs plentiful' index in the consumer confidence survey falling yet again signalling a further rise in unemployment. However, initial jobless claims was better than expected.
On the geopolitical front we saw escalation in the Middle East with extensive Israeli attacks in Lebanon (see Geopolitical Radar - Up the escalation ladder in the Middle East, 26 September). It is still not having much impact on markets, though, and oil prices actually dropped this week from USD75 per barrel to USD71.5 per barrel as Saudi Arabia plans to increase supply and a new agreement in Libya is also set to put more oil on the market.
Risk sentiment was generally improving this week with global stocks moving higher while bond yields and the USD moved broadly sideways. Metal prices saw a strong rally following the Chinese stimulus announcements.
Focus the coming week will be on the US labour market report where both payrolls and the unemployment rate will be key for guiding Fed policy. ISM for both manufacturing and services are also due. In the eurozone, the Flash CPI for September will be a key input going into the October meeting. We expect euro area HICP inflation to decline to 1.7% y/y (consensus 2.0% y/y) in September from 2.2% in August after lower-than-expected data this week from France and Spain.
US Dollar Index (DXY) Slides to Fresh Lows Post PCE Data
- US Dollar Index hits new yearly low after PCE inflation report came in softer than expected.
- PCE data shows personal income rose less than expected, PCE price index increased by 0.1% MoM, and core PCE increased by 0.1%, below expectations.
- DXY is on the edge of a cliff as rate cut bets and dovish Fed rhetoric weigh on the greenback.
The US Dollar Index (DXY) slid to a fresh yearly low in the aftermath of the US PCE inflation report. A softer than expected PCE print across the board ramped up bets for another 50 bps cut from the Fed in November.
The initial impact has seen the US Dollar lose ground to major counterparts and commodities like Gold and Silver tested recent highs. The DXY appears to be on the edge of a cliff as rate cut bets and dovish Fed rhetoric weigh on the greenback.
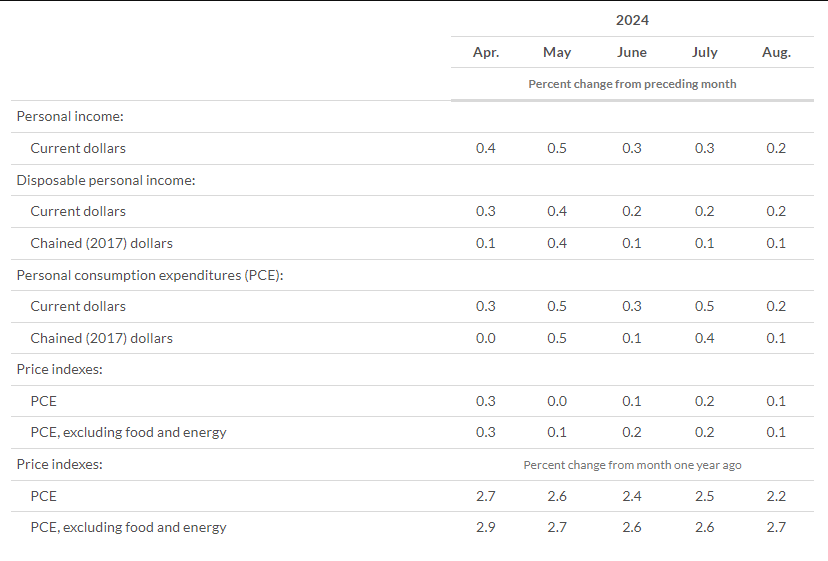
The PCE data showed that US personal income rose by less than expected. In August 2024, the US personal consumption expenditure (PCE) price index rose by 0.1% month-over-month, following a 0.2% increase in July, aligning with expectations. Service prices saw a 0.2% rise, while goods prices fell by 0.2%. The core PCE index, which excludes food and energy, also increased by 0.1%, down from 0.2% in July and below the anticipated 0.2%. Food prices went up by 0.1%, whereas energy prices dropped by 0.8%.
On an annual basis, the PCE inflation rate decreased to 2.2%, the lowest since February 2021, from 2.5% in July, and was below the expected 2.3%. The core rate slightly increased to 2.7% from 2.6%, meeting forecasts.
Source: Bureau of Economic Analysis
Markets will now keep an eye on the Michigan sentiment final numbers but barring any surprises this should not have much impact. Looking ahead, market attention will switch to US job numbers.
Traders are favoring a 50 bps cut in November but at this stage it is far from a certainty with Job numbers next week likely to play a major role.
Technical Analysis – US Dollar Index
The US dollar has been flirting with fresh lows since the Fed meeting on September 18. A brief push lower post the PCE release followed but the index has since bounced back to trade at 100.308 at the time of writing.
The 100.00 psychological level is growing ever more vulnerable especially with the jobs data lined up next week. I had actually hoped for a slight bounce from the index today and Monday potentially as we enter the last day of the week, month and quarter.
However, it would appear that for now the bearish pressure is to be maintained with a late bounce on Monday still a possibility ahead of the NFP report on Friday
US Dollar Index Chart, September 27, 2024
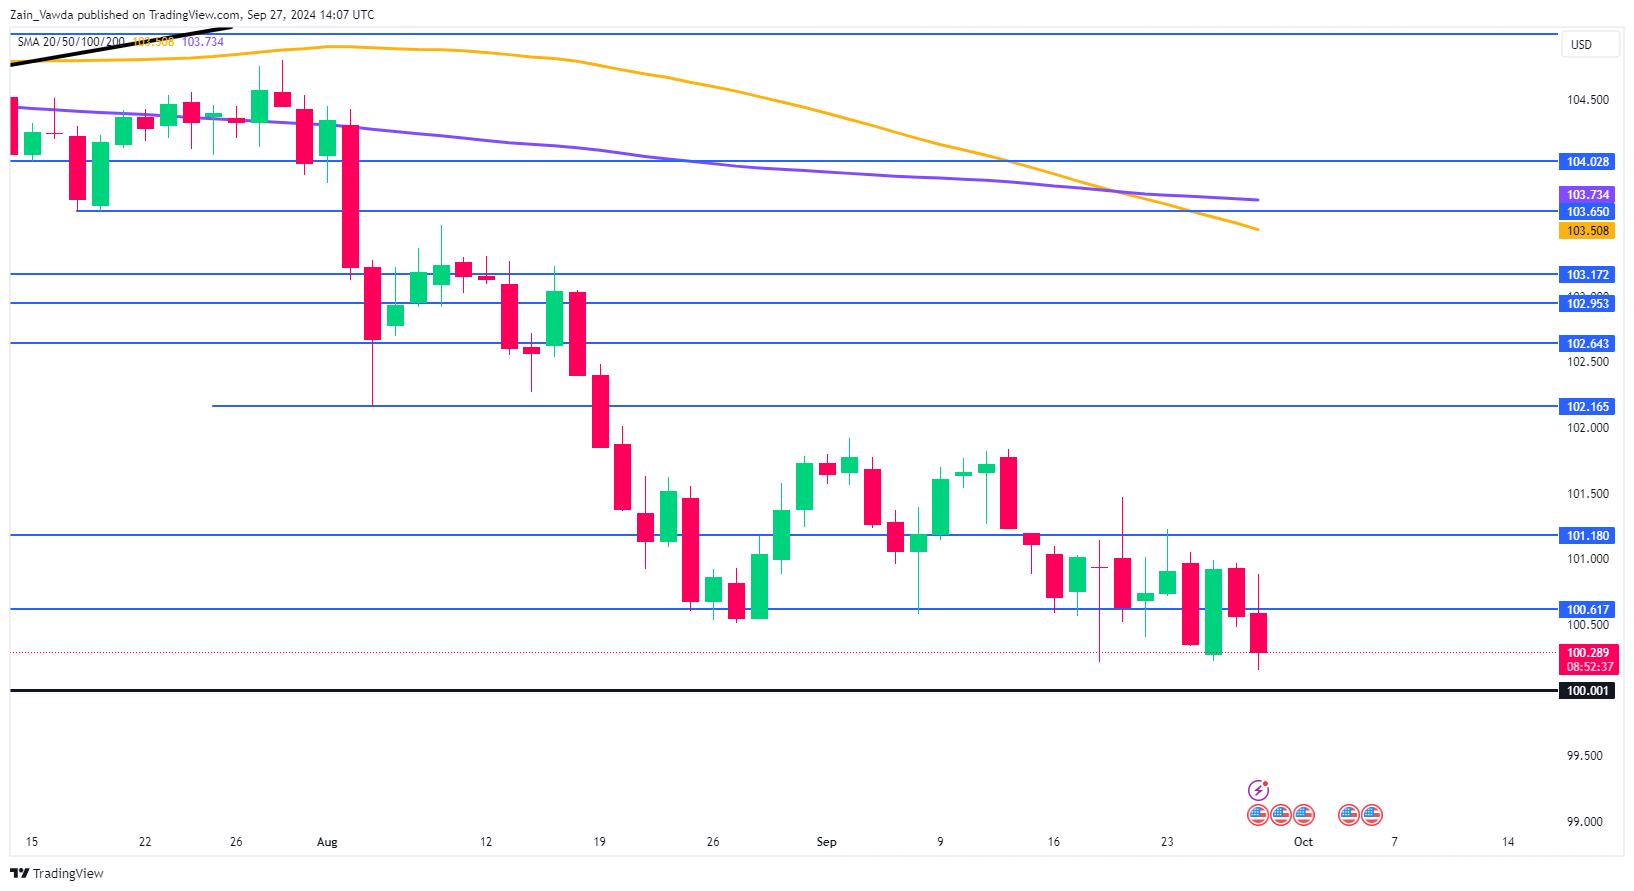
Source: TradingView (click to enlarge)
Support
- 100.00
- 99.500
- 99.000
Resistance
- 100.61
- 101.18
- 101.80
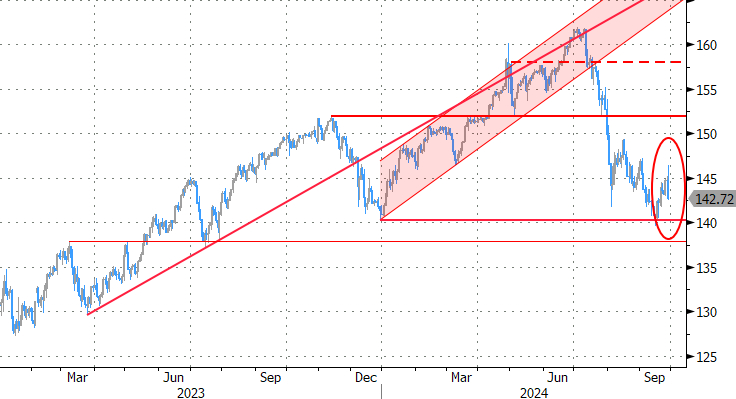
USDJPY Driven by Japanese Fundamentals with Target at 142.00
- Bullish Corrective Scenario: Buy positions above 143.50 with a take profit (TP) at 144.00 or an extended target at 145.00, from where selling opportunities may resume.
- Bearish Scenario: Sell positions below 142.89 with a TP at 142.00, 141.74, and an extended target at 141.00.
- Bearish Pullback Scenario: Sell positions below 144.00 or 145.00 (where a confirmed entry point occurs) with a TP at 143.00 and an extended target at 142.00 in the short term.
Fundamental Analysis
Key Insights:
- Shigeru Ishiba’s victory in the Japanese elections and signals from BoJ policy are impacting USDJPY.
- The yen strengthens due to speculation over potential adjustments in Japanese monetary policy.
- The Fed’s dovish rhetoric could continue weakening the USD.
The Japanese yen strengthened against the dollar after Shigeru Ishiba won the LDP leadership election to become Japan’s prime minister, raising expectations for more active economic policies. Additionally, Tokyo’s Consumer Price Index (CPI) showed a 2.0% year-over-year increase in September, down from 2.6% in August, which could influence future adjustments by the Bank of Japan (BoJ).
The BoJ minutes revealed debates among officials on the speed at which interest rates should rise, reflecting the growing concern about the timing of future monetary policy adjustments.
Meanwhile, the USD faced bearish pressure following dovish remarks from Federal Reserve members. Governor Lisa Cook highlighted the need to consider "downside risks" to employment, suggesting potential rate cuts.
Technical Analysis
USDJPY, H2
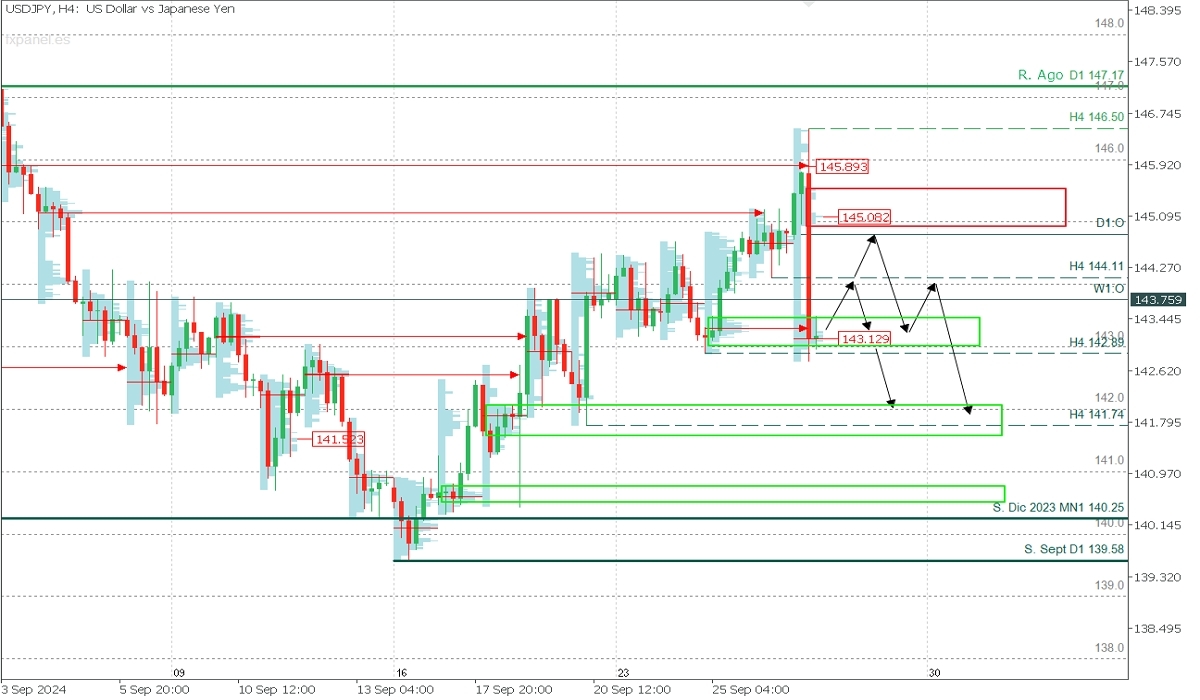
- Supply Zones (Selling): 145.08 and 145.89
- Demand Zones (Buying): 143.13, 142.00, and 140.60
The weekly bearish trend shows signs of continuation after the last two weeks’ corrective rally fell short of the August resistance, accelerating the decline after recent Japanese fundamentals.
The recent drop below the last validated support at 144.11 highlights yen recovery. After reaching the demand zone around 143.30, a pullback towards the broken support (now resistance) at 144.11 or a more extended supply zone around 145.00 is expected, from where selling can resume.
A bearish continuation and trend reversal will be confirmed if prices break below the demand zone around 143.30 and the support at 142.89, with a target in the coming days at the next demand zone around 142.00.
This bearish scenario will be invalidated if prices decisively break above the supply zone around 145.00, rising to challenge the resistance zone between 146.00 and 146.50, reversing the bearish momentum and preparing for a potential upward push toward the macro resistance at 147.17.
Japanese Yen Rises 1.3% vs Dollar on Political News/Economic Data
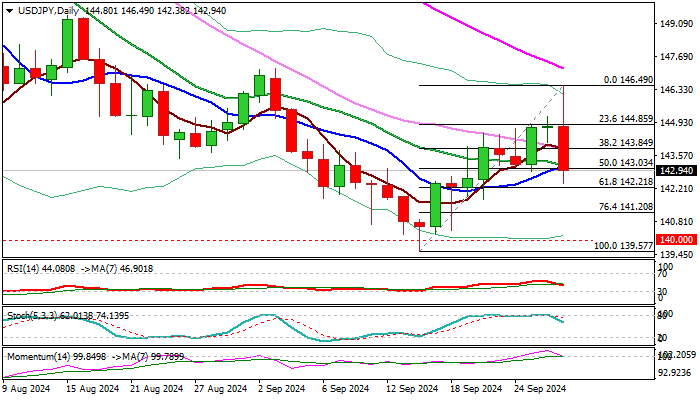
USDJPY rose to three-week high (146.49) and subsequently fell over three full figures on Friday, on speculations about new prime minister’s support to BOJ’s further policy tightening, which was seen as a violation of central bank’s independence, initially weakening yen and then sparking strong rally after news proved false.
Yen strengthened more after US data showed moderate increase in consumer spending in August, while inflation continued to slow, adding to expectations for another Fed outsized rate cut (bets are currently 50-50).
Technical structure is weakening on daily chart as falling 14-d momentum is cracking the centreline and about to break into negative territory, MA’s returned to full bearish setup, and a double bull-trap above 144.82 (Fibo 23.6% of 161.80/139.57).
Friday’s large bearish daily candle with long upper wick, to weigh on near-term action, along with falling and thickening daily cloud, which stays above the price.
Daily close below 143.00 zone (broken 50% of 139.57/146.49 /10DMA) to boost bearish signal and keep fresh bears firmly in play for extension through 142.21 (Fibo 61.8%) and 141.68 (Aug 5 spike low).
Res: 143.16; 143.84; 144.02; 144.85
Sup: 142.21; 142.00; 141.68; 141.20
Sunset Market Commentary
Markets
Today started somewhat as expected. French and Spanish September CPI data printed below consensus. French prices fell by 1.2% M/M to 1.5% Y/Y (from 2.2%), the first sub-2% reading since July 2021. Significantly lower fuel prices, but also lower services costs (turnaround after Olympics) drove the move. Spanish inflation was 0.1% M/M lower with only the second below 2% Y/Y-reading since March 2021 (1.7% from 2.4%). Core CPI slowed as well (2.4% from 2.7%) whereas markets expected a stabilization. Fuel prices were again the main culprit. EMU money markets nevertheless added to October ECB rate cut bets in the wake of the release. Their reasoning is simple: the only two key data points in the brief intermeeting period both surprised on the downside (PMI’s and now CPI’s). While markets currently attach an 80% probability to a follow-up rate cut, we still err on the side of the status quo. Recall ECB President Lagarde’s Q&A after the September meeting: “We are looking at a whole battery of indicators. And I’m saying that in particular because September will certainly deliver a low reading of inflation. Very likely. We expect, because of the base effect, particularly on energy, our inflation numbers to be up in the fourth quarter, so the last three months of 2024. But September is going to deliver a low reading.” In our interpretation, Lagarde basically hedged the September CPI figures with the central bank wanting more input on services and especially wages going into their final meeting this year. The ECB president can on Monday settle the debate when she appears in front of EU parliament. German yields lose 4 to 5 bps across the curve today. The euro initially dipped from levels near EUR/USD 1.1170 to 1.1130. The move was erased by the time of the release of US eco figures with bullish risk sentiment helping out. Key European stock markets add another 1% today. Disappointing US personal income/spending data (both +0.2% M/M in September) and a marginally lower core PCE deflator (0.1% M/M vs 0.2%) equally convinced (US) money markets to add to 50 bps Fed rate cut bets in November, our preferred scenario. Going into next week’s key eco data (ISM’s, payrolls) and Powell speech, the odds are perfectly in balance between 25 bps and 50 bps. US yields lose around 3 bps after the release, propelling EUR/USD back to first resistance at 1.1202/14. We stick to our sell USD on upticks approach. The trade-weighted dollar already set a minor new sell-off low at 100.16 with the 2023 low at 99.58 being the next target. USD/JPY’s drop from an intraday high of 146.20 to currently 142.70 helps explaining. JPY rebounded after results of the LDP leadership contest which was lost by a dovish BoJ advocate (Takaichi) in favour of Ishiba.
News & Views
Belgian inflation fell by 0.5% M/M in September to 3.06% Y/Y (from 0.0% M/M and 2.86% Y/Y) in August. Core inflation (ex-energy products and unprocessed food) was little changed at 2.80% from 2.78%. Energy inflation was an important factor at 6.72% Y/Y, compared to 6.96% last month and 14.01% in July. Electricity prices rose 14.8% Y/Y from 11.3%. For natural gas, it went from 103.0% last month to 138.1% this month. The increase is the result of the extinction of the impact of the basic package for electricity and natural gas. The disappearance of the package will have an increasing effect on inflation until February 2025. Services inflation is stable at 4.04%. Inflation for rents also remains stable at 4.74%. Inflation for food products (including alcoholic beverages) stands at 1.08% compared to 0.04% last month. Main monthly price increases concerned electricity (4.4%), natural gas (4.5%), travels abroad and city trips (2.6%), clothing (0.6%) and tobacco (3.9%. Plane tickets (-17.7%), motor fuels (-3.8%), hotel rooms (-10.0%), domestic heating oil (-2.9%), domestic trips (-9.9%), non-alcoholic beverages (-2.0%), alcoholic beverages (-1.8%), cleaning and maintenance products (-5.7%), confectionery (-2.0%) and meat (-0.8%) decreased. The estimate according to the European harmonised index (HICP flash estimate) amounts to 4.5% in September 2024.
The Brazilian unemployment rate unexpectedly declined from 6.8% to 6.6% in August. The consensus only expected a decline to 6.7%. The level is the lowest since current methodology which goes back to 2012. The strong labour market data come as Brazil’s central bank last week raised its policy rate by 25 bps to 10.75%, as its concerned about the inflationary impact of ongoing stronger than expected growth and a tight labour market. The BCB this week also already raised this year’s growth forecast (3.2% from 2.3%) and the inflation forecast over the period 2024-2026 to 4.3%-3.7%-3.3% from 4%-3.4%-3.2%. The real trades little changed near USD/BRL 5.44.
Graphs
USD/JPY: yen rebounds after outcome LDP leadership contest. Dovish BoJ advocate lost run-off.
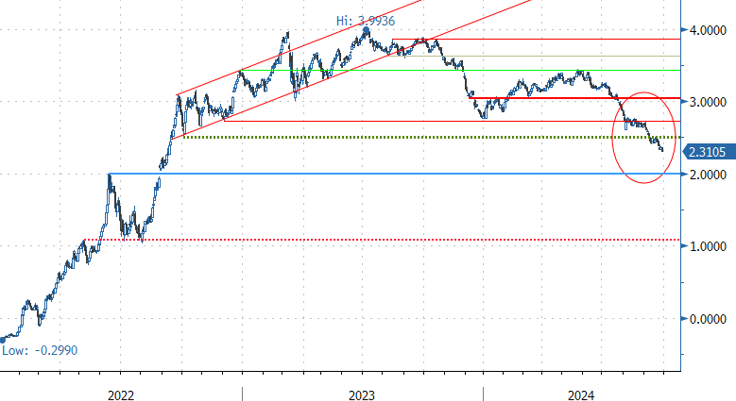
EU 2y swap rate: markets add to October ECB rate cut bets, pulling the front end of the curve to lowest levels since 2022
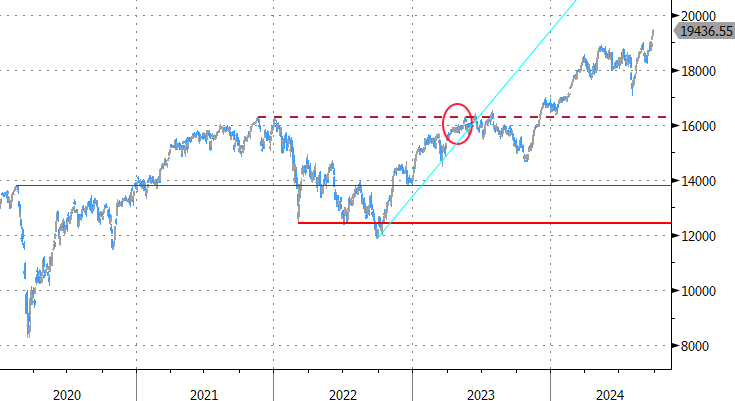
German Dax: German stocks are today’s outperforms as industrial stocks make comeback
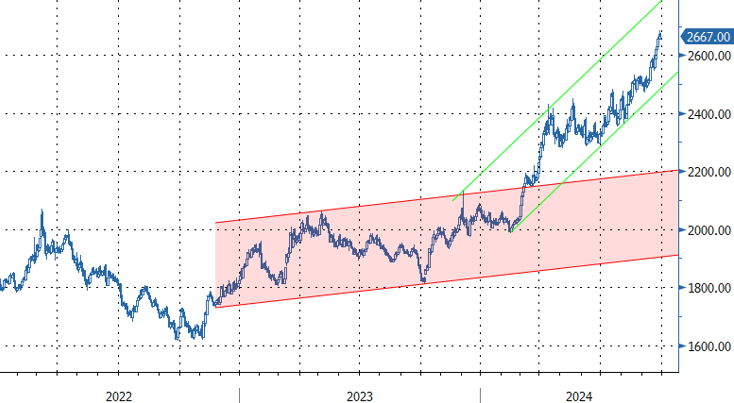
Gold extends rally as investors pile up on easing bets
U.S. Personal Income and Spending Grow Less Than Expected in August
Personal income grew 0.2% month-on-month (m/m) in August, down from July's 0.3% gain and below market expectations (0.4%).
Accounting for inflation and taxes, real personal disposable income grew a modest 0.1% for a third consecutive month.
Personal consumption expenditures grew 0.2% m/m in August. This was lower than the 0.5% recorded in July, and below market expectations (0.3%). Spending in real terms rose 0.1% m/m – much lower than the 0.4% gain recorded in July. Real spending was largely a result of increases in services outlays (0.2%), as goods spending was flat.
On inflation, the Fed's preferred inflation metric, the core PCE price deflator, rose 0.1% m/m, weaker than a 0.2% in the prior month. Thanks to base effects core PCE inflation rose from 2.6% to 2.7%. While the annual reading was in line with market expectations (2.7%), the monthly number came in marginally lower than expected (0.2%).
The personal savings rate declined to 4.8% in August from 4.9% in July (previously 2.9%).
Key Implications
Yesterday's release of the comprehensive annual GDP update revealed that the savings rate and income growth for the first half of the year were both stronger than previously reported. Thus it appears consumers had more gas in the tank to facilitate spending. Nonetheless, today's data suggests that they may be taking their foot off the pedal. Consumer spending is expected to remain subdued as the labor market continues to cool, though a greater savings buffer than previously thought could help to temper the slowdown.
On the inflation front, the Fed's preferred core measure continues to head in the right direction, even though base effects are boosting the yearly pace. Given that inflation continues to remain contained, the Fed will be paying even keener attention to labor market developments, with September payrolls data released next Friday as they calibrate further policy action.
EUR/USD Mid-Day Outlook
Daily Pivots: (S1) 1.1138; (P) 1.1164; (R1) 1.1201; More....
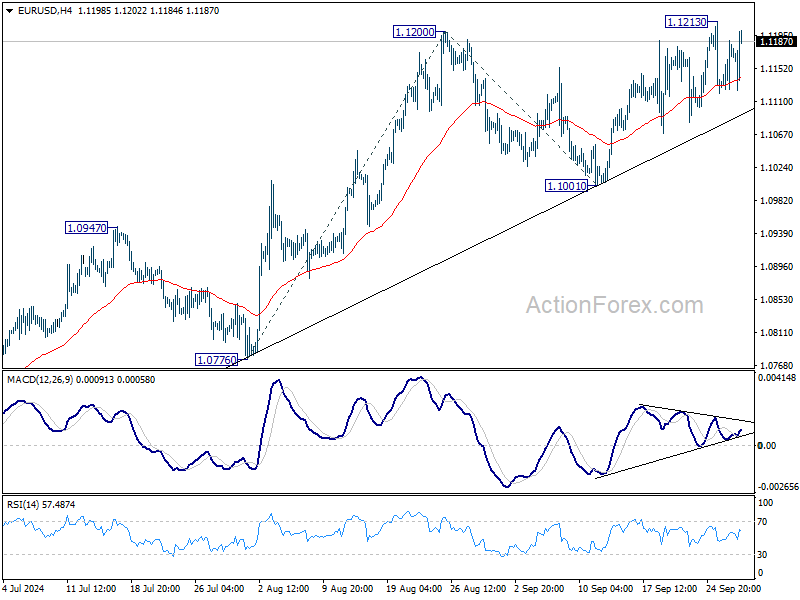
Intraday bias in EUR/USD remains neutral for the moment. Further rally is expected as long as 1.1001 support holds. Above 1.1213 will bring retest of 1.1274 high. Firm break there will resume larger up trend. Next near term target will be 100% projection of 1.0776 to 1.1200 from 1.1001 at 1.1425.
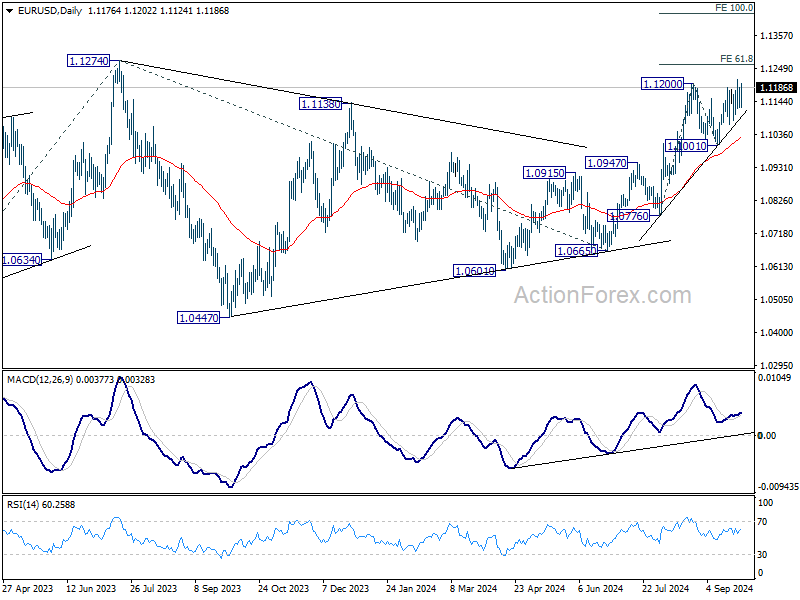
In the bigger picture, corrective pattern from 1.1274 should have completed at 1.0665 already. Decisive break of 1.1274 (2023 high) will confirm resumption of whole up trend from 0.9534 (2022 low). Next target will be 61.8% projection of 0.9534 to 1.1274 from 1.0665 at 1.1740. This will now be the favored case as long as 1.1001 support holds.
GBP/USD Mid-Day Outlook
Daily Pivots: (S1) 1.3335; (P) 1.3384; (R1) 1.3465; More...
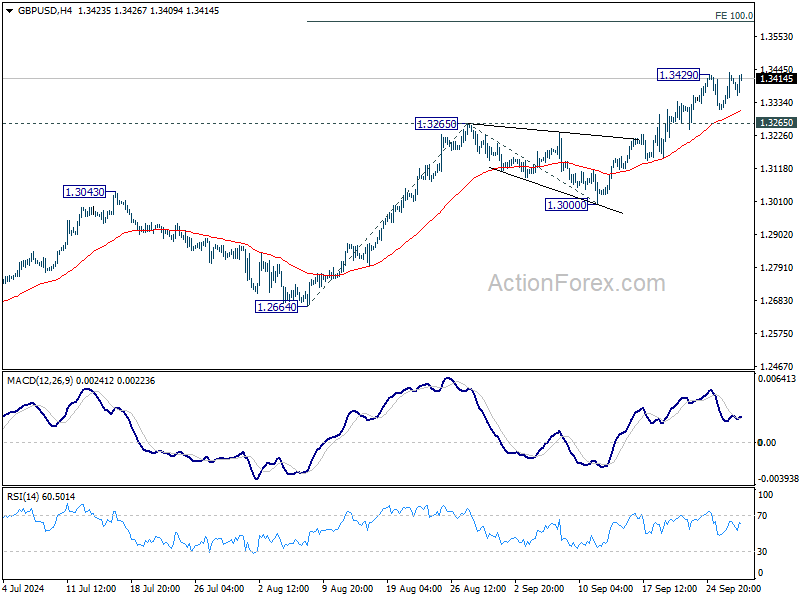
Intraday bias in GBP/USD remains neutral first, but further rally is expected as long as 1.3265 resistance turned support holds. Above 1.3429 will extend larger rally to 100% projection of 1.2664 to 1.3265 from 1.3000 at 1.3601 next. Nevertheless, break of 1.3265 will turn bias to the downside for deeper pullback.
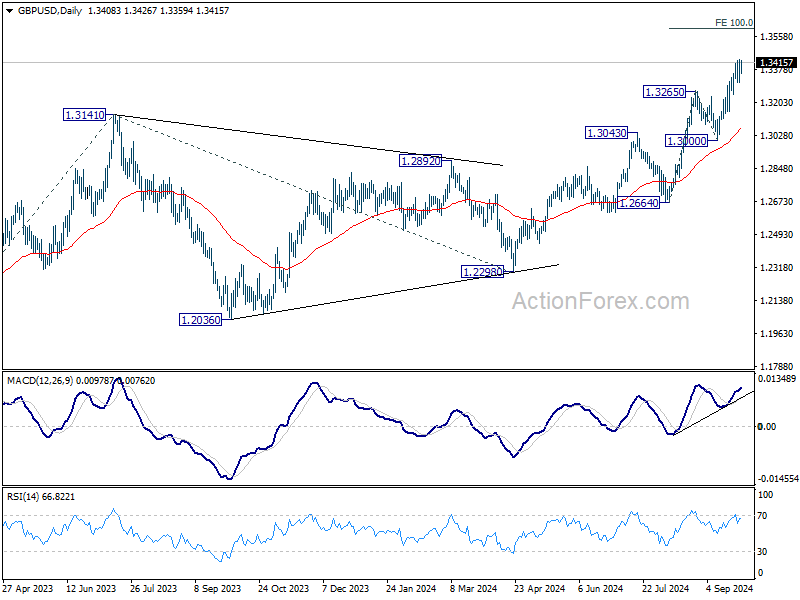
In the bigger picture, up trend from 1.0351 (2022 low) is in progress. Next target is 61.8% projection of 1.0351 to 1.3141 from 1.2298 at 1.4022. For now, outlook will stay bullish as long as 1.3000 support holds, even in case of deep pullback.
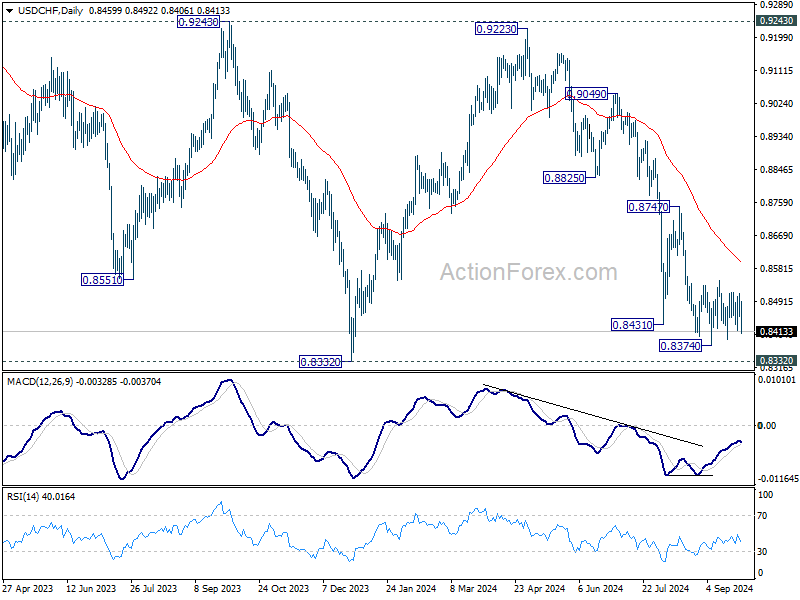
USD/CHF Mid-Day Outlook
Daily Pivots: (S1) 0.8438; (P) 0.8477; (R1) 0.8501; More…
No change in USD/CHF's outlook as range trading continues. On the downside, break of 0.8374 will resume the fall from 0.9223 to retest 0.8332 low. Decisive break there will indicate larger down trend resumption. However, break of 0.8548 resistance will turn bias back to the upside for 0.8747 resistance.
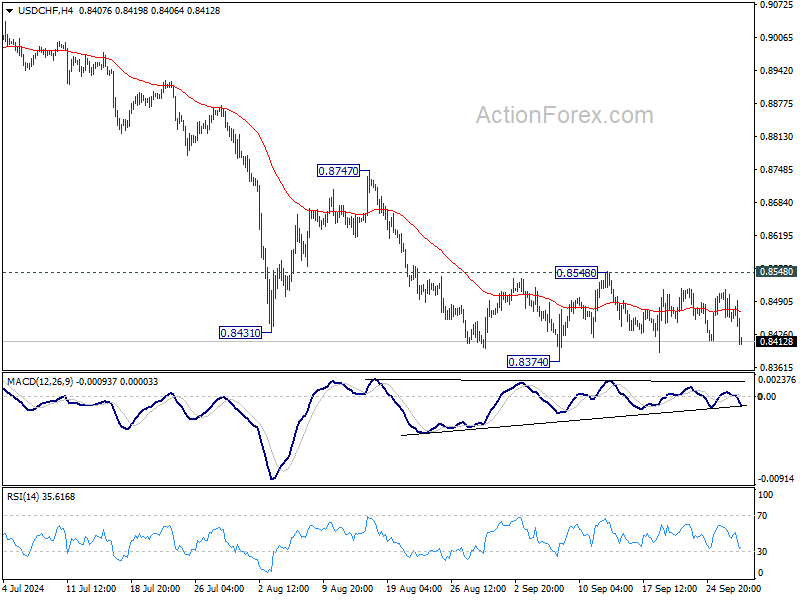
In the bigger picture, price actions from 0.8332 (2023 low) are currently seen as a medium term corrective pattern, with fall from 0.9223 as the second leg. Strong support could be seen from 0.8332 to bring rebound. Yet, overall outlook will continue to stay bearish as long as 0.9243 resistance holds. Firm break of 0.8332, however, will resume larger down trend from 1.0146 (2022 high).
Canada’s Economy Advanced in July, Growth Stalled in August
The Canadian economy grew by 0.2% month-on-month (m/m) in July after June's flat reading. This print landed ahead of Statistics Canada's advanced guidance and consensus expectations. Early guidance from Statistics Canada points to no growth in August.
May's reading was broad-based, with output expanding in 13 of 20 industries. Growth in services-producing industries (0.2% m/m) advanced at a slightly faster pace than in goods-producing industries (0.1% m/m).
On a weighted basis, the retail trade sector contributed most to the overall gain in July's GDP, and was up for a second consecutive month (+1.0% m/m). Elsewhere on the services side, gains in the finance and insurance industry (+0.5% m/m) and the public administration sector (+0.4% m/m) were offset partially by a drag in the transportation sector (-0.4% m/m) that were impacted by wildfires.
On the goods side, utilities (+1.3% m/m) did most of the heavy lifting on the back of increased demand for electricity. Meanwhile, the manufacturing sector reversed some of last month's slide and the construction sector slumped for a third straight month, down 0.4% m/m.
Behind the advanced reading of stalled growth in August is an increase in oil & gas and public sector activity offset by pullbacks in the manufacturing and transportation & warehousing sectors.
Key Implications
GDP data for July came in stronger than expectations, but the momentum should be short-lived. With the current guidance for flat industry-GDP growth next month, third quarter GDP is tracking just north of 1.0% quarter-on-quarter (q/q) annualized, significantly below the Bank of Canada's (BoC) 2.8% forecast, but broadly in line with our recent forecast update.
The BoC next rate decision is in late October and more cuts are certainly on the table. The BoC has shifted their tone as of late, putting more emphasis on their fears around a weakening economy. For what it's worth, we don't think today's data tips the scales any more-or-less in favour of a potential 50 basis point (bps) interest rate cut, which would follow the recent move from the Federal Reserve. Instead, more emphasis will be placed on upcoming labour market data as well as inflation data, where the Bank will be looking for signs that price growth can remain durably at 2%.