Sample Category Title
EUR/USD Momentum Builds: Can It Go Higher?
Key Highlights
- EUR/USD started a fresh increase above the 1.1120 resistance.
- It cleared a major bearish trend line with resistance at 1.1135 on the 4-hour chart.
- GBP/USD extended gains and traded above 1.3300.
- Bitcoin climbed higher above the $62,500 and $63,200 resistance levels.
EUR/USD Technical Analysis
The Euro remained supported above the 1.1065 level against the US Dollar. EUR/USD formed a base and started a fresh increase above 1.1100.
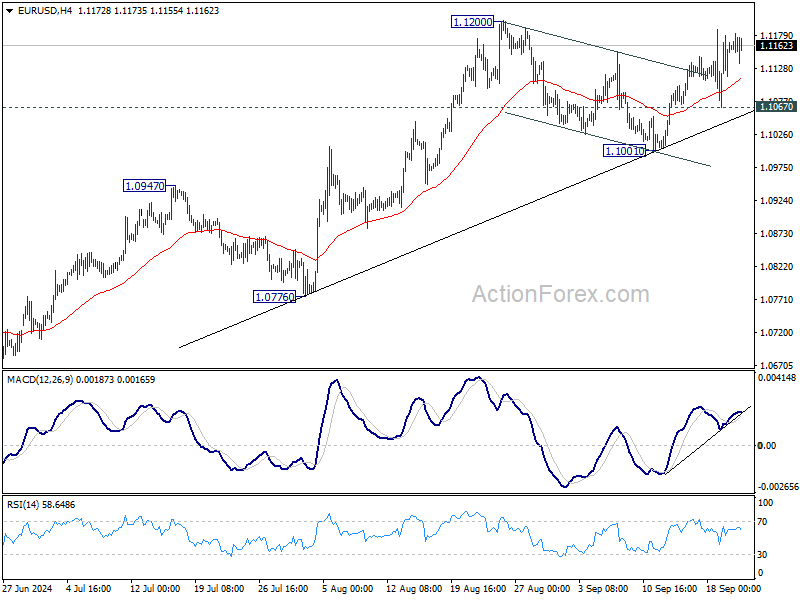
Looking at the 4-hour chart, the pair climbed the 1.1120 and 1.1135 resistance levels. It also cleared a major bearish trend line with resistance at 1.1135. However, the pair seems to be facing resistance near the 1.1180 level.
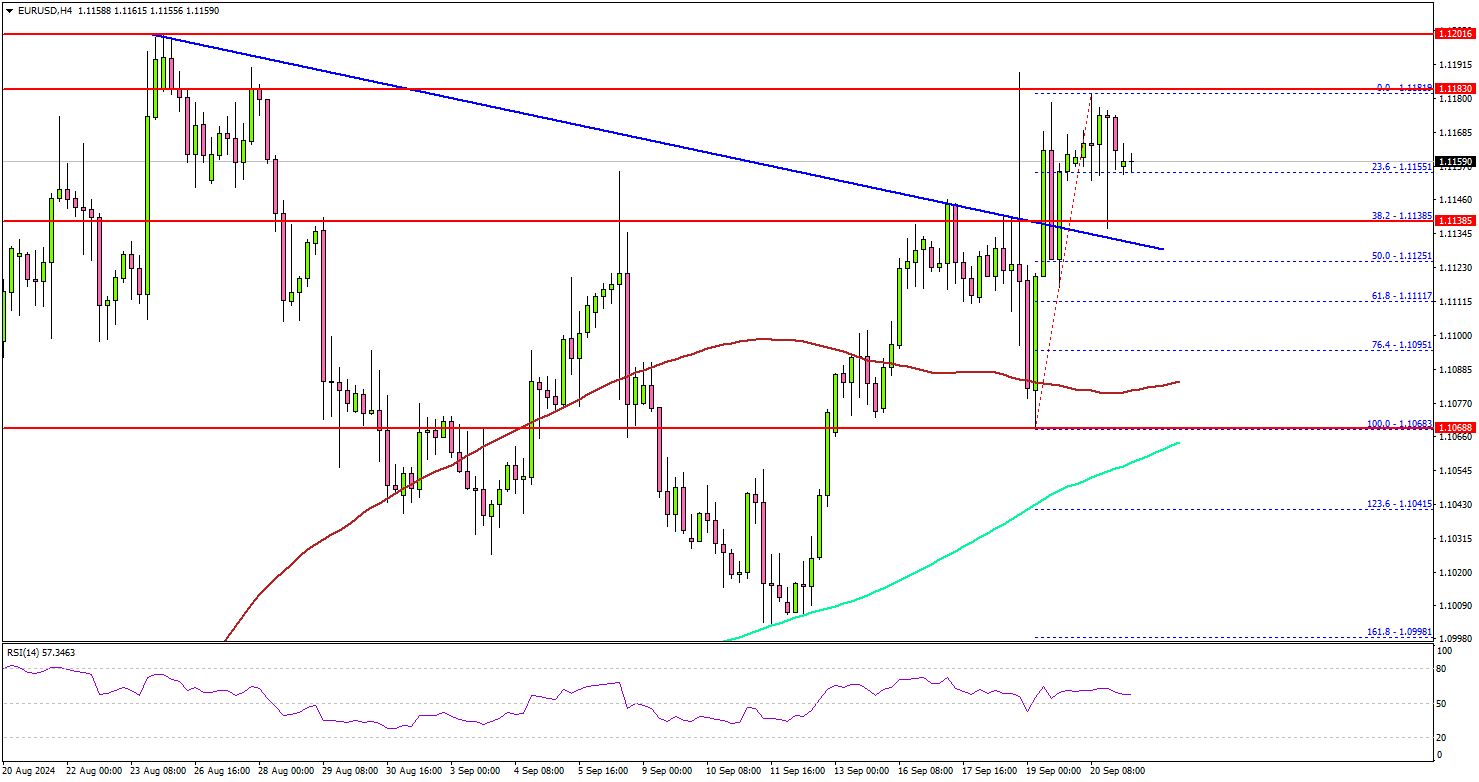
It is now consolidating near the 23.6% Fib retracement level of the upward move from the 1.1068 swing low to the 1.1181 high. The pair is also above the 100 simple moving average (red, 4-hour) and the 200 simple moving average (green, 4-hour).
On the upside, the pair could face hurdles near the 1.1180 zone. A clear move above the 1.1180 zone might set the pace for a move toward 1.1200. Any more gains might call for a test of the 1.1250 zone.
On the downside, immediate support sits near the 1.1140 level, below which the pair might test 1.1120. The next key support sits near the 1.1060 level. Any more losses could send the pair toward the 1.1020 support zone.
Looking at Bitcoin, the bulls remained in control, and they were able to push the price above the $63,200 resistance zone.
Upcoming Economic Events:
- Euro Zone Manufacturing PMI for Sep 2024 (Preliminary) – Forecast 45.8, versus 45.8 previous.
- Euro Zone Services PMI for Sep 2024 (Preliminary) – Forecast 52.8, versus 52.9 previous.
- US Manufacturing PMI for Sep 2024 (Preliminary) – Forecast 47.9, versus 48.5 previous.
- US Services PMI for Sep 2024 (Preliminary) – Forecast 55.5, versus 55.7 previous.
Australian PMI manufacturing hits 52-month low, composite in contraction
Australia's economic activity continued to slow in September, with the Judo Bank Manufacturing PMI dropping to 46.7, its lowest in 52 months, down from 48.5 in August. The Services PMI also declined, slipping to 50.6 from 52.5, while the Composite PMI fell back into contraction, down from 51.7 to 49.8, marking an 8-month low.
Matthew De Pasquale, Economist at Judo Bank, noted that the recent PMI weakness suggests households are saving more of the government stimulus than anticipated. He added that "the economy is gradually bringing supply and demand into balance," supporting the case for maintaining the current cash rate rather than hiking it later this year.
Employment growth also showed signs of slowing, with the employment index barely in expansion at 50.8. Additionally, output price index, which tracks businesses raising consumer prices, hit its lowest level since January 2021. Although input prices dropped, they remain above pre-pandemic averages, signaling lingering inflationary pressures.
New Zealand’s exports fell -0.1% yoy in Aug, imports down -1.0% yoy
New Zealand's goods trade balance posted deficit of NZD -2.2B, substantially larger than the expected deficit of NZD -155m. This widening gap is attributed to a slight decrease in both goods exports and imports. Goods exports fell by NZD -6.1m, or 0.1% yoy, to NZD 5.0B, while goods imports decreased by NZD -70m, or -1.0% yoy, to NZD 7.2B.
The decline in exports was primarily due to weaker trade with China, New Zealand’s largest trading partner. Exports to China fell by NZD -195m, or 16% yoy. In contrast, exports to other key markets saw gains. Shipments to Japan jumped by 39% yoy, while exports to the US and the EU rose by 3.1% yoy and 5.9% yoy, respectively.
On the import side, China, the EU, and Australia all saw notable declines in the value of goods imported by New Zealand, with China down -6.4% yoy, the EU down -8.2% yoy, and Australia down -12% yoy. However, imports from the US and South Korea surged. Goods from the US increased by NZD 154m (24% yoy), and imports from South Korea were up by a substantial NZD 185m (39% yoy).
Carry Trade to Give Way to Longer-Term Investment in Asian Growth
Attractive growth opportunities in Asia will support currencies and yields despite a narrowing rate differential with the FOMC.
With the US FOMC having started its rate easing cycle, central bankers across emerging markets (EMs) are also getting ready to adjust policy. At the end of this cycle, policy rates across the region are likely to be much closer to the fed funds rate than is typical through history. While partly a consequence of the higher starting point for the fed funds rate in this cycle, the smaller spreads also reflect fewer capacity constraints given the efficiency and connectivity of Asia and consequently less inflation pressure. This will have implications for growth and economic development, and could see currencies sustainably appreciate against the US dollar.
Since the beginning of the pandemic, monetary policy has been comparatively looser in Asia than in the US. Initially, central banks in India, the Philippines and Indonesia all cut rates by more than the US FOMC. These central banks, as well as the Bank of Thailand then raised rates by far less during the post-pandemic tightening: the FOMC’s 525bps of rate rises compares to the Philippine Bangko ng Pilipinas’ 450bps, the Bank Indonesia’s 275bps, the Reserve Bank of India’s 250bps and the Bank of Thailand’s 200bps. This has left spreads to the federal funds rate at their lowest levels since before the 2008-09 Global Financial Crisis.
Moreover, current policy rates are arguably too high for current domestic conditions. While growth is strong in aggregate, domestic consumption growth is tracking below the trend pace over the 10 years prior to COVID in all of these economies except India. Consumption in Indonesia is 4ppts below where this trend would have led to had COVID not occurred, Thailand around 5ppts below and the Philippines circa 6ppts lower. Investment is also weak in all of these countries except for India. This enduring underperformance has limited the pass through of global price pressures and led to the build up of a degree of slack amongst households and related businesses, with aggregate growth instead being held up by government expenditure and export growth.
Given this slack and the fed funds rate’s higher starting point, we expect EM Asia’s central banks to follow the US FOMC lower through the coming easing cycle, keeping spreads between EM policy rates and the FOMC comparatively low versus history. This means capital flows into these economies will need to be driven by growth prospects not yield differentials. These opportunities are found in both the region’s domestic markets and its export sectors.
Growth in EM Asia can be catalysed by public expenditure. Governments have ample fiscal space thanks to manageable debt liabilities and the potential to expand the tax base as the economy grows. There is justification for EM Asia’s nations to embark on strong investment agendas given young and growing populations as well as their increasing importance in global production chains. Households should also benefit from this strength in government expenditure and exports, fuelling consumption. Consumption below pre-COVID trends implies there is already some pent-up demand still to flow through.
Importantly, real effective exchange rates – the value of a currency against the weighted average of currencies of major trade partners adjusted for inflation – have held steady through the pandemic and recovery. This has provided some certainty for inflation and trade despite some weakening in US dollar bilaterals more recently. This is likely to remain the case going forward, albeit with some variation. That should allow the region to focus more on the development of comparative advantages, efficiency and diversifying export markets instead of simply being a mass-volume, low-cost exporter to the US.
That said, the region’s currencies remain sub-par against the US dollar and other developed-world currencies, providing an opportunity arguably to grow share in these markets as well. Note that this is not only applicable to manufacturing and mining but to tourism as well, broadening the benefits from trade to a wider population. Further foreign investment will also be incentivised by this trend and the deeper cross-border relationships it fosters.
The lasting uncertainty created by the pandemic and its inflationary consequences may therefore, in time, create structural strength in Asia’s developing economies. This should in turn incentivise long-term investment in the region over short-term carry trades built on risk premia.
The building out of industry and greater two-way trade also stands to reduce concern over cyclical volatility and the immaturity of regional capital markets. While the uptrend in the region’s currencies against the US dollar is likely to prove shallow, recurring improvement in capacity and productivity should stand the region in good stead and drive a longer term uptrend – a shift that will mitigate tradeable inflation risks and reflect slowly improving global purchasing power and financial stability across these countries. The outlook for Asia’s economies and currencies is therefore bright.
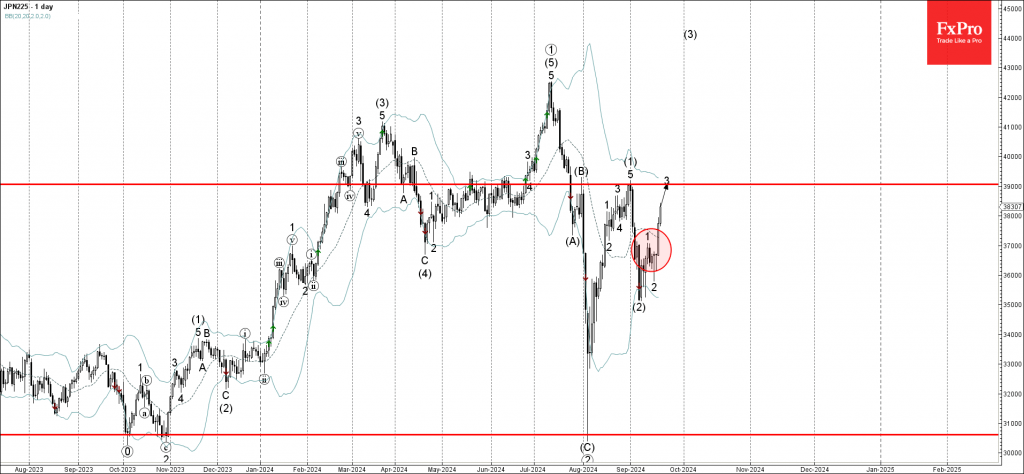
Nikkei 225 index Wave Analysis
- Nikkei 225 index rising inside minor impulse waves 3
- Likely to reach resistance level 39000.00
Nikkei 225 index continues to rise inside the minor impulse waves 3, which belong to the intermediate impulse wave (3) from the start of September.
The impulse wave (3) belongs to the primary upward impulse sequence 3 from the start of August.
Given the clear daily uptrend, Nikkei 225 index currency pair can be expected to rise further to the next resistance level 39000.00 – which is the target price for the completion of the active impulse wave 3.
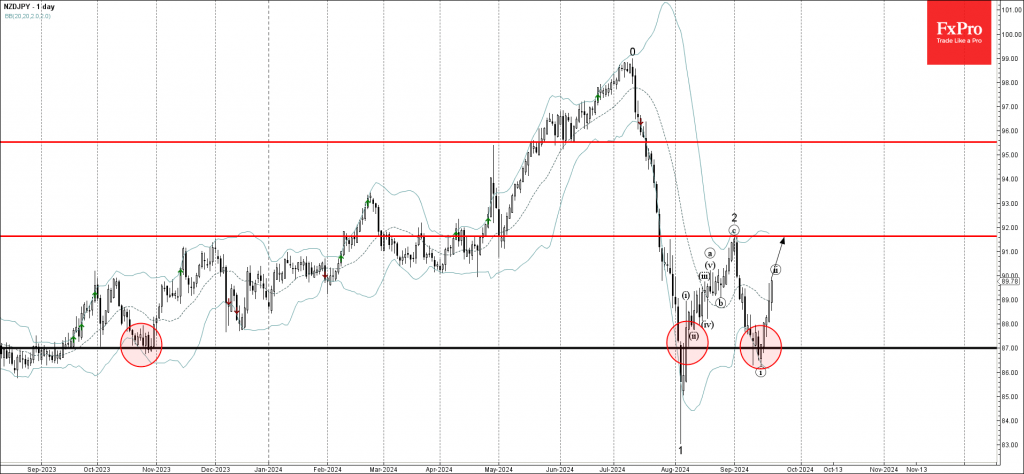
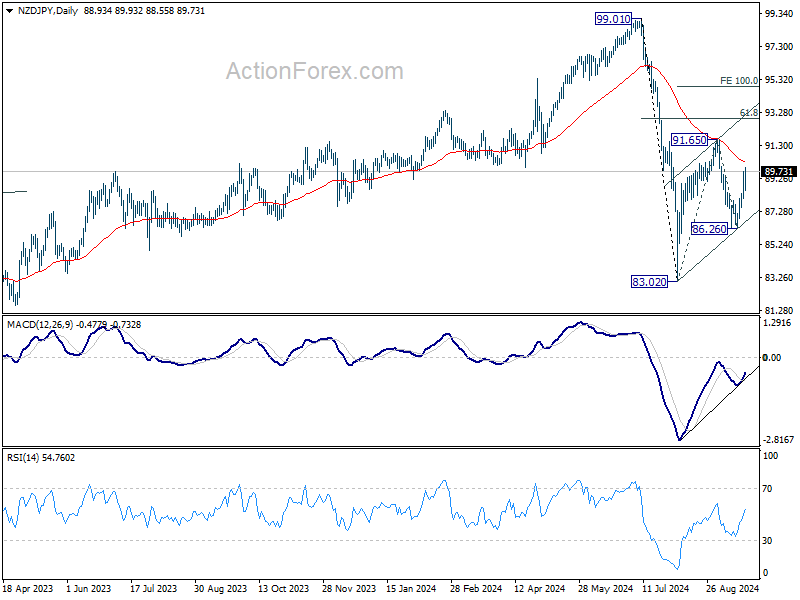
NZDJPY Wave Analysis
- NZDJPY rising inside corrective wave ii
- Likely to rise to resistance level 91.65
NZDJPY currency pair continues to rise inside the minor corrective waves ii, which started earlier from the powerful support level 87.00, which has been reversing the price from the end of October.
The active wave ii belongs to the downward impulse sequence 3 from the end of August.
Given the strongly bearish yen sentiment that can be seen across the FX markets lately, NZDJPY currency pair can be expected to rise further to the next resistance level 91.65 (top of the previous minor correction 2).
Dollar With Limited Losses After Fed; Yen Slumps; Sterling Soars
Dollar finished last week on the back foot, reacting to Fed's decision to cut rates by 50 bps. While the greenback lost ground to most major rivals, its decline was relatively modest. Notably, Dollar managed to close higher against both Japanese Yen and Swiss Franc, and it continued to hold above key near term support level versus Euro. US stock market's rally to fresh record highs lacked its usual exuberance, with market sentiment appearing somewhat half-hearted. This tempered risk-on mood, coupled with rebound in US treasury yields, helped mitigate more substantial selling pressure on Dollar.
Weakness in Japanese Yen was much more pronounced, primarily due to the cautious tone struck by BoJ, which signaled that it's not in a rush to raise interest rates again in the near term. This stance weighed heavily on Yen, which had already been under pressure from surging bond yields in the US and Europe. Technically, Yen's short-term rebound seems to have well concluded, and the currency is now embarking on a fresh decline.
Sterling, on the other hand, stood out as one of the top performers, supported by a combination of strong UK economic data and more hawkish-than-expected outcome from BoE. The Pound broke key resistance levels against both Euro and Swiss Franc, solidifying its position as one of the top gainers, with more upside potential ahead.
For the week overall, Yen was the clear laggard, followed by Swiss Franc and Dollar. On the flip side, Australian Dollar emerged as the best performer, while Sterling was a close second. New Zealand Dollar also performed well, rounding out the top three. The Euro and Canadian Dollar ended the week more neutrally, positioning themselves in the middle of the pack.
DOW and S&P 500 Break Records after Fed, Yet Market Rally Lacks Usual Excitement
Following Fed's 50bps rate cut last week, US markets responded with measured gains as DOW and S&P 500 climbed to fresh record highs. However, the rally lacked the exuberance typically seen in the wake of major policy shifts. This tempered reaction can be attributed to the fact that much of the cut had already been priced in the prior week, fueled by growing speculation. Additionally attention has already shifted back to the uncertainty surrounding Fed's next move.
The updated dot plot revealed a nearly even split within the FOMC. Ten of the 19 Fed members have signaled the possibility of an additional 50bps cut by the end of the year, while nine are leaning towards a more cautious 25bps cut. Meanwhile, the futures market reflects a different sentiment, pricing in 51.4% probability of a 50bps cut in November and 74.2% likelihood of a total 75bps reduction by year's end. This divergence highlights the uncertainty in the market, making it difficult to predict how aggressive Fed will be in its upcoming meetings.

The path forward for Fed will surely depend on upcoming economic data, but how? While inflation has been moderating, the question remains whether this disinflationary trend will be enough to warrant another bold move. In all likelihood, only a significant drop in inflation or a marked deterioration in labor market conditions could prompt a more aggressive cut. However, a weakening job market could reignite fears of an economic slowdown, raising recession concerns, which would likely be viewed unfavorably by investors.
Complicating the outlook further is the looming US presidential election in November. With political uncertainty hanging over the markets, many investors may choose to hold off on making significant moves until there is more clarity regarding the election outcome. This added layer of uncertainty will likely keep markets cautious in the months ahead.
Technically, for DOW, 61.8% projection of 32327.20 to 39889.05 from 38000.96. at 42674.18 could present signficant resistance, at least for the first attempt. But in any case, outlook will stay bullish as long as 55 D EMA (now at 40554.65) holds. Decisive break of 42674.18 would pave the way to 100% projection at 45562.81.
For the bullish scenario to fully materialize, several factors must align. The markets would need to see meaningful improvements in inflation data, continued strength in the labor market, and a favorable outcome from the US election, or at least one that is perceived as market-friendly. Without these supportive conditions, the market's rally could stall, and the outlook could become increasingly fragile.
US 10-Year Yield Stabilizes into Range Trading, Dollar Index Lacks Strong Downward Momentum
US 10-year yield's rebound last week brought D MACD back above signal line. Considering bullish convergence condition too, a short term bottom might be in place at 3.603 already. While there is prospect of stronge recovery, upside will likely be limited by 3.923 resistance to set the range for sideway trading.
On the downside, in case of another fall through 3.603, strong support is now expected from 100% projection of 4.997 to 3.785 from 4.737 at 3.253 to bring rebound. For 10-year yield to break through 3.253, a significant policy shift by Fed towards continously aggressive rate cuts would likely be necessary.
While Dollar Index breached 100.51 to resume the fall from 106.13, there is a lack of clear downside momentum. EUR/USD's struggle to breakout from near term range is a major factor flooring Dollar Index's fall. At the same time, the rebound from USD/JPY is another support.
Still, near term outlook in Dollar Index will stay bearish as long as 101.91 resistance holds, for 99.57 (2023 low). But the speed of the decline would depends on overall development in risk sentiment as well as treasury yields.
BoJ's Cautious Tone Drags Yen Lower, Lifts Nikkei
The Japanese Yen ended last week as the weakest currency, partly driven by surging bond yields in the US and Europe, and coupled with a more cautious tone from BoJ. Although the decision to keep interest rates unchanged was anticipated, BoJ Governor Kazuo Ueda's remarks during the post-meeting press conference left markets somewhat disappointed, with some even interpreting his remarks as slightly dovish. This development not only weighed on the yen but also spurred a strong rebound in Japan's Nikkei index.
Governor Ueda reaffirmed that rate hikes are on the card if economic conditions and inflation align with BoJ's projections. However, he was quick to highlight the uncertainties in the global economy, especially regarding the US. Additionally, Ueda pointed out that inflationary pressures resulting from Yen's weakness were fading, giving the BoJ some leeway to mull over its next move. Overall, the messages suggested that BoJ isn't in any rush to raise interest rates again this year.
Nikkei's strong rally last week and the break of 55 D EMA suggests that pullback from 39080.64 has already completed at 35253.43. Rise from 31156.11, as the second leg of the corrective pattern from 42426.77 high, should still be in progress, and could extend to 61.8% projection of 31156.11 to 39080.64 from 35253.43 at 40150.78.
Nikkei's anticipated break of 39080.64 resistance, if realized, should be accompanied by break of corresponding resistance in Yen crosses.
In similar developments, NZD/JPY's strong rebound from 86.26 argues that pull back from 91.65 has already completed. On the upside, sustained break of 55 D EMA (now at 90.30) will solidify the case that rise from 83.02, as the second leg of the corrective pattern from 99.01 high), is ready to resume through 91.65. NZD/JPY would then target 61.8% retracement of 99.01 to 83.02 at 92.90, or even further to 100% projection of 83.02 to 91.65 from 86.26 at 94.89.
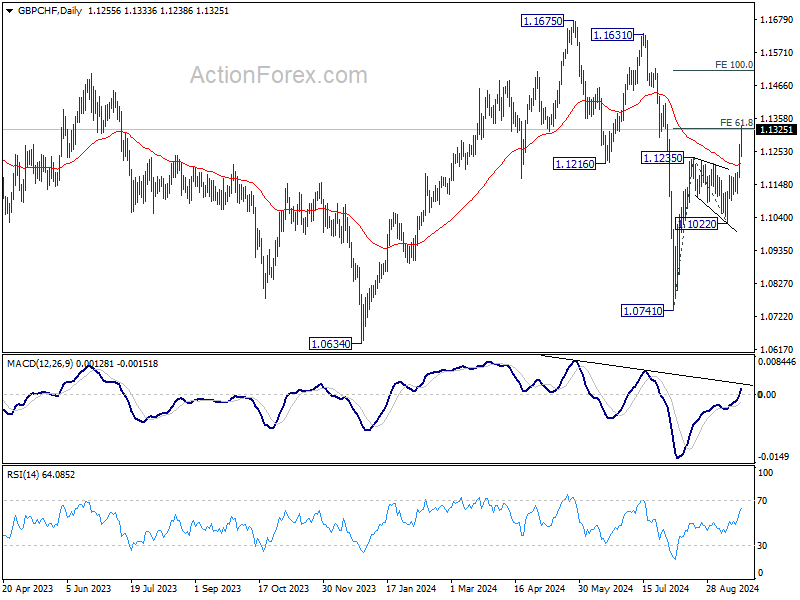
GBP Breaks Key Levels on Strong UK Data and Hawkish BoE
Sterling finished last week as one of the top performers, breaking through key resistance levels against both Euro and Swiss Franc. The Pound's momentum was largely driven by a combination of strong UK economic data and a more hawkish-than-anticipated outcome from BoE's meeting.
While the decision to hold rates at 5.00% was widely expected, the surprise came with an 8-1 vote, as Deputy Governor Dave Ramsden unexpectedly sided with the majority in holding rates. BoE's statement underlined that a "gradual approach" to easing would be taken, as services inflation remains "elevated." The market consensus still leans toward a rate cut in November, but after this week's developments, it's no longer a certainty.
Meanwhile, UK inflation data pointed to persistent price pressures. CPI remained steady at 2.2% in August, but core CPI rose more than expected to 3.6%. Services inflation also climbed from 5.2% to 5.6%. Another surprise came in retail sales, which jumped 1% in August, with annual growth reaching 2.5%, the highest since February 2022. These figures suggest that despite high interest rates, demand remains robust, keeping inflation risks elevated.
GBP/CHF's strong break of 1.1235 resistance confirmed resumption of whole rebound from 1.0741. Outlook will stay bullish as long as 55 D EMA (now at 1.1214) holds. Sustained trading above 61.8% projection of 1.0741 to 1.1235 from 1.1022 will pave the way to 161.8% projection at 1.1516.
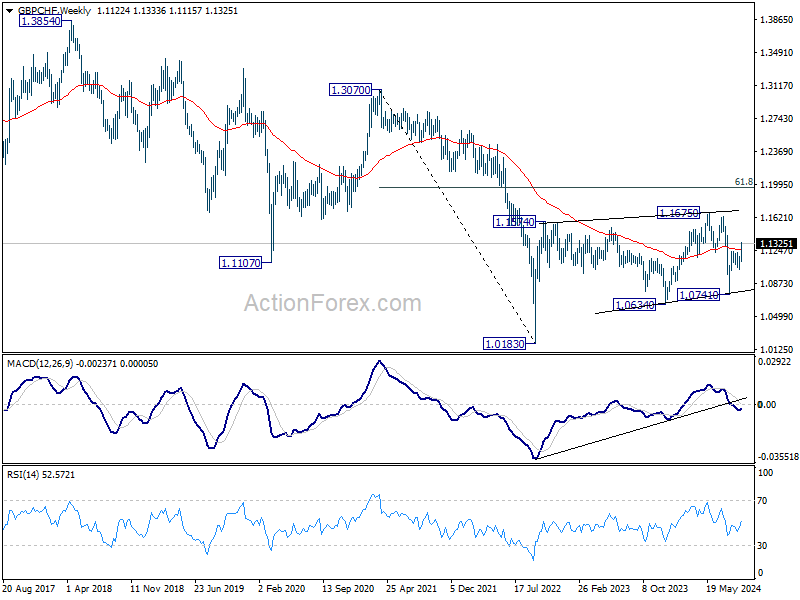
From a medium-term perspective, the break of 55 W EMA is also a bullish sign, and there is prospect of resuming whole rebound from 1.1083 (2022 low). Even as a corrective move, GBP/CHF could target 61.8% retracement of 1.3070 to 1.0183 at 1.1967 in the medium term.
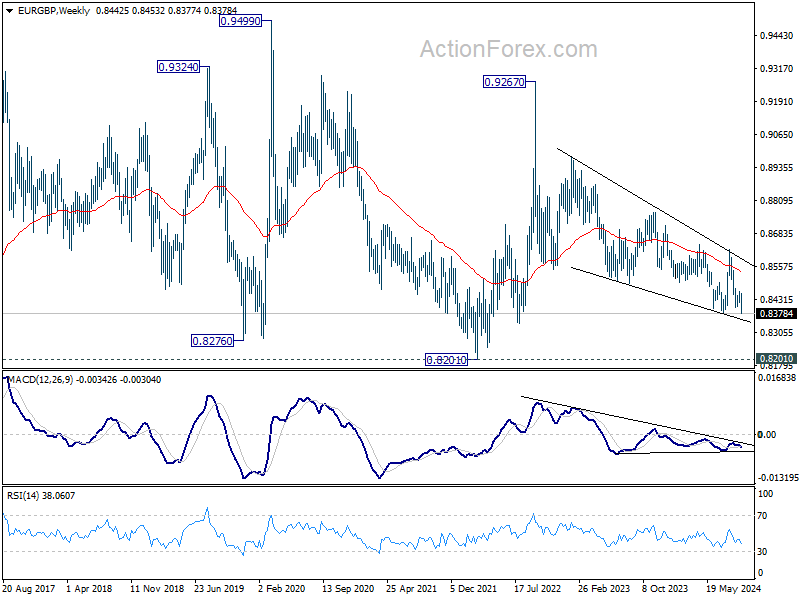
EUR/GBP's close below 0.8382 support indicates that down trend from 0.9267 (2022 high) is resuming. For the near term, next target will be 61.8% projection of 0.8624 to 0.8399 from 0.8463 at 0.8324.
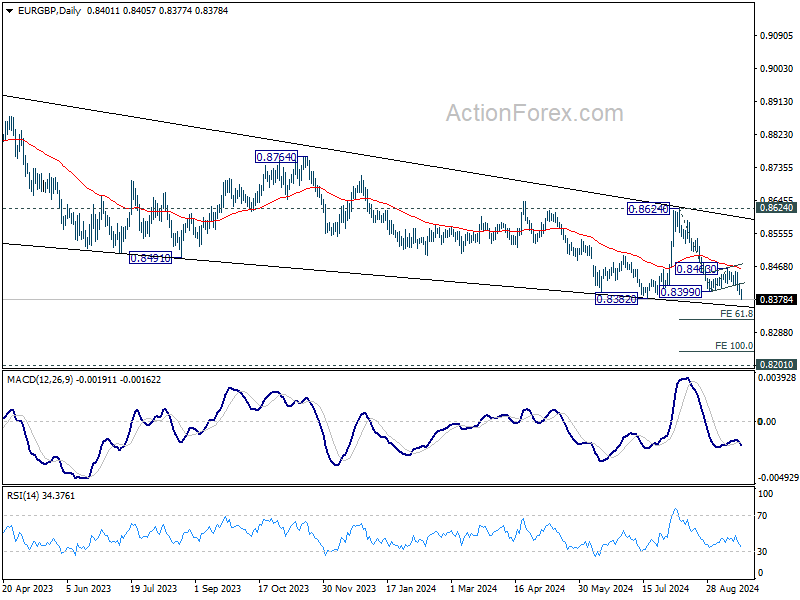
The medium-term outlook remains bearish with recovery attempts capped by falling 55 W EMA. The key question now is whether EUR/GBP could break through lower trend line support (now at around 0.8345) decisively. That could prompt downside acceleration towards 0.8201 key support (2022 low).
AUD/USD Weekly Report
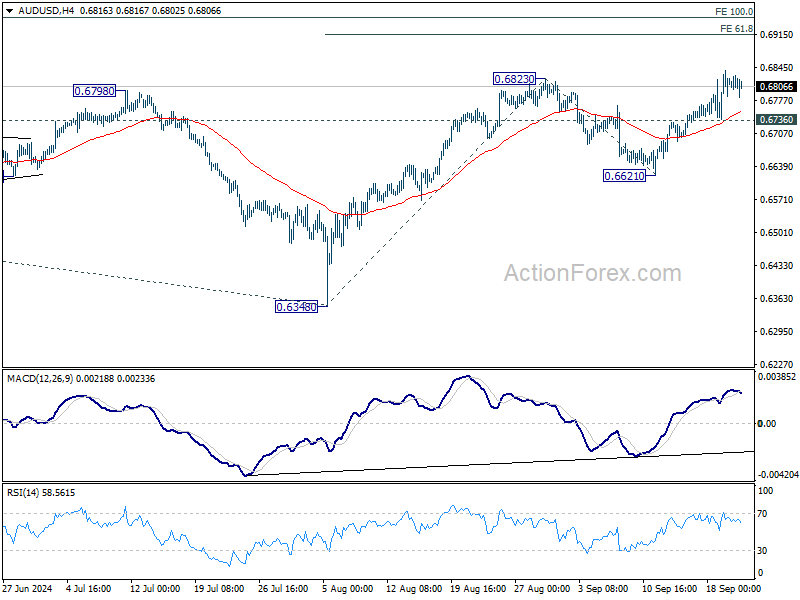
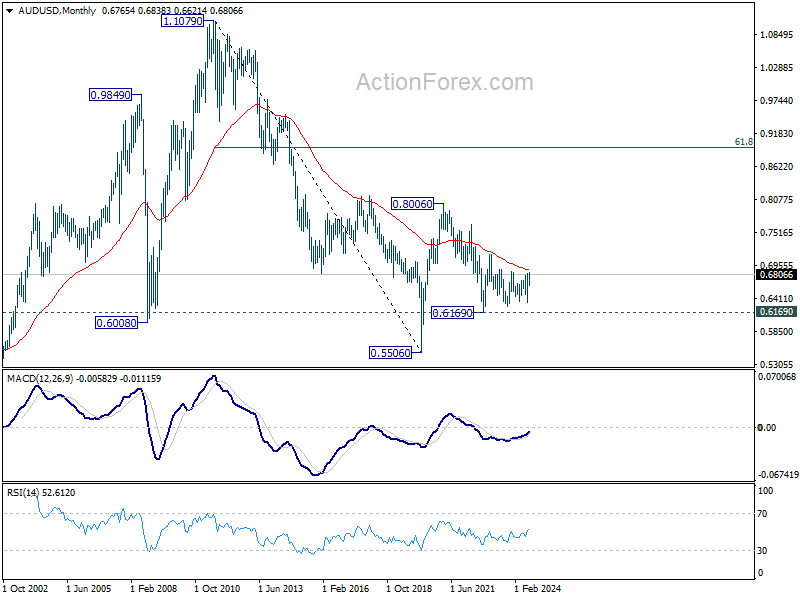
AUD/USD's rally from 0.6348 resumed by breaking through 0.6823 last week. Initial bias stays on the upside this week for 61.8% projection of 0.6348 to 0.6823 from 0.6621 at 0.6915 next. On the downside, below 0.6736 minor support will turn intraday bias neutral first. But outlook will remain cautiously bullish as long as 0.6621 support holds, in case of retreat.
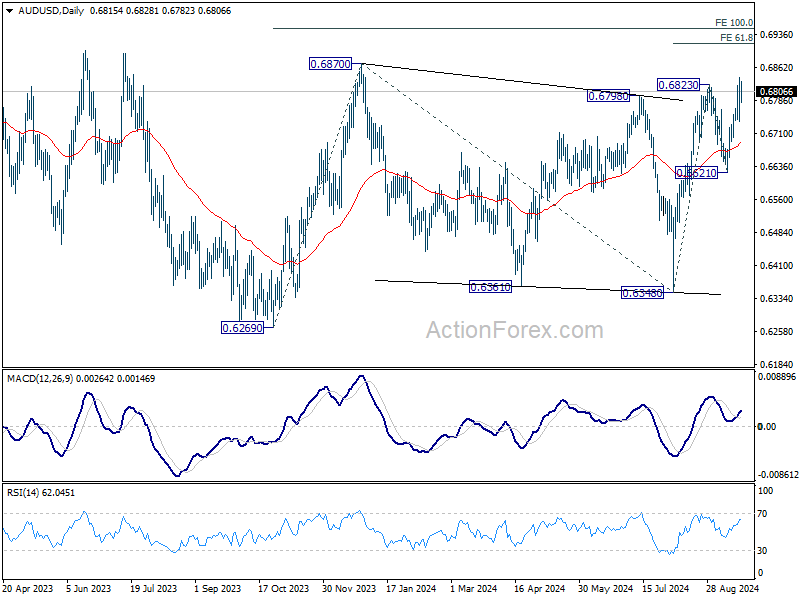
In the bigger picture, overall, price actions from 0.6169 (2022 low) are seen as a medium term corrective pattern, with rise from 0.6269 as the third leg. Firm break of 6870 resistance zone will target 100% projection of 0.6269 to 0.6870 from 0.6340 at 0.6941. In case of another fall, strong support should be seen from 0.6169/6361 to bring rebound.
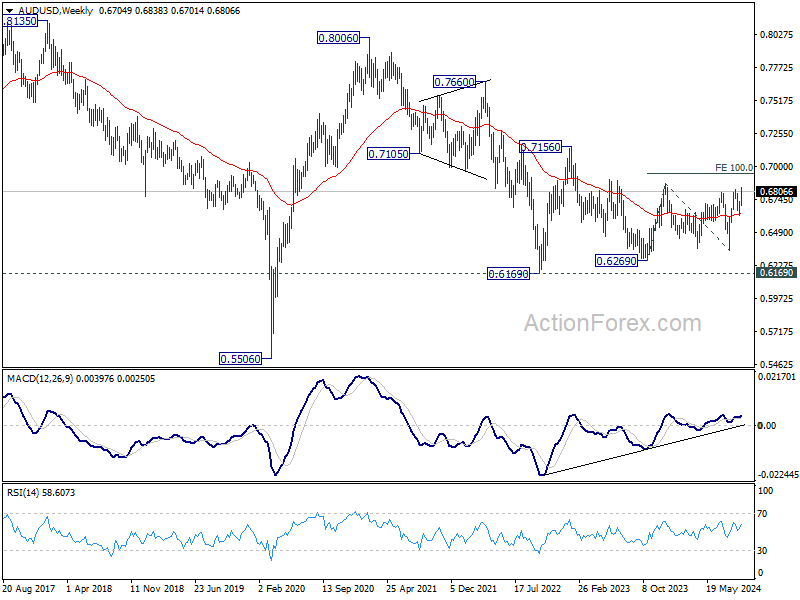
In the long term picture, the down trend from 1.1079 (2011 high) should have completed at 0.5506 (2020 low) already. It's unsure yet whether price actions from 0.5506 are developing into a corrective pattern, or trend reversal. But in either case, fall from 0.8006 is seen as the second leg of the pattern. Hence, in case of deeper decline, strong support should emerge above 0.5506 to bring reversal.
EUR/USD Weekly Outlook
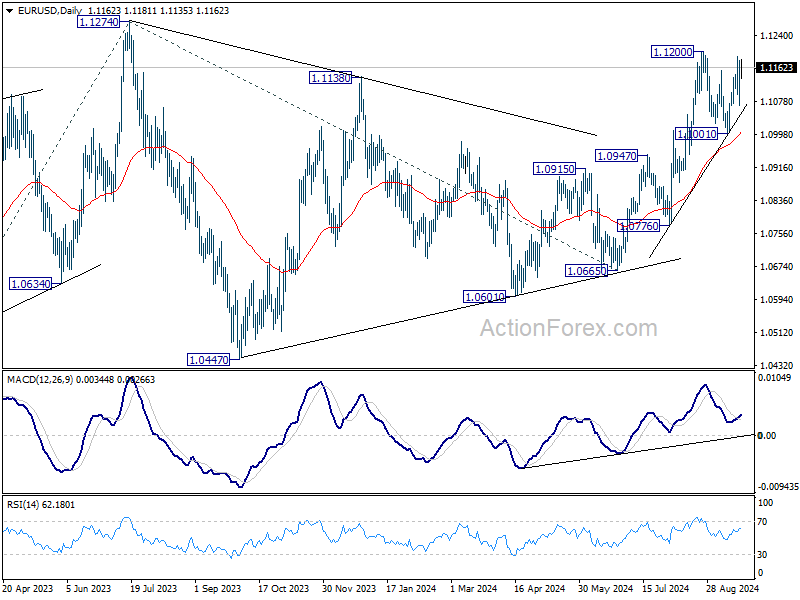
EUR/USD's strong rebound last week suggests that correction from 1.1200 has completed at 1.1001 already. Initial bias stays mildly on the upside this week. Decisive break of 1.1200 will resume whole rally fro 1.0665 to 1.1274 high. Firm break there will resume larger up trend. On the downside, however, break of 1.1072 will turn bias back to the downside for 1.1001 support instead.
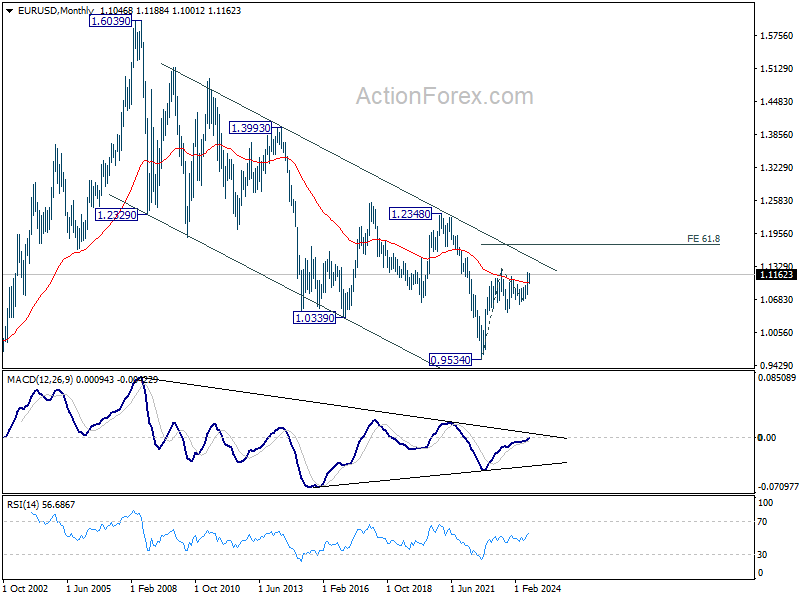
In the bigger picture, prior break of 1.1138 resistance indicates that corrective pattern from 1.1274 might have completed at 1.0665 already. Decisive break of 1.1274 (2023 high) will confirm resumption of whole up trend from 0.9534 (2022 low). Next target will be 61.8% projection of 0.9534 to 1.1274 from 1.0665 at 1.1740. This will now be the favored case as long as 1.0947 resistance turned support holds.
In the long term picture, a long term bottom is in place at 0.9534 (2022 low). The strong break of 55 M EMA (now at 1.1018) is taken as the first sign of bullish trend reversal. But still, firm break of 1.2348 structural resistance is needed to confirm. Otherwise, price actions from 0.9534 could still develop into a consolidation pattern.

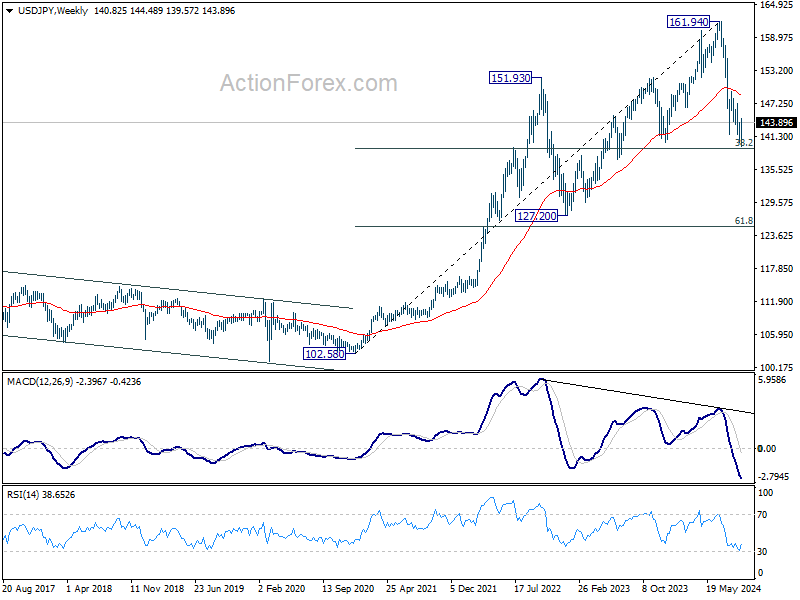
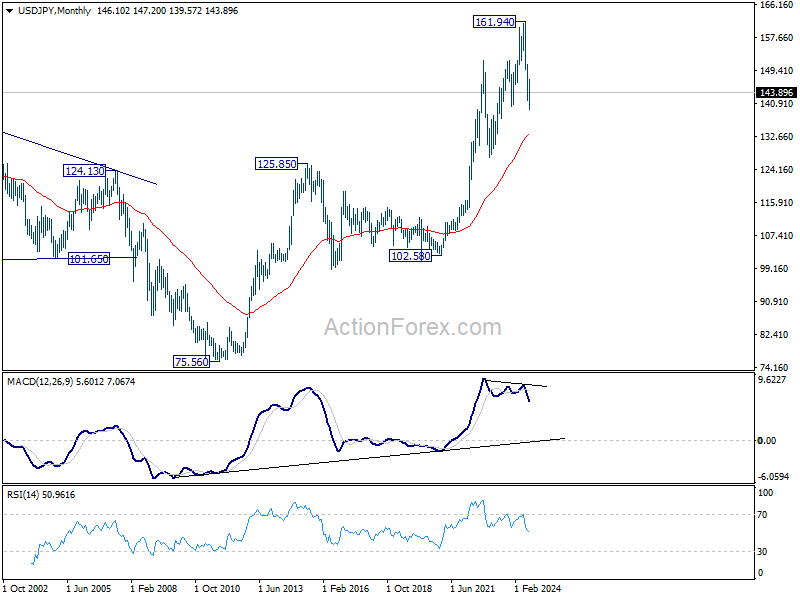
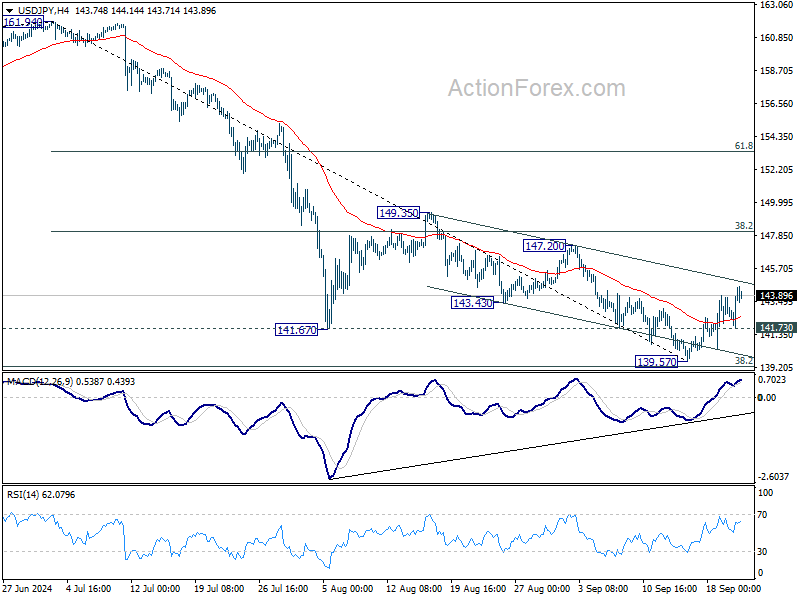
USD/JPY Weekly Outlook
USD/JPY's rebound last week suggests short term bottoming at 139.57. just ahead of 139.26 key fibonacci level. Initial bias remains mildly on the upside this week. Further rise would be seen to 38.2% retracement of 161.94 to 139.57 at 148.11. On the downside, below 141.73 minor support will turn bias to the downside for retesting 139.57 instead.
In the bigger picture, fall from 161.94 medium term top is seen as correcting whole up trend from 102.58 (2021 low). Strong support could be seen from 38.2% retracement of 102.58 to 161.94 at 139.26 to contain downside, at least on first attempt. But in any case, risk will stay on the downside as long as 149.35 resistance holds. Sustained break of 139.26 would open up deeper medium term decline to 61.8% retracement at 125.25.
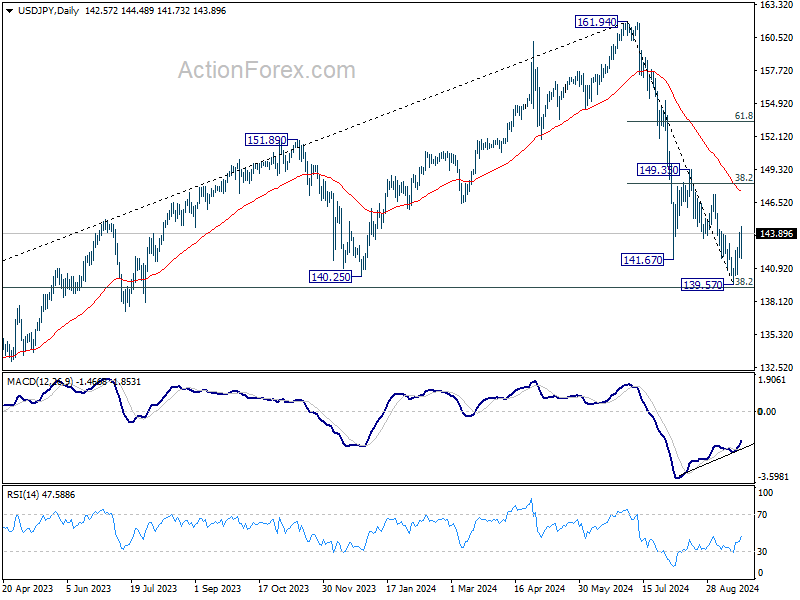
In the long term picture, it's still early to conclude that up trend from 75.56 (2011 low) has completed. However, a medium term corrective phase should have commenced, with risk of deep correction towards 55 M EMA (now at 133.19).