Sample Category Title
USD/JPY Daily Outlook
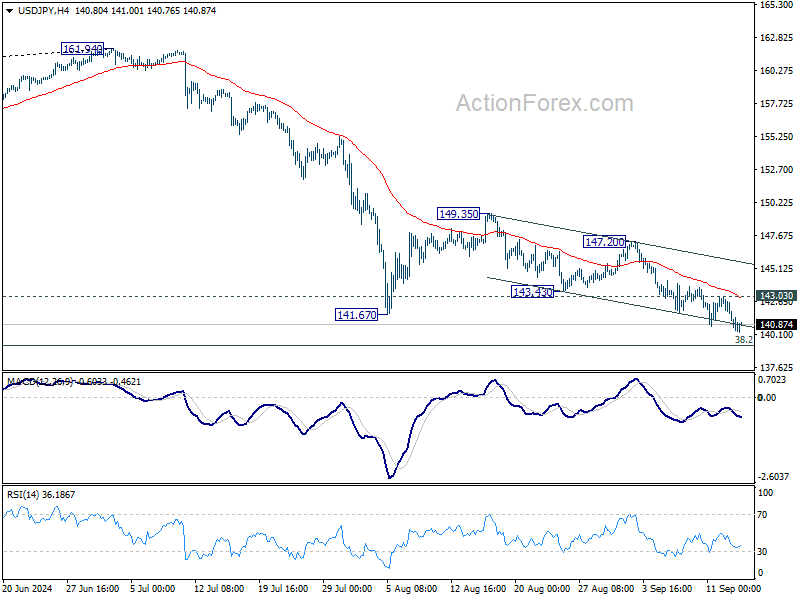
Daily Pivots: (S1) 140.08; (P) 140.99; (R1) 141.69; More...
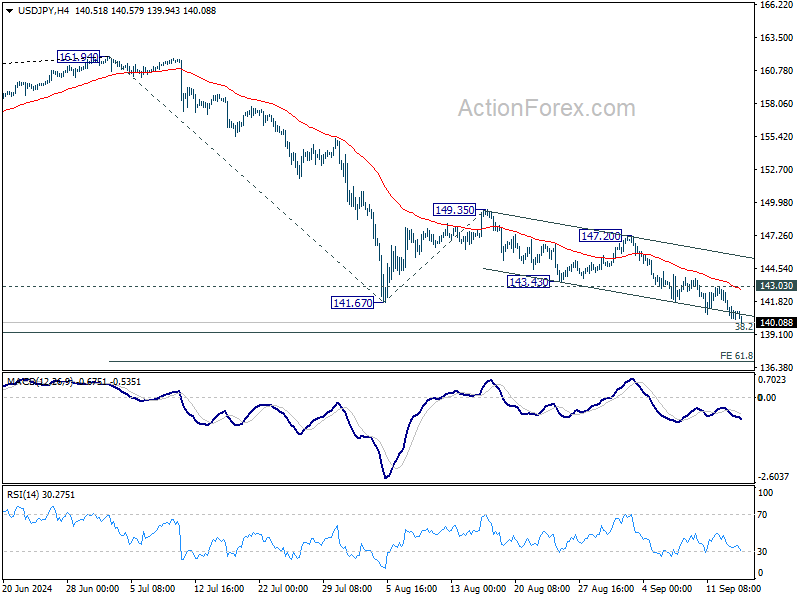
Intraday bias in USD/JPY remains on the downside for 139.26 fibonacci level. Some support could be seen there to bring rebound. But outlook will remain bearish as long as 143.03 resistance holds. Decisive break of 139.26 would carry larger bearish implications, and target 61.8% projection of 161.94 to 141.67 from 149.35 at 136.82.
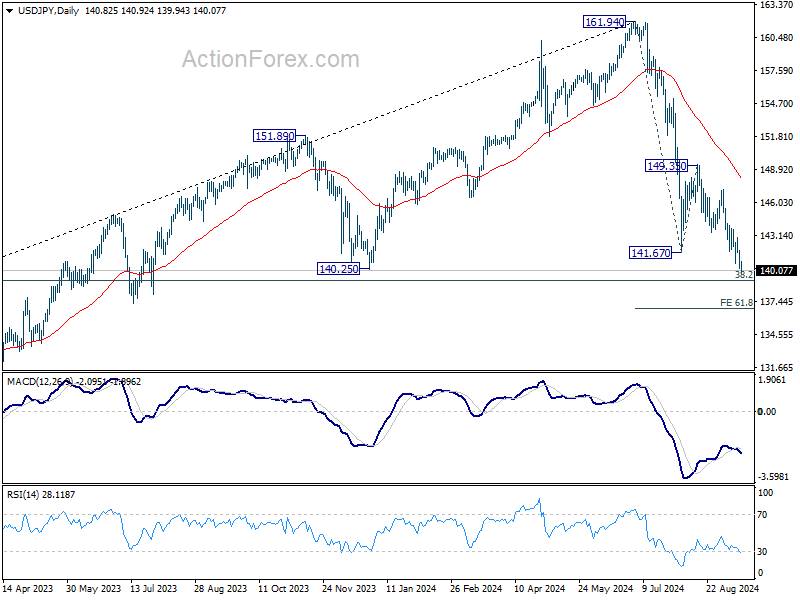
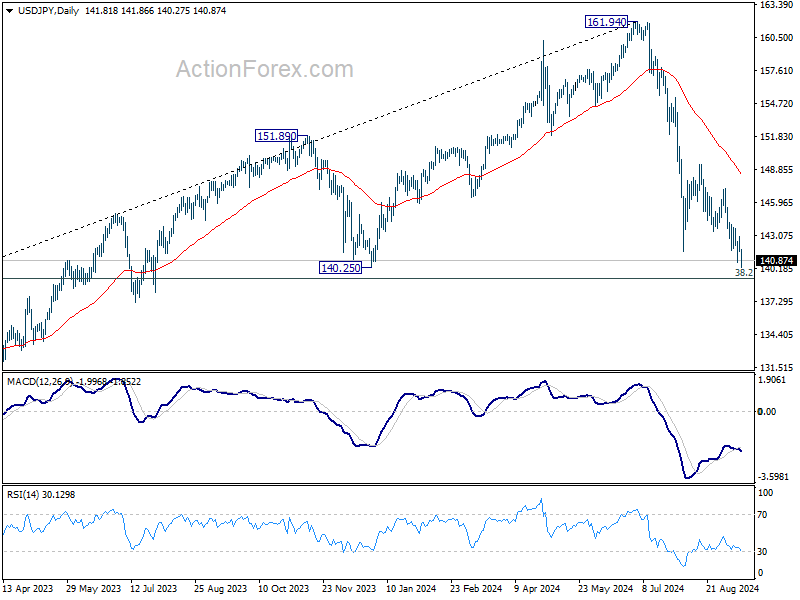
In the bigger picture, fall from 161.94 medium term top is seen as correcting whole up trend from 102.58 (2021 low). Deeper decline could be seen to 38.2% retracement of 102.58 to 161.94 at 139.26, which is close to 140.25 support. Strong support could be seen there to bring rebound. But in any case, risk will stay on the downside as long as 149.35 resistance holds. Sustained break of 139.26 would open up deeper medium term decline to 61.8% retracement at 125.25.
FOMC Uncertainty Looms Over Quiet Markets as Yen Strengthens
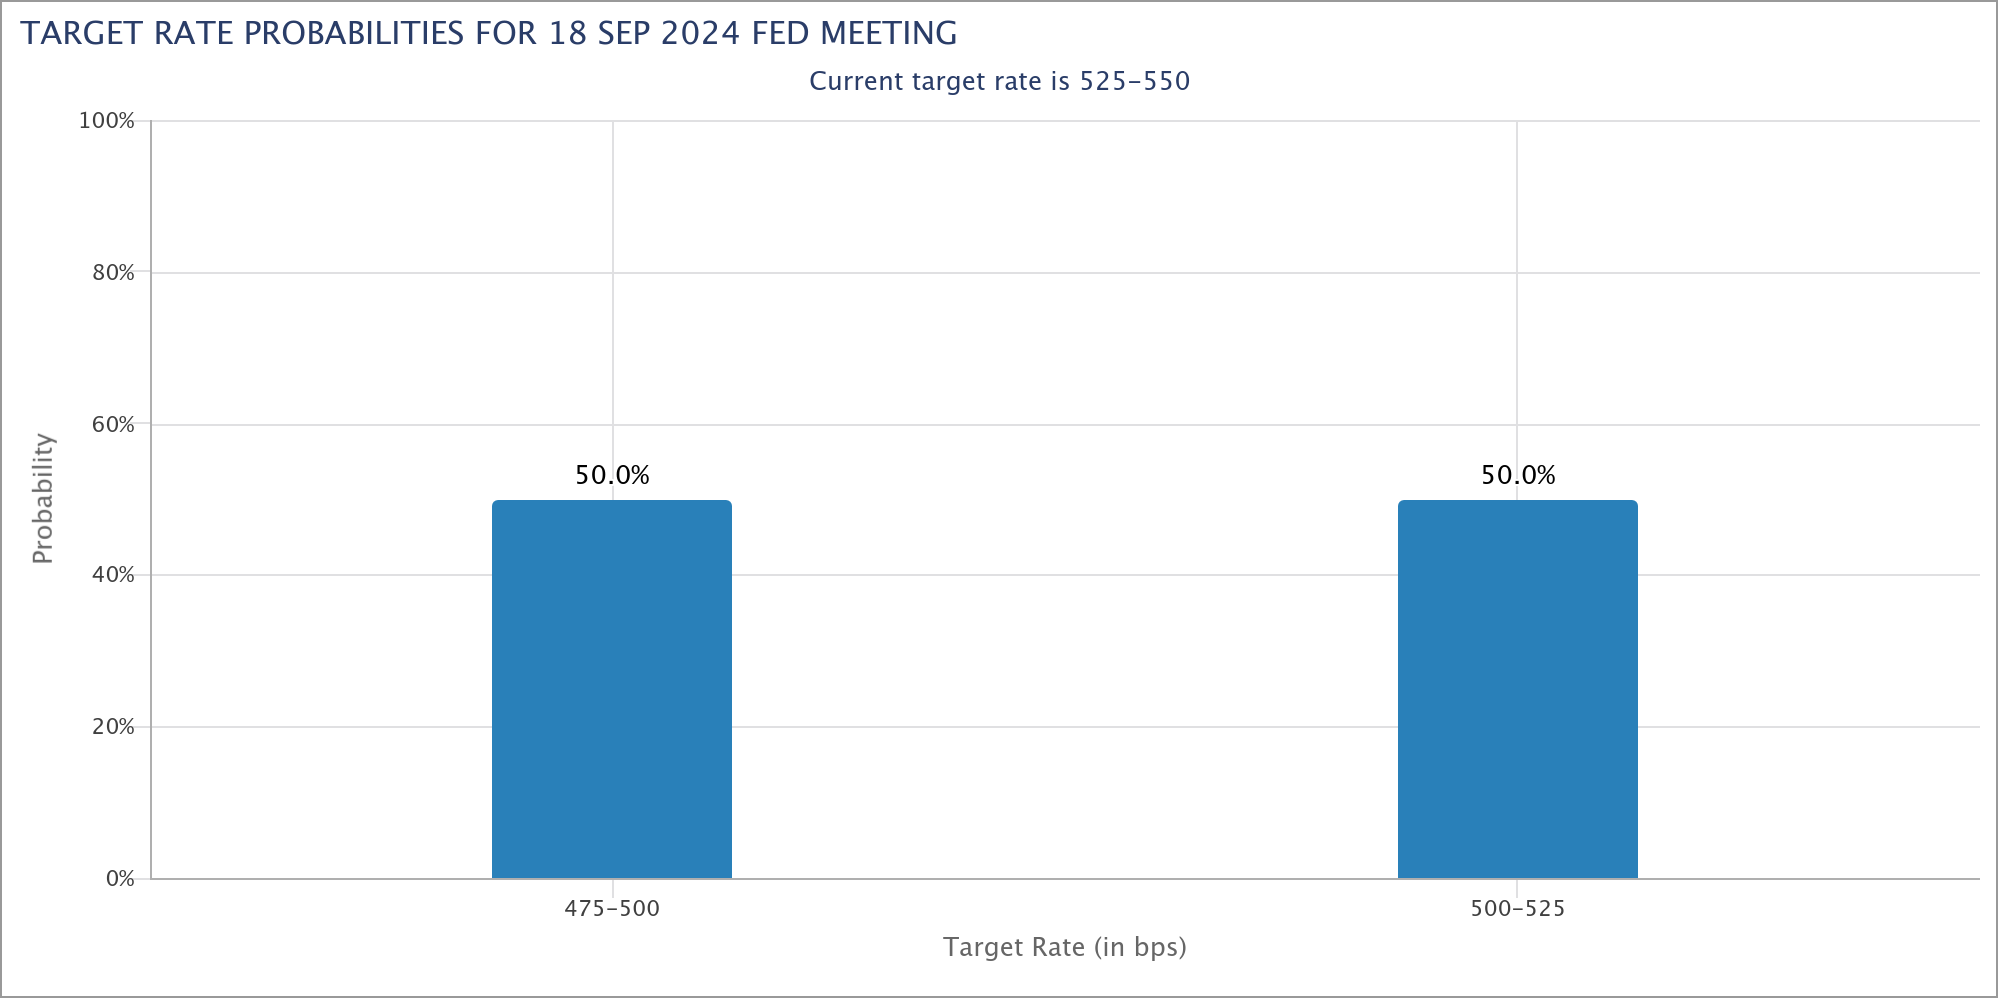
Market activity in Asia has been unusually subdued today, with trading volumes even quieter than expected for the first session of the week. The holiday closures in Japan and China are partly responsible for the reduced momentum, but a larger factor looms over the markets: the upcoming FOMC meeting, which is one of the most uncertain in recent memory. With just days to go, the odds of either a 25bps or 50bps rate cut remain balanced, making it a genuine 50/50 scenario that has traders on edge.
This uncertainty is contributing to the cautious tone across markets globally, and the direction for the rest of the week will hinge largely on the outcome of Wednesday's Fed decision. It's not just about the rate cut but also about the signals Fed will send regarding its future path of policy easing.
Among the currencies, Japanese Yen, the strongest performers this month so far, looks ready to break higher against several of its major counterparts. While Euro is showing resilience as the second best, remains vulnerable against Sterling and the Swiss Franc. Commodity currencies, including the Australian and New Zealand Dollars, have lagged behind for the month, but they may find renewed strength if US stocks rally after the Fed's decision.
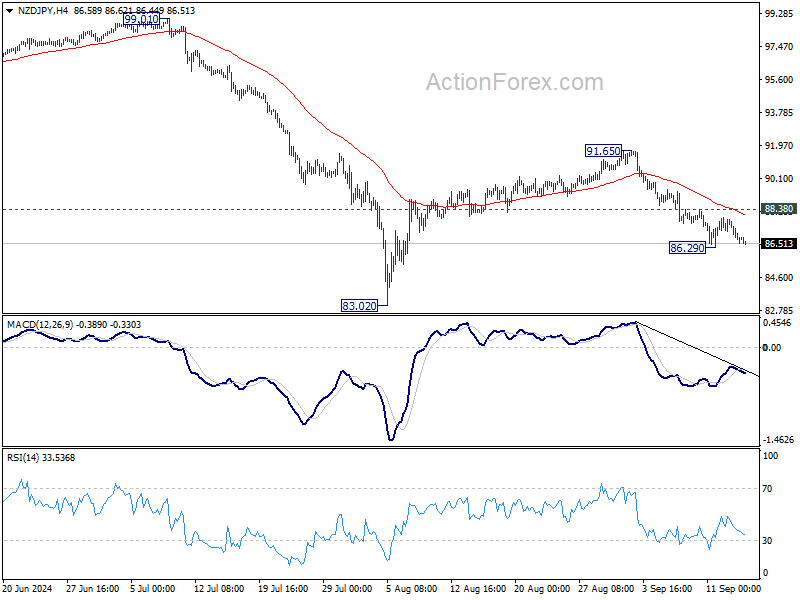
Technically, NZD/JPY is heading back towards 86.29 temporary low as recovery from there faltered ahead of 55 4H EMA. Break there will resume the fall from 91.65 towards 83.02 low. For now, deeper decline will remain in favor as long as 88.38 resistance holds even in case of recovery. In addition to FOMC, New Zealand GDP, BoJ meeting and Japan CPI release could also be the trigger of the next significant move.
In Asia, at the time of writing, Japan and China are on holiday. Hong Kong HSI is down -0.27%. Singapore Strait Times is down -0.43%.
NZ BNZ services ticks up to 45.5, longest contraction since GFC
New Zealand's BusinessNZ Performance of Services Index edged up slightly in August, rising from 45.2 to 45.5, but still remains well below the long-term average of 53.2. The data shows that the service sector is continuing to struggle, with the index remaining in contraction for the sixth consecutive month, marking the longest period of decline since the global financial crisis.
Breaking down the numbers, activity/sales increased from 41.2 to 43.9, while employment also saw a slight rise from 47.0 to 43.9. However, new orders/business fell from 47.0 to 46.6, and stocks/inventories dropped from 45.3 to 44.6. Supplier deliveries improved marginally from 41.1 to 43.3.
The proportion of negative comments decreased to 60.8% in August, down from 67.0% in July and June. Despite the modest improvement, businesses continued to cite the high cost of living and challenging economic conditions as key concerns.
BNZ's Senior Economist Doug Steel noted, "Smoothing through monthly volatility, the PSI's 3-month average remains deep in contractionary territory at 43.9. The PSI has been in contraction for six consecutive months, which is the longest continuous period of decline since the GFC."
China's industrial production slows to 4.5%, retail sales miss at 2.1%
China's latest economic data reveals cooling in key areas, with industrial production growing by 4.5% yoy in August, falling short of the 4.7% expected and marking a deceleration from July's 5.1% rise.
Retail sales showed a similarly weaker-than-anticipated performance, increasing by just 2.1% yoy, compared to the 2.5% forecast and down from 2.7% in July.
The slowdown highlights ongoing imbalances in the economy, with stronger industrial production contrasted by weaker consumer demand.
Fixed asset investment also came in below expectations, rising 3.4% ytd yoy, while real estate sector continues to drag, showing a decline of -10.2% through August—the same as in July.
Liu Aihua, spokesperson for the National Bureau of Statistics, pointed to challenges, such as extreme weather and natural disasters, as factors behind last month's slower growth.
NBS added, "the adverse impacts arising from changes in the external environment are increasing," further noting that China's path to recovery faces "multiple difficulties and challenges."
Uncertainty clouds FOMC decision; BoE and BoJ to meet too
Three major central banks are scheduled to meet this week, with Fed, BoE, and BoJ at the forefront.
Among these, FOMC meeting carries the most intrigue, as markets remain sharply divided over whether Fed will deliver a 25bps or 50bps rate cut on Wednesday. The decision itself is crucial, but the same are the fresh economic projections and the updated "dot plot," which could shape expectations for the pace of future rate cuts well into 2025.
The stakes are high. In June, Fed's median projections indicated just one 25bps cut by year-end, followed by 100bps of cuts through 2025, and another 100bps in 2026, with a longer-term terminal rate of 2.8%. But these outdated forecasts will certainly be changed.
Now, markets are buzzing with speculation that Fed could take a more aggressive stance. A faster pace of policy easing is surely expected from the new projections. But how fast could that be? And where and when is the end-point of the cycle? These details will likely trigger complex market reactions as traders dissect multiple scenarios.
Turning to the UK, BoE is widely expected to leave its policy rate unchanged at 5.00%. A Reuters poll of economists unanimously predicted this outcome, with markets pricing in only a small, one-in-five chance of a surprise 25bps cut. However, the key to watch will be the voting patterns that could offer clues on whether a rate cut is likely at November meeting, as the market now expects.
Over in Japan, BoJ is also expected to hold rates steady at 0.25%. But with inflationary pressures and wage growth starting to gain traction, the bank's outlook for tightening is becoming more of a question of "when" rather than "if." According to a Bloomberg survey, 87% of economists predict a rate hike before end of January, with 53% expecting this as early as December. BoJ's challenge will be to remain patient while weighing incoming economic data.
The data calendar this week is also loaded with important releases. US retail sales, UK inflation and retail sales, Germany's ZEW economic sentiment, Japan's CPI, Canada's CPI, New Zealand GDP, and Australian employment numbers will factor into the market's volatility this week.
Here are some highlights for the week:
- Monday: New Zealand BusinessNZ services index; Swiss PPI; Eurozone trade balance; Canada manufacturing sales; US Empire state manufacturing index.
- Tuesday: Japan tertiary industry index; Germany ZEW economic sentiment; Canada housing starts, CPI; US retail sales, industrial production, business inventories, NAHB housing index.
- Wednesday: New Zealand current account; Japan trade balance, machine orders; UK CPI, PPI; Eurozone CPI final; US FOMC rate decision, housing starts and building permits; BoC summary of deliberations.
- Thursday: New Zealand GDP; Australia employment; Swiss trade balance, SECO economic forecasts; Eurozone current account; BoE rate decision; US jobless claims, Philly Fed survey, current account, existing home sales.
- Friday: UK Gfk consumer confidence; Japan CPI, BoJ rate decision; UK retail sales; Canada retail sales, IPPI and RMPI; Eurozone consumer confidence.
USD/JPY Daily Outlook
Daily Pivots: (S1) 140.08; (P) 140.99; (R1) 141.69; More...
Intraday bias in USD/JPY remains on the downside for 139.26 fibonacci level. Some support could be seen there to bring rebound. But outlook will remain bearish as long as 143.03 resistance holds. Decisive break of 139.26 would carry larger bearish implications, and target 61.8% projection of 161.94 to 141.67 from 149.35 at 136.82.
In the bigger picture, fall from 161.94 medium term top is seen as correcting whole up trend from 102.58 (2021 low). Deeper decline could be seen to 38.2% retracement of 102.58 to 161.94 at 139.26, which is close to 140.25 support. Strong support could be seen there to bring rebound. But in any case, risk will stay on the downside as long as 149.35 resistance holds. Sustained break of 139.26 would open up deeper medium term decline to 61.8% retracement at 125.25.
Economic Indicators Update
| GMT | CCY | EVENTS | ACT | F/C | PP | REV |
|---|---|---|---|---|---|---|
| 22:30 | NZD | Business NZ PSI Aug | 45.5 | 44.6 | 45.2 | |
| 23:01 | GBP | Rightmove House Price Index M/M Sep | 0.80% | -1.50% | ||
| 06:30 | CHF | Producer and Import Prices M/M Aug | 0.10% | 0.00% | ||
| 06:30 | CHF | Producer and Import Prices Y/Y Aug | -1.70% | |||
| 09:00 | EUR | Eurozone Trade Balance (EUR) Jul | 20.3B | 17.5B | ||
| 12:30 | CAD | Manufacturing Sales M/M Jul | 0.70% | -2.10% | ||
| 12:30 | USD | Empire State Manufacturing Index Sep | -3.9 | -4.7 |
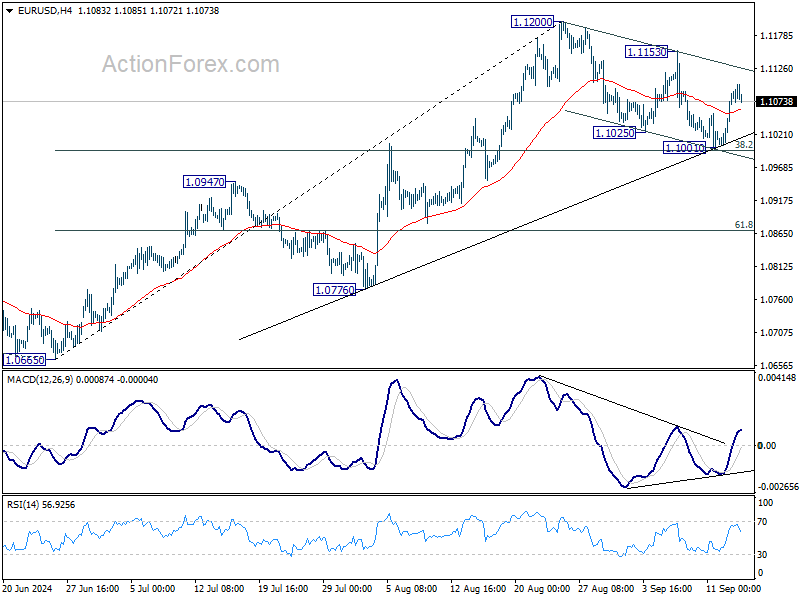
EUR/USD Could Trim Gains and Drop: Here’s Why
Key Highlights
- EUR/USD attempted another increase from the 1.1000 support.
- A major bearish trend line is forming with resistance at 1.1110 on the 4-hour chart.
- Gold rallied to a new all-time high above $2,580.
- USD/JPY extended losses below the 141.20 support.
EUR/USD Technical Analysis
The Euro found support near the 1.1000 zone against the US Dollar. EUR/USD started another increase above the 1.1050 resistance zone.
Looking at the 4-hour chart, the pair climbed above the 50% Fib retracement level of the downward move from the 1.1155 swing high to the 1.1003 low. The pair remained stable above the 200 simple moving average (green, 4-hour) but struggled to clear the 100 simple moving average (red, 4-hour).
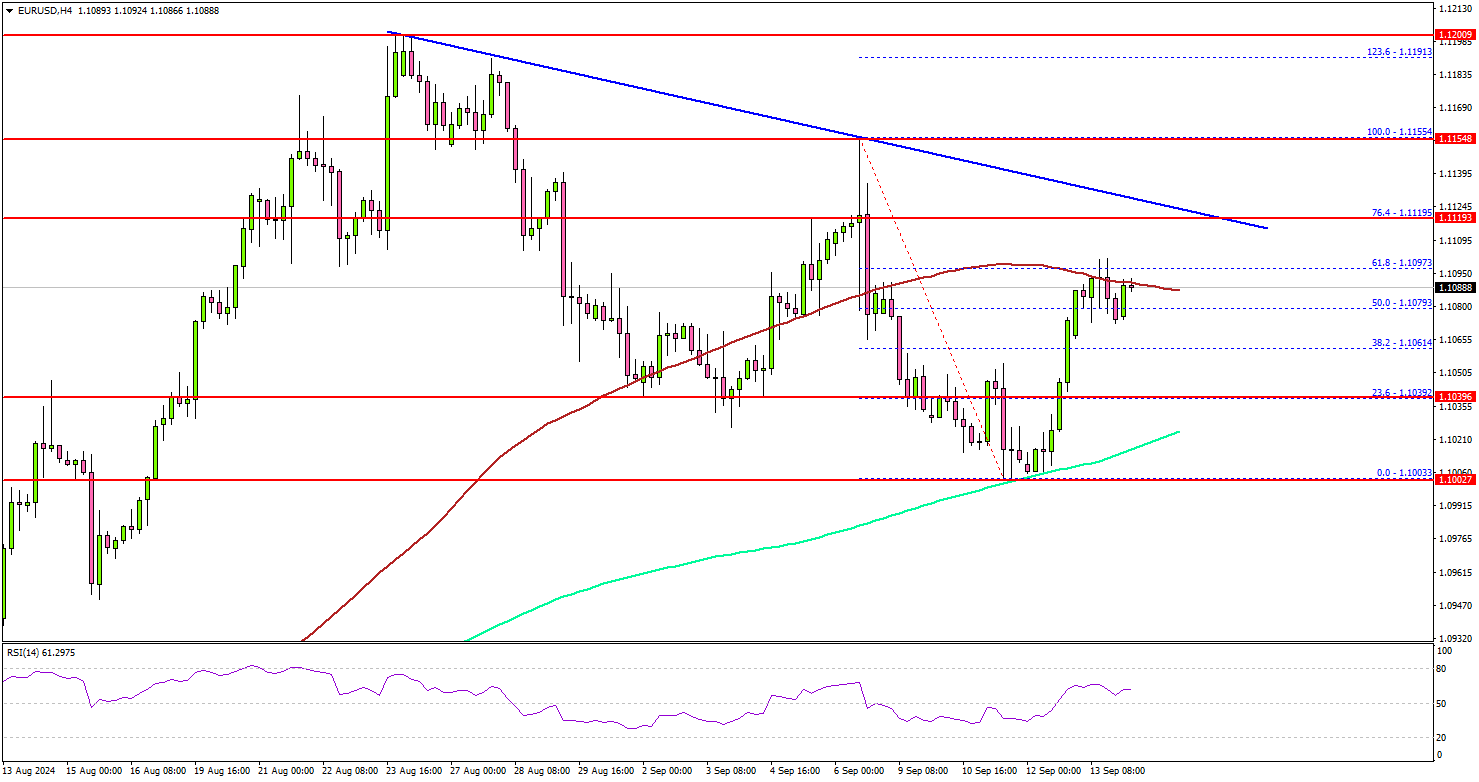
It also faced sellers near the 61.8% Fib retracement level of the downward move from the 1.1155 swing high to the 1.1003 low at 1.1100.
Besides, there is a major bearish trend line forming with resistance at 1.1110 on the same chart. A clear move above the 100 simple moving average (red, 4-hour) and the trend line might set the pace for a move toward 1.1150. Any more gains might call for a test of the 1.1200 zone.
On the downside, immediate support sits near the 1.1040 level. The next key support sits near the 200 simple moving average (green, 4-hour) at 1.1020. A downside break below the 1.1020 level could set the pace for a larger decline. The next major support is near the 1.0950 level.
Looking at Gold, the bulls remained in action and were able to push the price to a new all-time high above $2,580 on TitanFX.
Upcoming Economic Events:
- NY Empire State Manufacturing Index for Sep 2024 – Forecast -3.9, versus -4.7 previous.
NZ BNZ services ticks up to 45.5, longest contraction since GFC
New Zealand’s BusinessNZ Performance of Services Index edged up slightly in August, rising from 45.2 to 45.5, but still remains well below the long-term average of 53.2. The data shows that the service sector is continuing to struggle, with the index remaining in contraction for the sixth consecutive month, marking the longest period of decline since the global financial crisis.
Breaking down the numbers, activity/sales increased from 41.2 to 43.9, while employment also saw a slight rise from 47.0 to 43.9. However, new orders/business fell from 47.0 to 46.6, and stocks/inventories dropped from 45.3 to 44.6. Supplier deliveries improved marginally from 41.1 to 43.3.
The proportion of negative comments decreased to 60.8% in August, down from 67.0% in July and June. Despite the modest improvement, businesses continued to cite the high cost of living and challenging economic conditions as key concerns.
BNZ’s Senior Economist Doug Steel noted, “Smoothing through monthly volatility, the PSI’s 3-month average remains deep in contractionary territory at 43.9. The PSI has been in contraction for six consecutive months, which is the longest continuous period of decline since the GFC.”

China’s industrial production slows to 4.5%, retail sales miss at 2.1%
China's latest economic data reveals cooling in key areas, with industrial production growing by 4.5% yoy in August, falling short of the 4.7% expected and marking a deceleration from July’s 5.1% rise.
Retail sales showed a similarly weaker-than-anticipated performance, increasing by just 2.1% yoy, compared to the 2.5% forecast and down from 2.7% in July.
The slowdown highlights ongoing imbalances in the economy, with stronger industrial production contrasted by weaker consumer demand.
Fixed asset investment also came in below expectations, rising 3.4% ytd yoy, while real estate sector continues to drag, showing a decline of -10.2% through August—the same as in July.
Liu Aihua, spokesperson for the National Bureau of Statistics, pointed to challenges, such as extreme weather and natural disasters, as factors behind last month’s slower growth.
The NBS added, "the adverse impacts arising from changes in the external environment are increasing," further noting that China's path to recovery faces "multiple difficulties and challenges."
Fed Rate Decision: Intrigue Returns
Influential financial media are promoting the need for a 50-basis point rate cut. The Fed’s blackout period starts 10 days before the rate decision is released, so the main influence on the markets during this time comes from traders’ interpretation of data and commentary from influential speakers in major financial media.
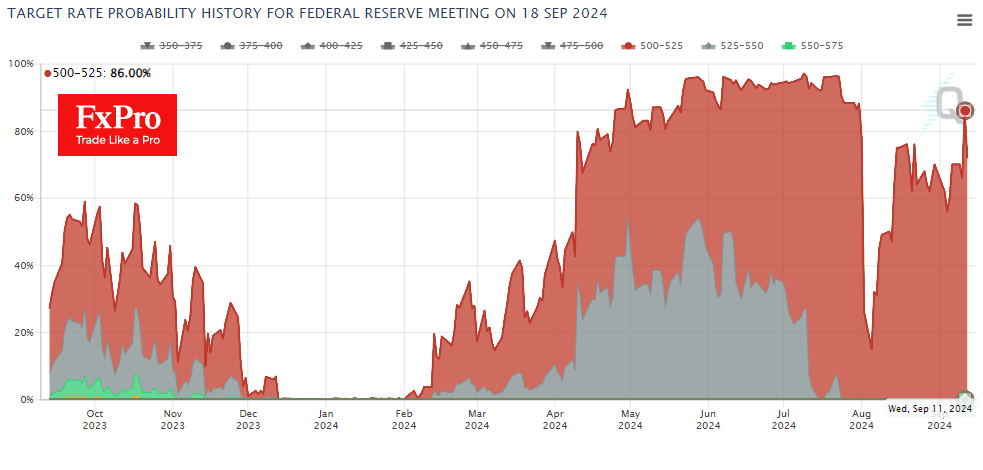
Employment and inflation figures were the defining data. The brief conclusion is that the US economy continues to create jobs, albeit at a slower rate. Inflation, meanwhile, is slowing but remains at elevated levels. The latest CPI report convinced markets that the first decline in the cycle would be 25 points. The odds of this outcome exceeded 85% on Wednesday, but the situation changed dramatically at the end of the week.
An influential speaker – former New York FRB head Bill Dudley – points to the need for a decisive rate cut. On Thursday, the WSJ published an extensive article by influential observer Nick Timiraos, who is considered by many to be a ‘Fed insider’ and points out that this is a ‘close call.’ The Financial Times speaks in the same terms in an editorial. An influential guest speaker and former manager of PIMCO’s largest bond fund – Mohamed El-Erian – who publicly accused the Fed of sleeping through inflation, now points out that the bond market is signalling a recession and is setting up for a 200-point rate cut in the next 12 months.
The press bombardment affected the markets, with the dollar going down and the stock market going up. This also served Gold well, which managed to break out of a prolonged consolidation.
Now, there is intrigue: is this really a hint that the Fed is preparing us for a hike? It is also possible that the FOMC will not dare to go directly against such strong confidence in Fed softness. This shift in narrative is spurring gains in equities and could potentially take the S&P500 back to the highs near 5675 before the meeting. The dollar index is also on its way to the August lows, from where it has reversed to the upside. What happens next – breakout or pullback – the markets will decide in Wednesday night’s statement.
GBPCAD Wave Analysis
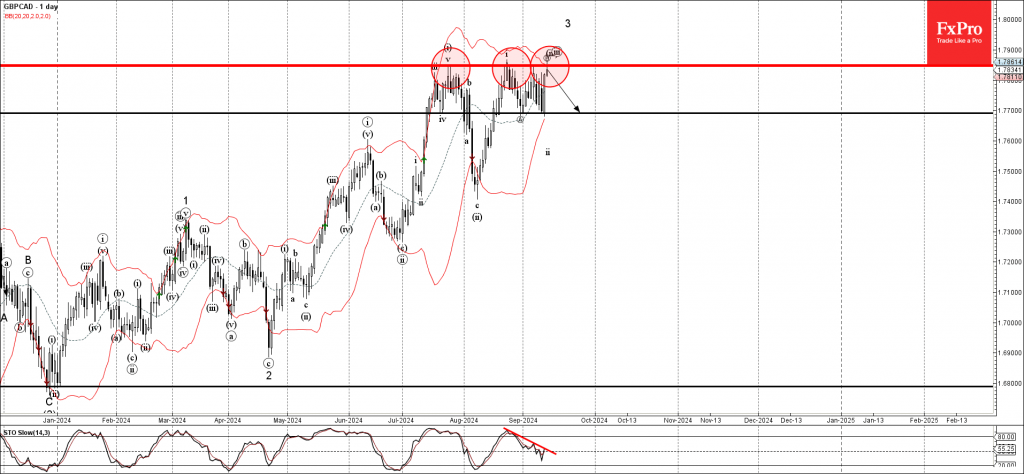
- GBPCAD reversed from strong resistance level 1.7850
- Likely to fall to support level 1.7700
GBPCAD currency pair today reversed down from the strong resistance level 1.7850, which stopped the previous impulse waves (i) and i in July and August respectively.
The resistance level 1.7850 was further strengthened by the upper daily Bollinger Band.
Given the strength of the resistance level 1.7850 and the bearish divergence on the daily Stochastic, GBPCAD currency pair can be expected to fall further to the next support level 1.7700 (low of the minor correction a from last month).
Rumors Eclipse Data in Market Sentiment, Dollar Braces for Downside Risk
The financial markets have been more influenced by speculations than by concrete economic data, as anticipation builds ahead of Fed's interest rate decision on September 18. Recent US economic indicators, including the latest CPI report and the prior week's non-farm payrolls, pointed toward a cautious and modest 25bps rate cut. However, traders and investors chose to focus on media reports hinting that Fed's decision remains a close call, with the possibility of a larger50 bps cut still on the table.
Whether these reports are based on legitimate leaks or speculation, the mere possibility of a larger cut has caused significant reactions across financial markets. Dollar and Treasury yields declined notably in the latter part of the week. Equity markets, on the other hand, rallied strongly, with DOW on the verge of making new historical highs. Gold prices shot to record, benefiting from expectations of looser monetary policy.
Overall in the currency markets, Yen ended as the strongest performer last week, supported by expectations that BoJ will maintain its gradual tightening path. While the pace of future rate hikes remains uncertain, the narrowing interest rate differential between Japan and other major economies continues to lend support to Yen.
Australian Dollar followed suit, buoyed by data showing resilient consumer confidence and inflation expectations, suggesting that the economic sthe pressure on lowdown has been measured. This has urgency for RBA to pull ahead the rate cut plan. Sterling ended as the third, as expectations solidify that BoE will skip a rate cut this month.
On the weaker side, Swiss Franc posted the worst performance of the week, but likely just consolidating after its recent rally. New Zealand Dollar and Canadian Dollar also struggled, rounding out the weakest currencies for the week. Euro ended the week mixed, grappling with ECB's decision to cut rates while offering little forward guidance on its next steps.
DOW Near Record High as 50bps Fed Cut Remains on the Table, Dollar and Yields Falter
As another week passes, the central question remains: Will Fed kick start its rate-cut cycle with a 25bps or 50bps reduction at its September 18 meeting? Initially, the August CPI report, which revealed a slightly higher-than-expected core inflation reading, seemed to rule out the possibility of a larger 50bps cut. However, speculation has resurfaced after media reports suggested that the decision remains tightly balanced. Market odds for a 50bps cut, as reflected in fed fund futures, bounced back to 50% after dipping below 20%, making it a true coin toss.
Both sides of the debate present valid arguments, but ultimately, the Fed must decide what message it wishes to send to the markets. Does a 50bps cut suggest that the central bank is deeply concerned about a severe economic downturn? Or is it so confident that inflation is under control and won't re-emerge? Moreover, would such a move signal that Fed could implement additional 50bps cuts in subsequent meetings? The implications are significant, and Fed officials must carefully consider how their decision will be interpreted.
Traditionally, uncertainty is not welcomed by stock investors, but in this case, markets have rallied despite the ambiguity. S&P 500 rose 4%, while NASDAQ gained 5.9%, marking the best week of 2024 for both indexes. DOW advanced 2.6% as well.
Technically, DOW is now indeed just inch below record high at 41585.21. The strong bounce from rising 55 D EMA is a clear bullish signal. Firm break of 41585.21 will extend the larger up trend towards 61.8% projection from 32327.20 to 39889.05 from 38000.96 at 42674.18 next.
Also, the up trend from 28660.94 remains healthy as DOW stays comfortably above rising 55 W EMA. Bearish divergence in W RSI might be a concern, but momentum appears to be picking up again as seen in W MACD. Outlook will remain bullish as long as 55 W EMA (now at 38185.23) holds. Next medium term target is 100% projection of 18213.65 to 36952.65 from 28660.94 at 47399.94.
10-year yield continued the down trend from 4.737 and 4.997 last week. Near term outlook will stay bearish as long as 3.923 resistance holds. Next target is 100% projection of 4.997 to 3.785 from 4.737 at 3.525.
The critical question is whether 3.525 will provide sufficient support to stabilize yields. If not, TNX could dive further to 3.253 cluster support (38.2% retracement of 0.398 to 4.997 at at 3.240) before bottoming.
While Dollar was pressured in the latter part of the week, it has indeed ended mixed only. Notably, the greenback remained within the prior week's range against most major rivals, except for Yen.
Dollar Index's price action from 100.51 are clearly corrective looking, which suggests that fall from 106.13 is not over. Outlook will stay bearish as long as 102.16 resistance holds. Firm break of 100.51 will target 99.57 key support level next (2023 low).
The important question for Dollar Index is whether, with consolidation pattern from 99.57 completed at 106.13, and the down trend from 114.77 (2022 high) is ready to resume.
A more bearish scenario would unfold if Fed opts for a larger 50bps rate cut and signals faster easing ahead. That could shoot DOW through to new record with strong momentum and hammers 10-year yield. This scenario would be a double whammy for Dollar. In this case, Dollar Index could be heading to 61.8% projection of 114.77 to 99.57 from 106.13 at 96.73.
Gold Sets New Record as Silver Climbs Sharply Alongside
Gold and Silver also saw significant gains as speculation around Fed's aggressive rate cuts fueled a bullish push in precious metals. Gold, in particular, has already been riding a strong uptrend, supported by central bank purchases and haven demand due to ongoing geopolitical tensions in the Middle East and Ukraine. Now, with growing bets on Fed easing, Gold has broken out of its month-long consolidation, and traders are increasingly bullish, as lower interest rates tend to boost non-yielding assets like gold.
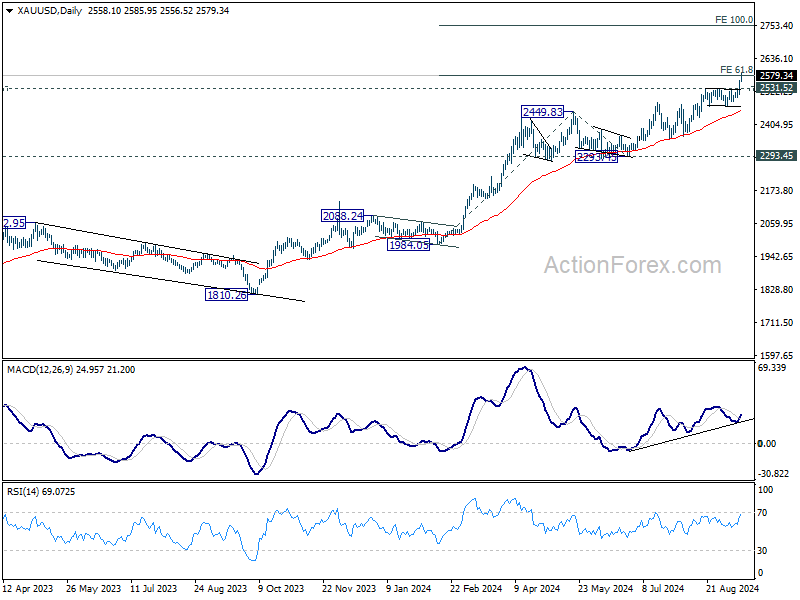
Technically, outlook in Gold will stay bullish as long as 2531.52 resistance turned support holds. Sustained trading above 61.8% projection of 1984.05 to 2449.83 from 2293.45 at 2581.30 could prompt further upside accelerations to 100% projection at 2759.23.
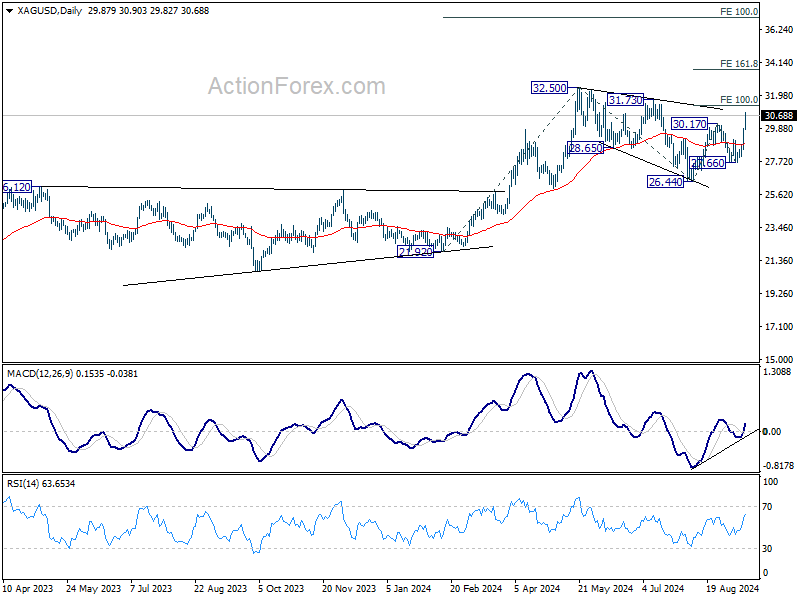
Silver's rise from 26.44 also resumed by breaking through 30.17 resistance. Next target is 100% projection of 26.44 to 30.17 from 27.66 at 29.96. Decisive break there will further solidify the case that whole correction from 32.50 has completed with three waves down to 26.44. In this bullish case, there could be upside acceleration through 32.50 high to 161.8% projection at 33.69.
Euro Wraps Up Week Mixed as ECB Remains Noncommittal After Rate Cut
Euro ended the week with mixed performance after ECB delivered another 25bps rate cut, but offered no clear guidance on future moves. This left markets with little clarity on the ECB's direction, though the general expectation remains that the central bank will continue at a measured pace of one 25bps cut per quarter. ECB looks comfortable with that.
ECB lowered the deposit rate to 3.50%, with President Christine Lagarde avoiding any commitments on when the next reduction might occur. Nevertheless, the accompanying economic projections saw only minor revisions, indicating that despite signs of economic softening, the broader outlook remains relatively stable. Additionally, Lagarde expressed optimism that recovery will strengthen over time as real incomes rise and the effects of tight monetary policy gradually ease.
On inflation, ECB acknowledged that domestic pressures remain high, with wages continuing to climb at elevated rates. However, Lagarde noted that labor cost pressures are starting to moderate, and corporate profits are helping to cushion the inflationary effects of wage growth, reducing the overall impact on prices.
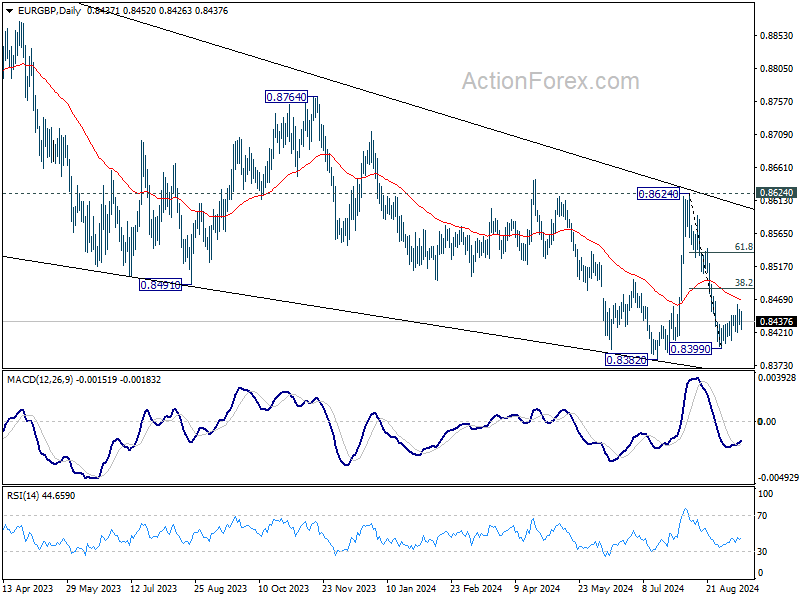
EUR/GBP extended the consolidation pattern from 0.8399 last week, without any attempt to breakout from range. Outlook will remain bearish as long as 38.2% retracement of 0.8624 to 0.8399 at 0.8485. Break of 0.8399 will bring retest of 0.8382 low. Firm break there will resume larger down trend from 0.9267 (2022 high).
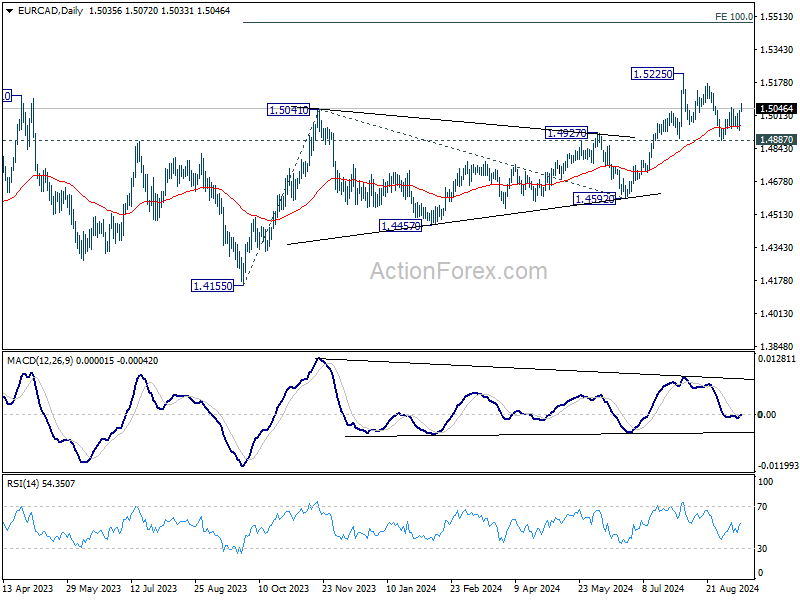
EUR/CAD was also bounded in range below 1.5225 last week. But the support from 55 D EMA is a bullish sign. Also, further rally is expected as long as 1.4887 support holds. Firm break of 1.5225 resistance will resume larger rise to 100% projection of 1.4155 to 1.5041 from 1.4592 at 1.5478.
USD/JPY Weekly Outlook
USD/JPY's fall from 161.94 resumed by breaking through 141.67 support last week. Initial bias stays on the downside this week for 139.26 fibonacci level. Decisive break there would carry larger bearish implications. On the upside, above 143.03 resistance will turn intraday bias neutral first. But outlook will remain bearish as long as 147.20 resistance holds, in case of recovery.
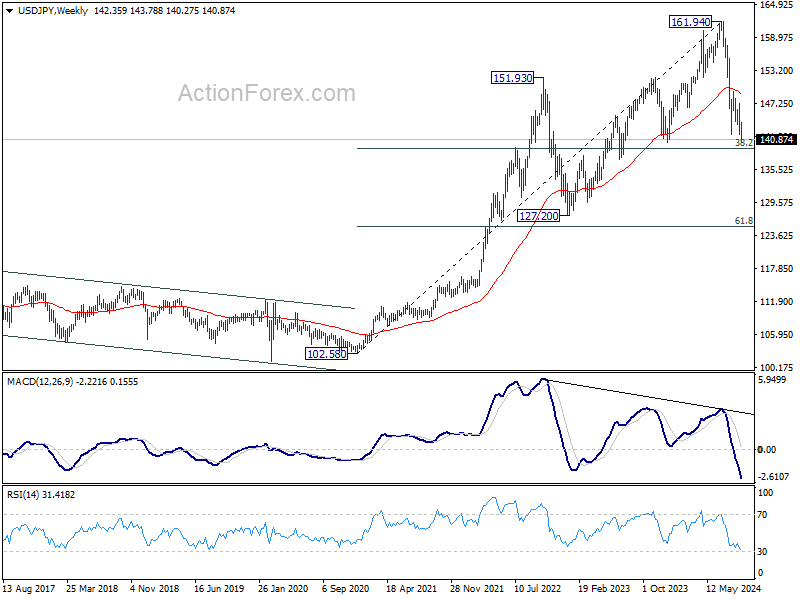
In the bigger picture, fall from 161.94 medium term top is seen as correcting whole up trend from 102.58 (2021 low). Deeper decline could be seen to 38.2% retracement of 102.58 to 161.94 at 139.26, which is close to 140.25 support. Strong support could be seen there to bring rebound. But in any case, risk will stay on the downside as long as 149.35 resistance holds. Sustained break of 139.26 would open up deeper medium term decline to 61.8% retracement at 125.25.
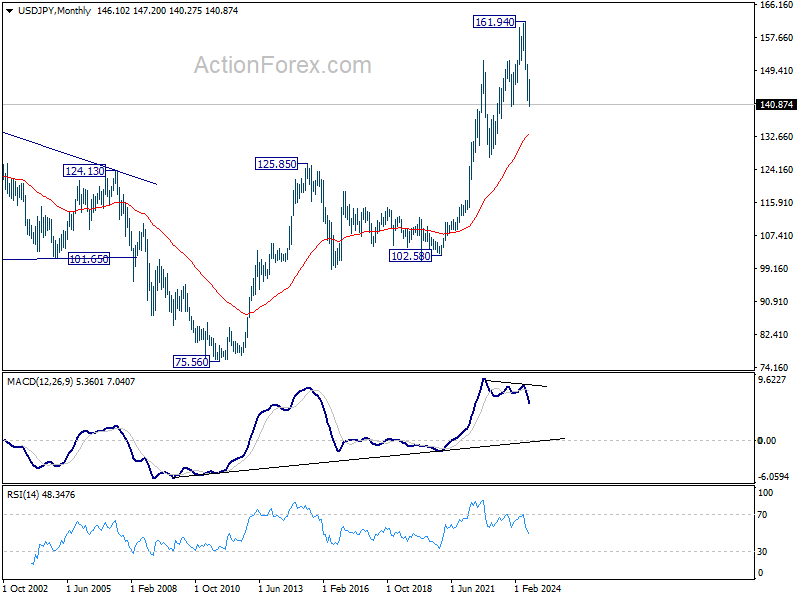
In the long term picture, it's still early to conclude that up trend from 75.56 (2011 low) has completed. However, a medium term corrective phase should have commenced, with risk of deep correction towards 55 M EMA (now at 133.19).
EUR/USD Weekly Outlook
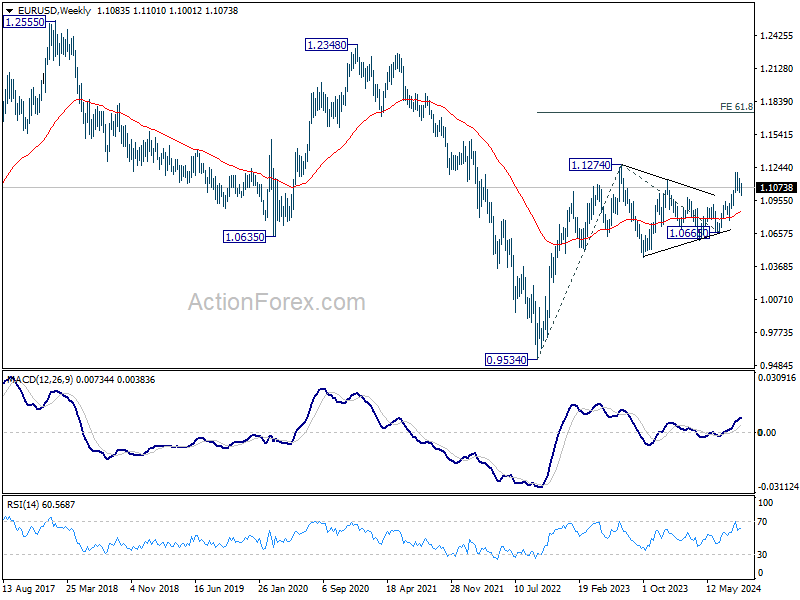
EUR/USD dipped to 1.1001 last week but rebounded ahead of 38.2% retracement of 1.0665 to 1.1200 at 1.0996. Initial bias remains neutral this week first. On the upside, break of 1.1153 resistance will suggest that later rally is ready to resume and target 1.1200, and then 1.1274 high. On the downside, however, sustained break of 1.0996 will indicate reversal and turn bias to the downside for 1.0947 resistance turned support next.
In the bigger picture, prior break of 1.1138 resistance indicates that corrective pattern from 1.1274 might have completed at 1.0665 already. Decisive break of 1.1274 (2023 high) will confirm whole up trend from 0.9534 (2022 low). Next target will be 61.8% projection of 0.9534 to 1.1274 from 1.0665 at 1.1740. This will now be the favored case as long as 1.0947 resistance turned support holds.
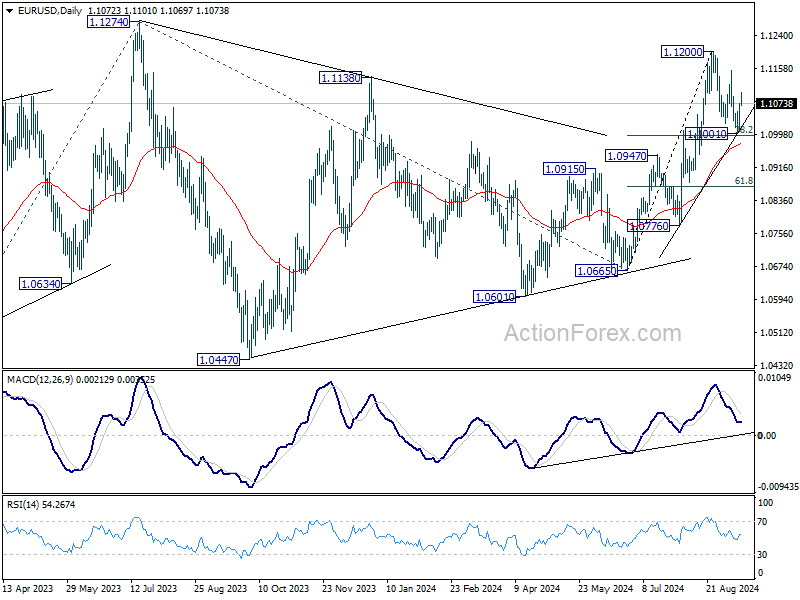
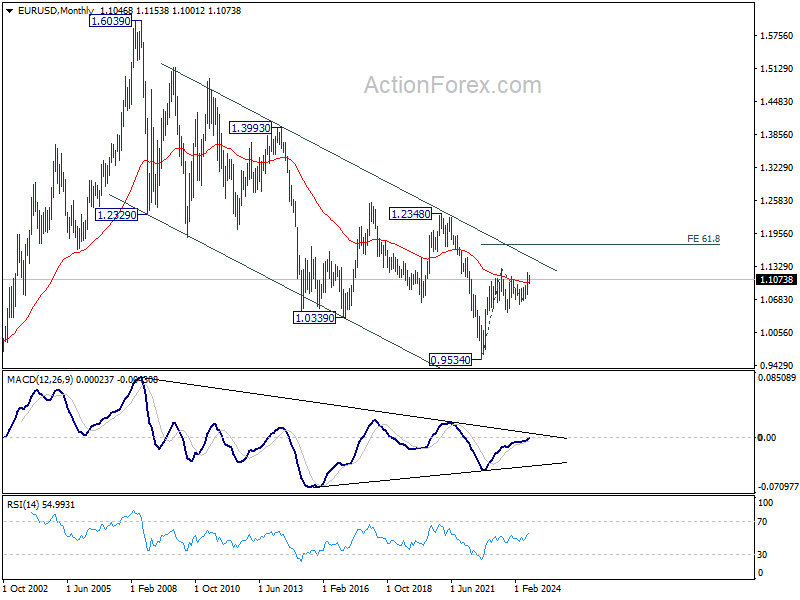
In the long term picture, a long term bottom is in place at 0.9534 (2022 low). The strong break of 55 M EMA (now at 1.1018) is taken as the first sign of bullish trend reversal. But still, firm break of 1.2348 structural resistance is needed to confirm. Otherwise, price actions from 0.9534 could still develop into a consolidation pattern.