Sample Category Title
EUR/USD Outlook: Euro Rises Further on Weaker Dollar
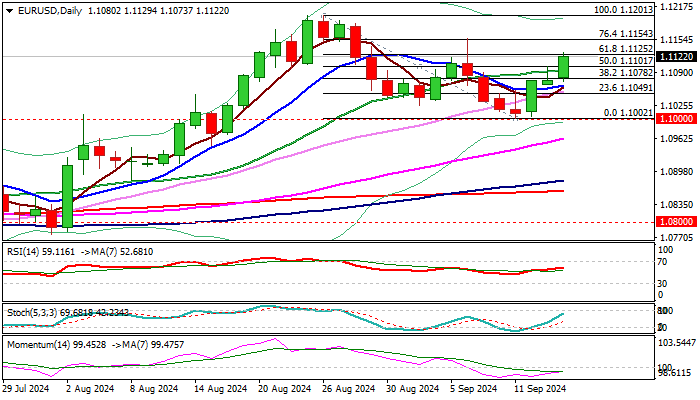
EURUSD rises for the third straight day, benefiting from weaker dollar on speculations of the magnitude of Fed’s rate cut on Wednesday.
Recovery leg from a higher base (formed after a double rejection just above psychological 1.10 support) retraced so far 61.8% of 1.1201/1.1002 pullback, adding to upside prospects.
Improved picture on daily chart (MA’s returned to bullish setup / RSI continues to head north above neutrality territory) supports the notion however, ascending 14-d momentum is still in negative territory and warning of potential recovery stall.
Daily close above Fibo 61.8% (1.1125) is needed to generate fresh bullish signal for attack at 1.1154 (Fibo 76.4% / Sep 6 spike high) break of which to neutralize downside risk and open way for full retracement of 1.1201/1.1002 correction.
Caution on failure at 1.1125 and return below 20DMA (1.1092) which would weaken near-term structure.
Res: 1.1129; 1.1154; 1.1184; 1.1201.
Sup: 1.1101; 1.1092; 1.1065; 1.1049.
GBPUSD Elliott Wave: Buying the Dips at the Blue Box Area
In this technical article we’re going to take a quick look at the Elliott Wave charts of GBPUSD Forex Pair , published in members area of the website. As our members know, GBPUSD has recently given us correction against the 1.2664 low. The pair reached our target zone and completed correction right at the Equal Legs ( Blue Box Area) . In further text we’re going to explain the Elliott Wave pattern and trading setup.
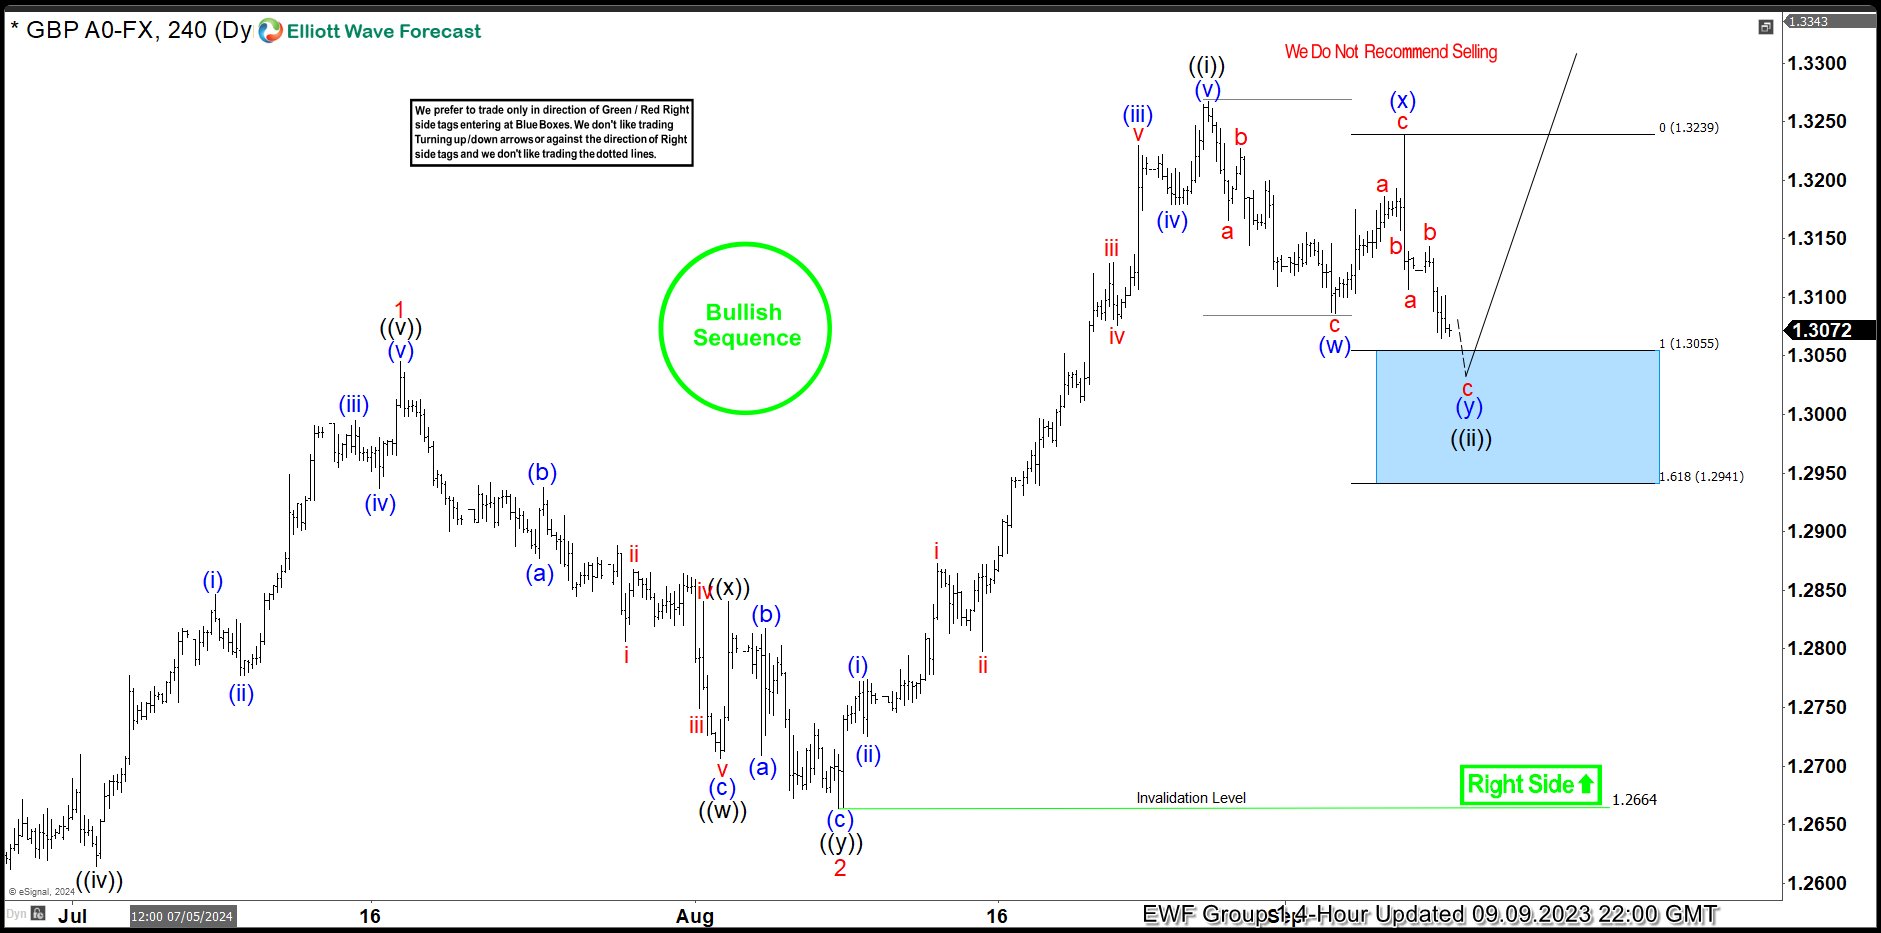
GBPUSD H4 Update 09.09.2024
GBPUSD is correcting cycle from the 1.2664 low. The pull back shows lower low structure. Current view suggests another push down toward the extreme zone ( Blue Box ). Despite the expected extension lower, we advise against selling GBPUSD at this stage. We expect it to attract buyers at the Blue Box zone. We can see either rally towards new highs or a larger corrective bounce in three waves at least. Once the bounce reaches the 50% Fibonacci retracement level against the connector high – (X) blue , we’ll secure our position by moving the stop-loss to breakeven. To safeguard our trade, we’ll closely monitor for any break below the marked invalidation level : 1.2941
A quick reminder:
Our charts are designed for simplicity and ease of trading:
Red bearish stamp + blue box = Selling Setup
Green bullish stamp + blue box = Buying Setup
Charts with Black stamps are deemed non-tradable. 🚫
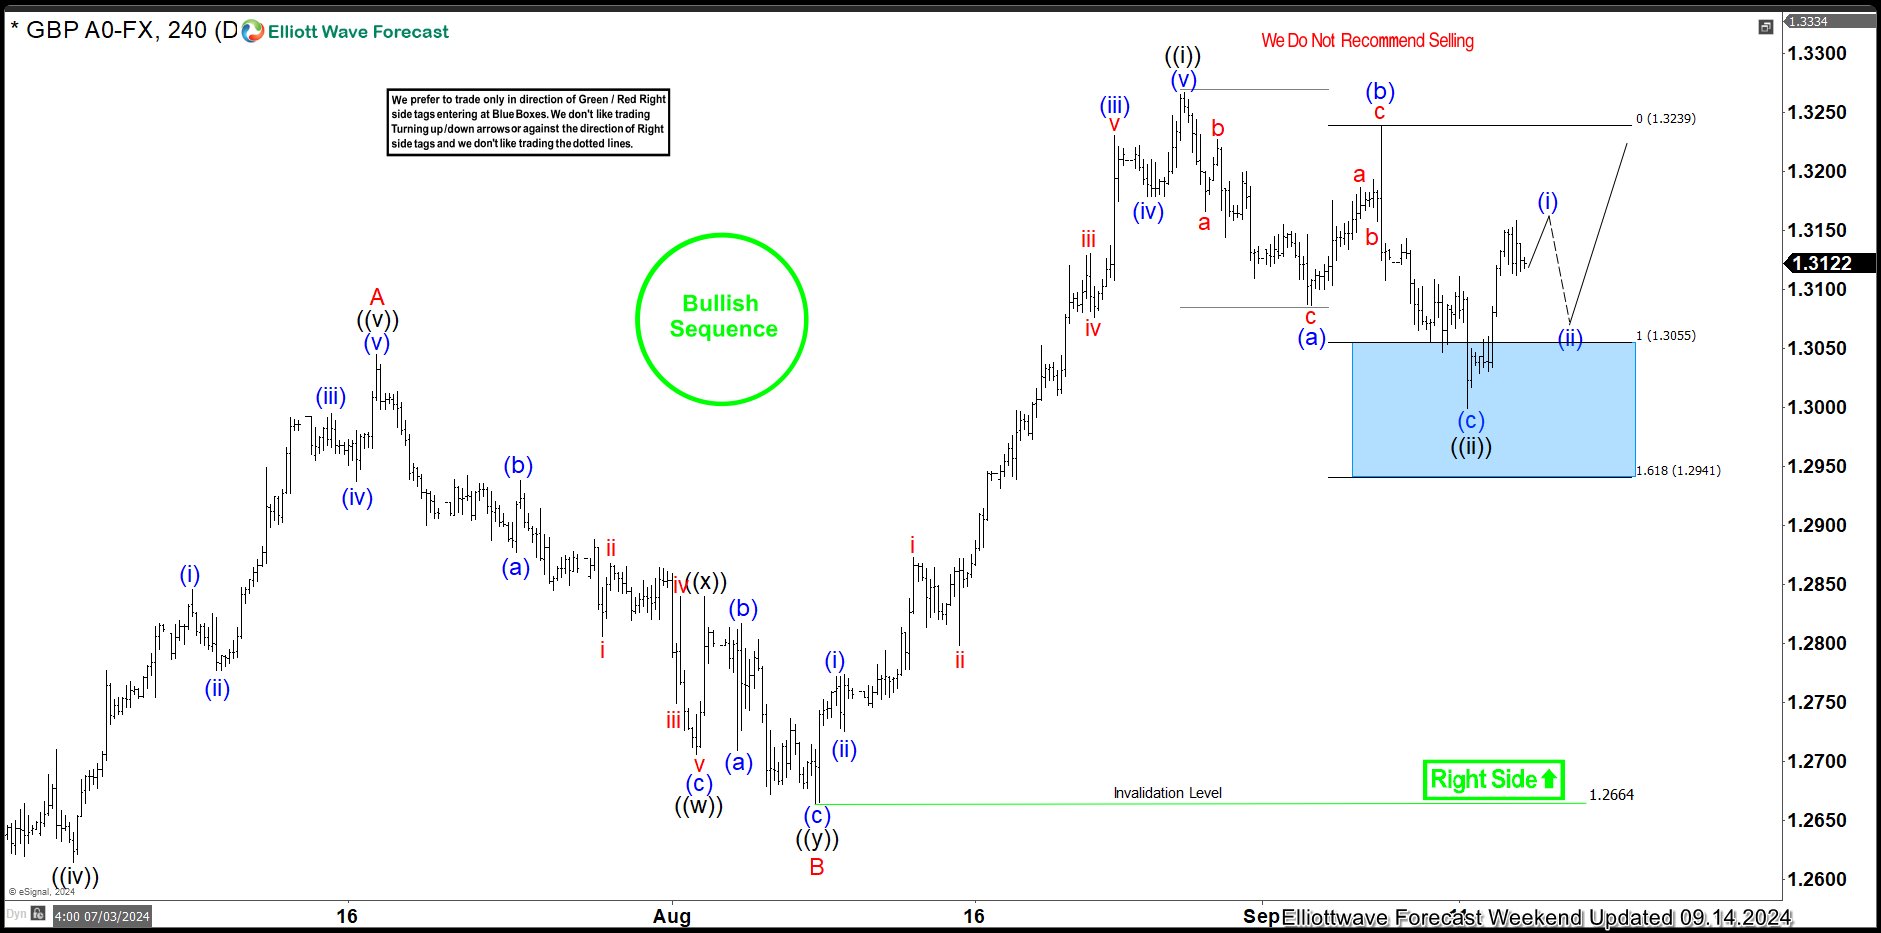
GBPUSD H4 Update 09.14.2024
The pair made another leg down and found buyers within the Blue Box area as expected. We got a nice rally from our buying zone, counting pull back completed at the 1.2999 low. The bounce has exceeded the 50% Fibonacci retracement level against the connector peak – (b) blue. As a result, traders who entered long positions are now enjoying risk-free profits. With the price holding above the 1.2999 low, we believe the next leg up can be in progress. For confirmation on the next leg up, we’re looking for a break above the ((i)) black high.
A New Local Peak in Crypto?
Market Picture
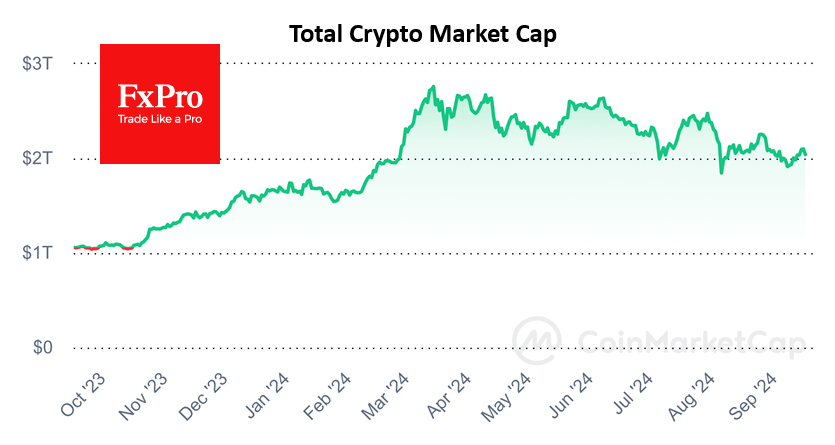
The crypto market started the weekend on a positive note but has been unable to sustain gains in recent days, losing 2.8% in the last 24 hours to reach a capitalisation of $2.04 trillion. This retreat from the $2.12 trillion area looks like a new lower local high, continuing the March series, with the potential to return below $2 trillion and consolidate there.
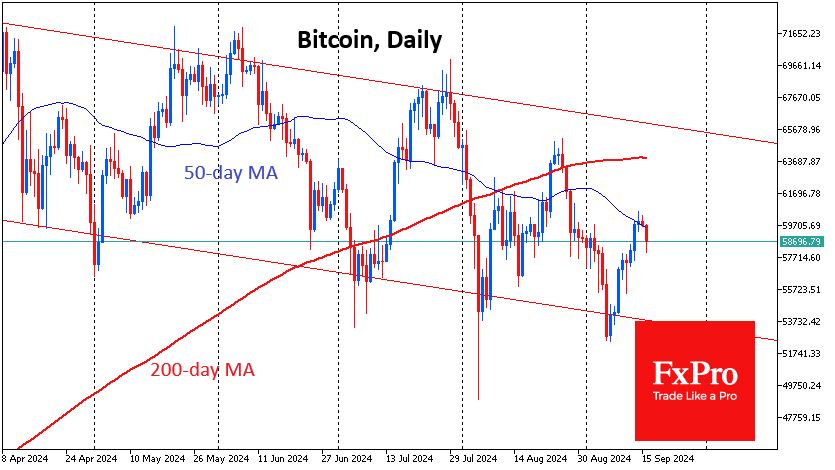
Bitcoin climbed above $60.5K on Saturday but failed to consolidate at this level, running into resistance in the form of the 50-day moving average. At the start of active trading in Europe, bitcoin was trading below $58.7K. It is not out of the question that the momentum of the short-term rally has run its course and that a fresh move towards the lower end of the trading range at $53K will take place. However, we do not expect the markets to make any significant moves until the Fed’s rate decision on Wednesday evening.
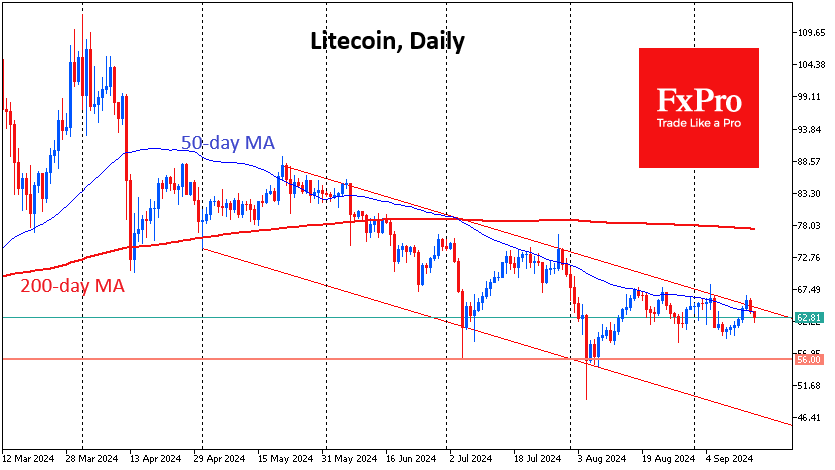
Litecoin has technically reversed from the upper boundary of the descending range that has been in place since May and from the 50-day moving average that has been acting as resistance all along. For the past month, the coin has found support near the $60 level, not far from the current $62.8. A break below this level could accelerate the sell-off. The ability to hold above will allow for a scenario of a break in the multi-month downtrend.
News Background
According to CryptoQuant, Ethereum traders’ sentiment requires a small push for the asset price to go into ‘parabolic’ growth. Such a scenario will become possible when the funding rate on ETH perpetual contracts exceeds 0.015%.
Coinbase attributes Ethereum’s underperformance to the current market structure combined with weakening on-chain metrics.
Bitfinex notes that altcoins remain relatively strong despite Bitcoin’s decline, which could be a sign that investors are reconsidering capital protection during market uncertainty.
MicroStrategy’s founder, Michael Saylor, said the company acquired an additional 18,300 BTCs for $1.11 billion (at $60,408 per coin). Thus, MicroStrategy’s total holdings are 244,800 BTC, acquired for approximately $9.45 billion ($38,585 per coin).
The consumer advocacy group Consumers’ Research released a report accusing Tether of a lack of transparency regarding its USD reserves. The report’s authors drew an analogy to the situation that led to the collapse of FTX and Alameda Research.
ECB’s Kazimir: December almost surely the decision point for next rate cut
ECB Governing Council member Peter Kazimir expressed his cautious stance regarding future rate cuts, noting in a blog post that “We will almost surely need to wait until December for a clearer picture before making our next move.”
Kazimir also underscored the importance of receiving a "significant shift" or a "powerful signal" in the economic outlook to support backing another cut in October.
However, "the fact is that very little new information is in the pipeline" before October meeting, he added.
The Governing Council member argued that it is essential for the central bank to ensure incoming data aligns with projections, warning that acting too quickly could lead to regret if inflation has not been sustainably brought under control.
Eurozone goods exports rises 10.2% yoy in Jul, imports up 4.0% yoy
Eurozone goods exports rose 10.2% yoy to EUR 252.0B in July. Goods imports rose 4.0% yoy to EUR 230.8B. Trade balance showed a EUR 21.2B surplus. Intra-Eurozone trade rose 4.3% yoy to EUR 221.0B.
In seasonally adjusted term, Eurozone goods exports rose 0.8% mom to EUR 239.0B. Goods imports rose 1.6% mom to EUR 223.5B. Trade surplus narrowed from June's EUR 17.0B to EUR 15.5B, smaller than expectation of EUR 20.3B. Intra-Eurozone trade rose 0.9% mom to EUR 21.4B.
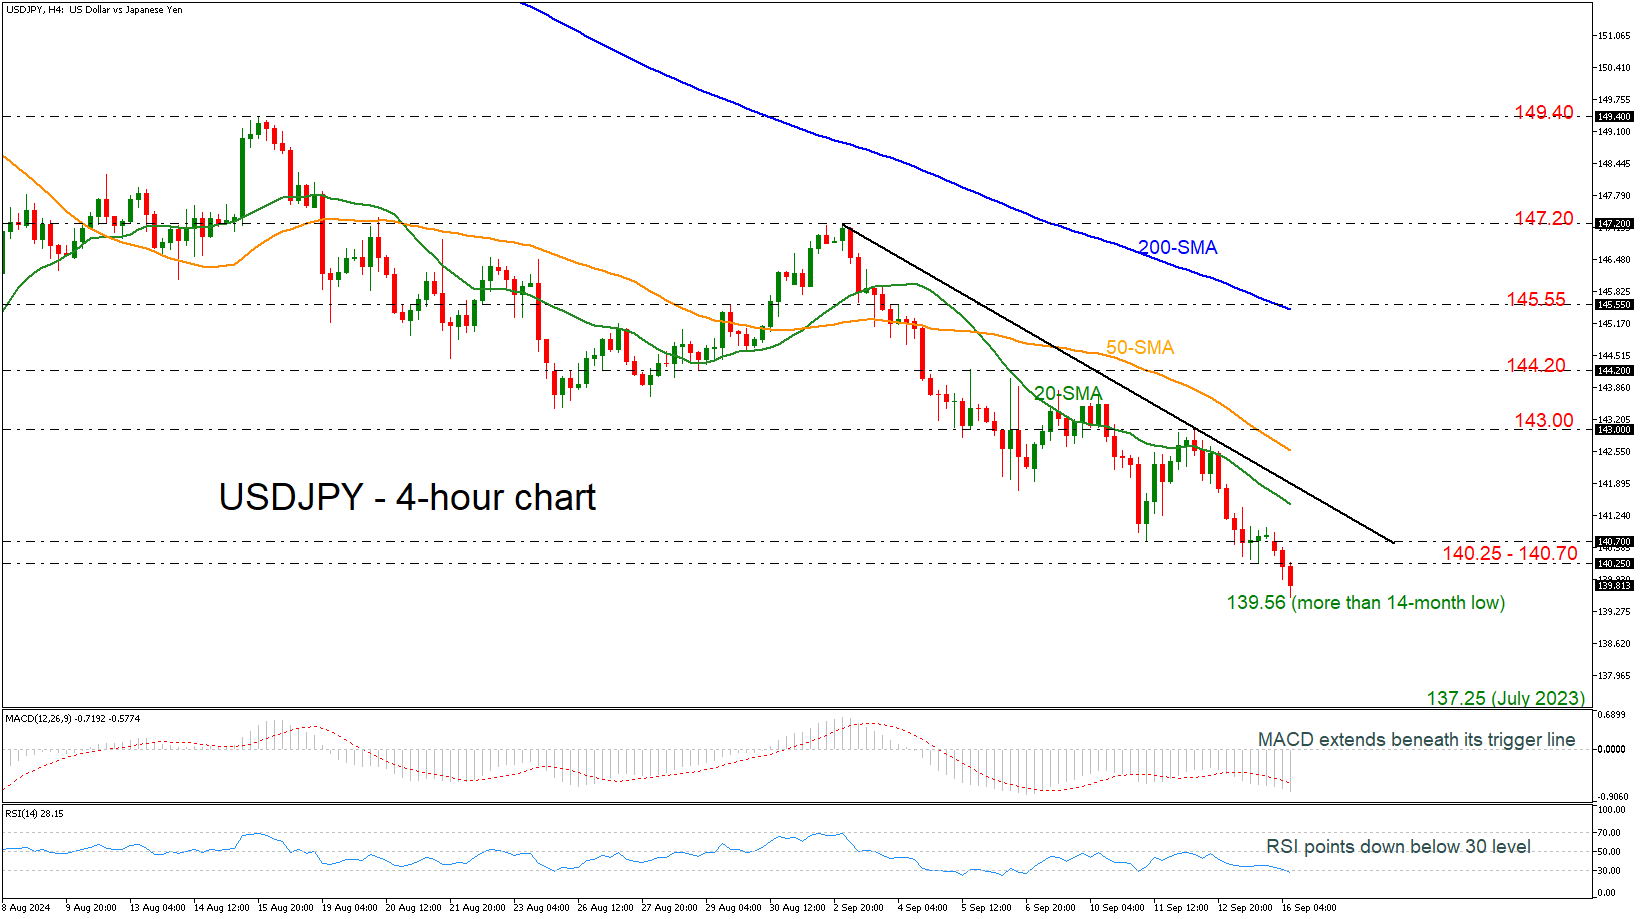
USDJPY Unlocks New 14-Month Low
- USDJPY dives below 140.70 key level
- Momentum oscillators continue downside pressure
USDJPY has declined considerably towards a new 14-month low of 139.56 earlier today, continuing the significant sell-off. The price has been in a bearish tendency since mid-August with the technical oscillators confirming the current move. The MACD oscillator is standing beneath its trigger and zero lines, while the RSI is crossing below the 30 level.
More downside pressures may drive the bears until the July 2023 trough of 137.25 before tumbling to the 133.00 psychological mark, registered in April 2023.
On the other hand, a climb above the restrictive region of 140.25 – 140.70 may open the way towards the 20-day simple moving average (SMA) at 141.45. Slightly higher, the short-term descending trend line at 141.70 may halt upside actions.
In brief, USDJPY has changed the short- and medium-term timeframes to bearish, especially after the break down below the 140.70 bottom.
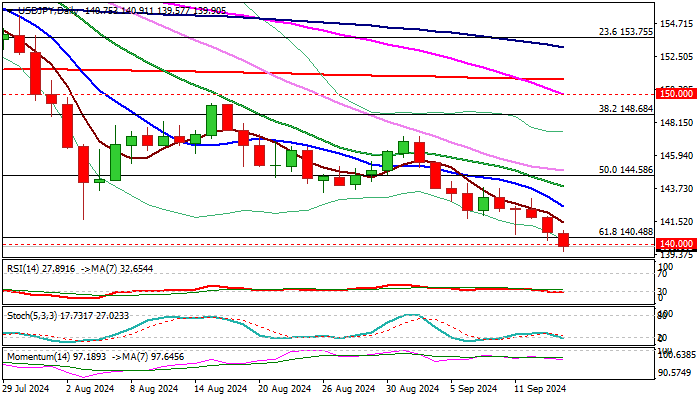
USD/JPY Falls to the Lowest in Over One Year After Violation of Key Supports
USDJPY fell to the lowest levels since July 2023 in early Monday trading as fresh acceleration lower broke pivotal supports at 140.77 (weekly cloud base) and 140.48/25 (Fibo 61.8% of 127.22/161.95 rally / Dec 28 low) and moved below psychological 140 support.
The dollar remains under pressure on firm expectations for Fed rate cut this week, with widely expected decision for 25 basis points cut however, more aggressive action for 50 basis points cut is still on the table and adds pressure on dollar.
On the other hand, signals that come from Japanese policymakers for further rate hikes (although the BoJ is expected to stay on hold in the policy meeting on Friday) fuel the story of widening gap between monetary policies of two central banks and provide fresh boost to Japanese yen.
Technical studies are firmly bearish on daily and weekly chart, suggesting that the pair may continue to travel south.
Daily close below 140 handle is needed to confirm signal and expose targets at 137.23 (July 2023 low) and 135.41 (Fibo 76.4%) in extension.
Meanwhile, oversold conditions on daily chart may provide fresh headwinds to larger bears, with consolidation / limited correction to mark positioning for fresh push lower.
Broken weekly cloud base reverted to solid resistance (141.15), followed by falling daily Tenkan-sen (142.56) which should ideally cap upticks.
Res: 140.00; 140.48; 141.15; 141.76.
Sup: 139.00; 138.06; 137.23; 135.41.
EUR/USD Gains as Fed Meeting Approaches
EUR/USD is showing signs of strengthening, currently trading around 1.1088 on Monday. The pair saw significant gains at the end of last week, driven by mounting speculation over the Federal Reserve's upcoming interest rate decision. The US dollar weakened in response to increasing expectations that the Fed might cut rates by 50 basis points in its forthcoming meeting.
The shift in market sentiment has been substantial, with the probability of a 50 basis point cut now at 45%, up from just 20% a week earlier. This anticipation has led to a decrease in US Treasury bond yields, further affecting the dollar's strength. Additionally, US import prices fell more than expected in August, decreasing by 0.3%, and export prices dropped by 0.7%. A sentiment index from the University of Michigan also showed an improvement in annual inflation expectations in September.
Conversely, the European Central Bank (ECB), which reduced its rate last week, continues to assert its independence. ECB President Christine Lagarde reiterated that the ECB operates free of political influence, responding to Italian demands for further rate reductions.
The upcoming Federal Reserve meeting, scheduled to start on Tuesday and conclude on Wednesday with a rate decision and commentary, is the focal point for markets this week. Investors are closely monitoring these developments, which could significantly impact the EUR/USD dynamics.
Technical analysis of EUR/USD
The EUR/USD market has established a consolidation range around 1.1088, extending down to 1.1073 and up to 1.1104. The market may potentially move downward to 1.1055 before possibly climbing to 1.1106, with a further stretch to 1.1128. The formation of a ‘Triangle’ technical pattern is considered likely. This scenario is supported by the MACD indicator, which is below zero but trending upward.
A growth wave to 1.1100 has been completed on the H1 chart. The market is currently forming a consolidation range around 1.1088, with a corrective structure down to 1.1073 followed by an emerging growth structure towards 1.1106. After reaching this level, a decline to 1.1055 may be considered. The Stochastic oscillator, currently below 80 and heading towards 20, supports this potential downward movement.
NZIER downgrades New Zealand’s growth forecast to flat in 2025, recovery delayed
New Zealand’s economic outlook has been notably downgraded by the New Zealand Institute of Economic Research (NZIER), with projections pointing to zero GDP growth for fiscal 2025, a stark revision from the previous forecast of 0.6%.
Growth is expected to pick up modestly to 2.2% in 2026 and further to 2.8% in 2027, though these estimates are also lower than those given earlier in the year. The institute’s June forecast had previously anticipated 2.4% growth in 2025 and 3.0% in 2026, highlighting the extent of the shift in expectations.
Inflation estimates have similarly been revised downward. CPI is now expected to come in at 2.3% for 2024, down from the 2.6% forecast in June. For 2025, CPI is projected at 2.0%, revised from the earlier estimate of 2.1%, while the 2026 forecast remains unchanged at 2.1%.
NZIER pointed to concerning signals from its own Quarterly Survey of Business Opinion, which has shown a sharp drop in business confidence and in firms' trading activity. This data suggests that the near-term outlook is particularly weak, with businesses expecting tougher conditions ahead. The slowdown is expected to persist through 2025, with lower interest rates forecasted to provide some support in stimulating a recovery beyond that.

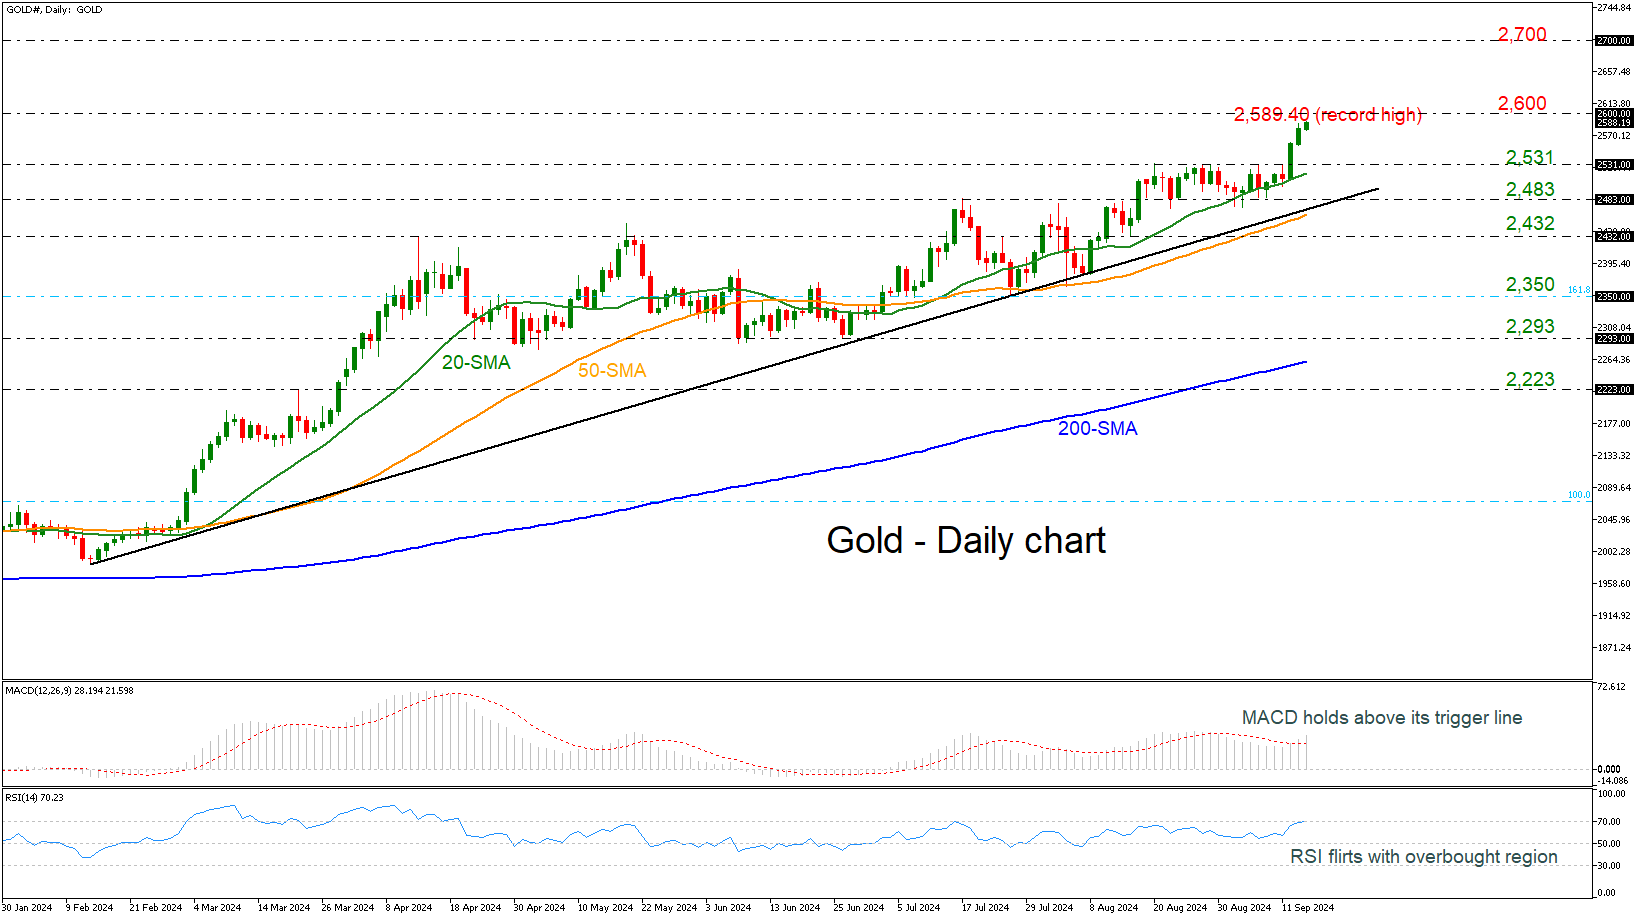
Gold Flies to Fresh All-Time High Near 2,600
- Gold posts bullish days
- Prices find support at 20-day SMA
- MACD and RSI in positive areas
Gold prices are skyrocketing to another fresh all-time high today around 2,589.40 with the next major obstacle coming from the 2,600 round number. The price has recorded an aggressive buying interest over the last couple of days after the strong bounce off the 20-day simple moving average (SMA) at 2,510.
Technically, the MACD oscillator is extending its upside move above its trigger and zero lines, while the RSI is trying to overcome the 70 level. Both are confirming the sharp bullish momentum in price.
Immediate resistance is coming from the 2,600 and 2,700 psychological mark ahead of the 261.8% Fibonacci extension level at 2,800, of the down leg from the peak in March 2022 at 2,070 and the low in October 2022 at 1,616.
In the negative scenario, a decline beneath the 2,531 support may send traders to the 20-day SMA at 2,518 before resting near the long-term ascending trend line around 2,483. Also, the 50-day SMA lies near the previous level and any break below that could switch the outlook to a neutral one.
To summarize, the precious metal looks strongly positive with a new all-time high today and as long as it stands above the 200-day SMA, the outlook could remain bullish.