Sample Category Title
AUD/USD Daily Report
Daily Pivots: (S1) 0.6631; (P) 0.6699; (R1) 0.6738; More...
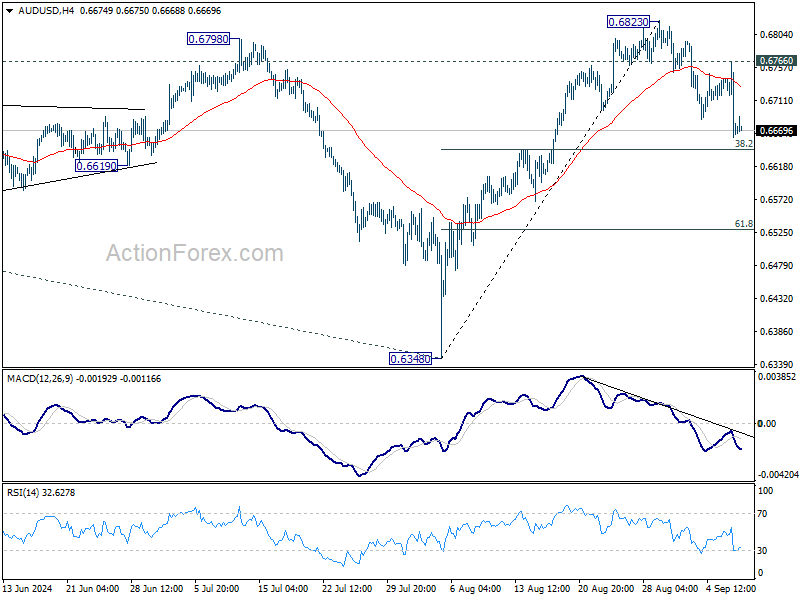
Intraday bias in AUD/USD remains mildly on the downside at this point. Fall from 0.6823 short term top would target 38.2% retracement of 0.6348 to 0.6823 at 0.6642. Break will target 61.8% retracement at 0.6529. On the upside, though, above 0.6766 resistance will bring retest of 0.6823 instead.
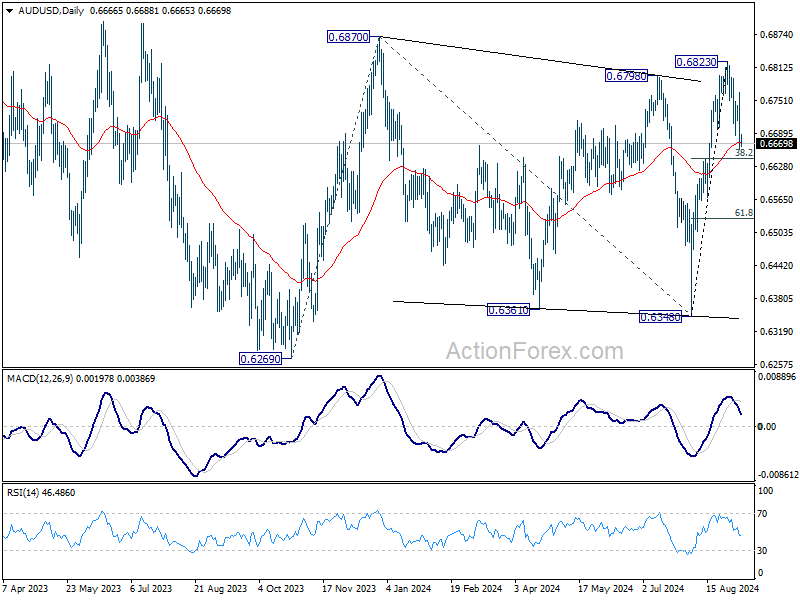
In the bigger picture, overall, price actions from 0.6169 (2022 low) are seen as a medium term corrective pattern, with rise from 0.6269 as the third leg. Firm break of 0.6798/6870 resistance zone will target 0.7156 resistance. In case of another fall, strong support should be seen from 0.6169/6361 to bring rebound.
EUR/USD Daily Outlook
Daily Pivots: (S1) 1.1049; (P) 1.1102; (R1) 1.1138; More....
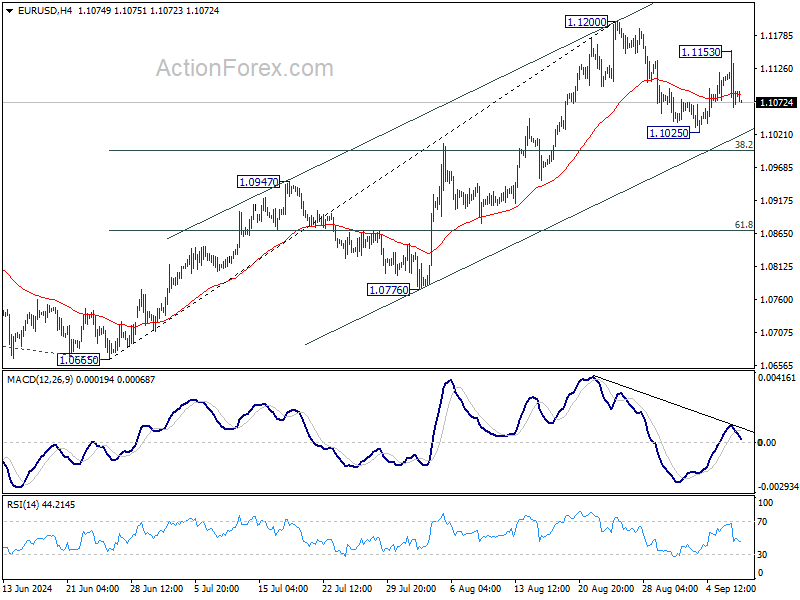
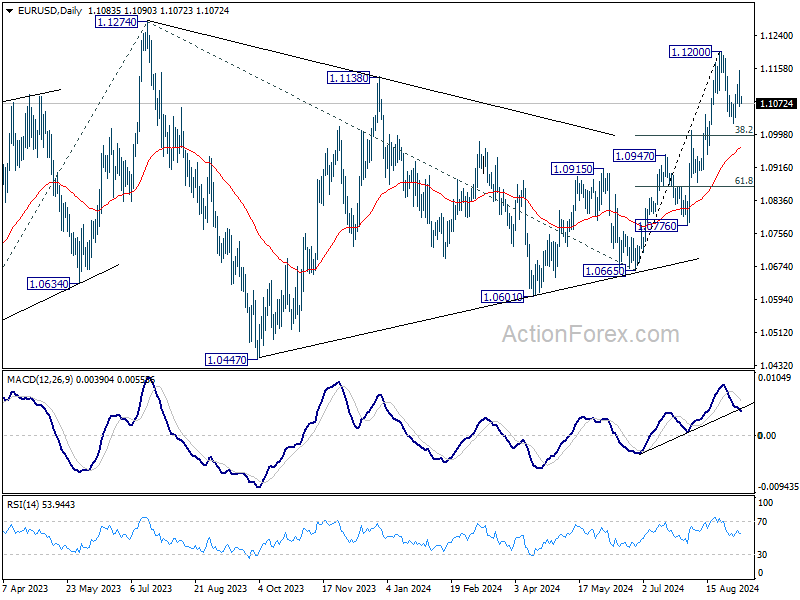
Intraday bias in EUR/USD remains neutral for the moment, and consolidation from 1.1200 could extend further. In case of deeper retreat, downside should be contained by 38.2% retracement of 1.0665 to 1.1200 at 1.0996 to bring rebound. Break of 1.1200 will resume larger rise towards 1.1274 high. However, sustained break of 1.0996 will indicate reversal and turn bias to the downside.
In the bigger picture, prior break of 1.1138 resistance indicates that corrective pattern from 1.1274 might have completed at 1.0665 already. Decisive break of 1.1274 (2023 high) will confirm whole up trend from 0.9534 (2022 low). Next target will be 61.8% projection of 0.9534 to 1.1274 from 1.0665 at 1.1740. This will now be the favored case as long as 1.0947 resistance turned support holds.
GBP/USD Daily Outlook
Daily Pivots: (S1) 1.3078; (P) 1.3158; (R1) 1.3207; More...
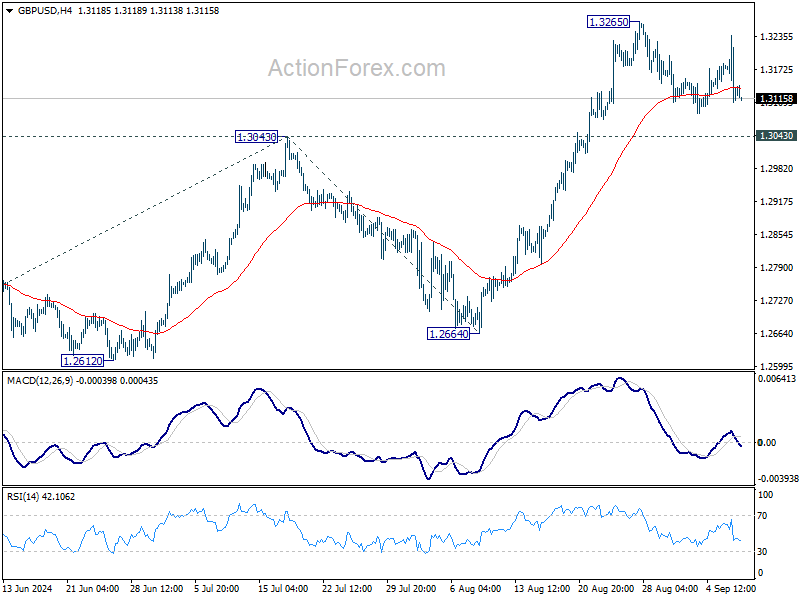
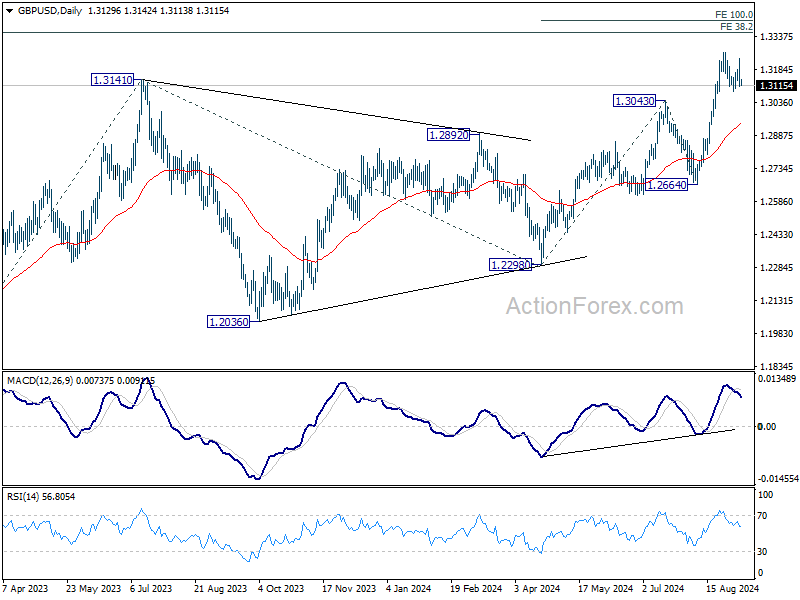
Intraday bias in GBP/USD remains neutral as consolidation from 1.3265 is still extending. Outlook will stay bullish as long as 1.3043 resistance turned support holds. On the upside, firm break of 1.3265 will resume larger up trend to 100% projection of 1.2298 to 1.3043 from 1.2664 at 1.3409. However, firm break of 1.3043 will turn bias back to the downside for deeper pullback.
In the bigger picture, up trend from 1.0351 (2022 low) is in progress. Next target is 38.2% projection of 1.0351 to 1.3141 from 1.2298 at 1.3364. For now, outlook will stay bullish as long as 1.2664 support holds, even in case of deep pullback.
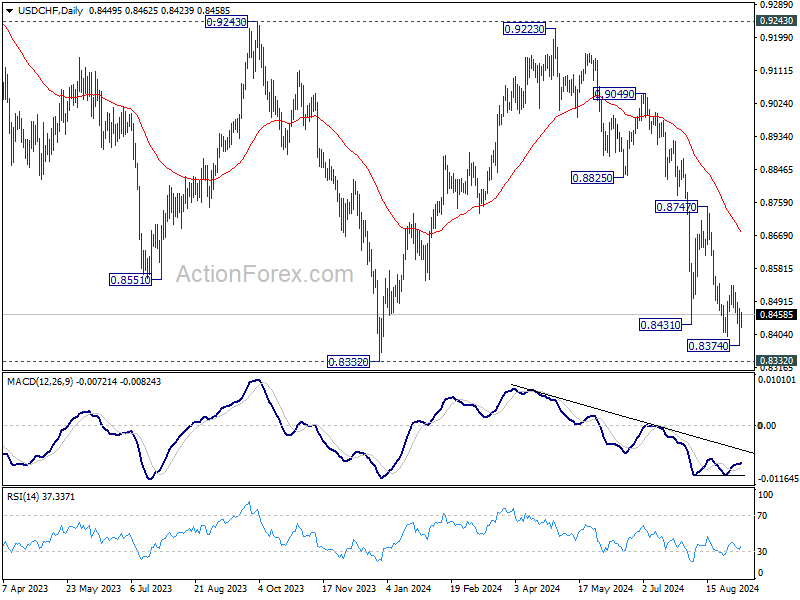
USD/CHF Daily Outlook
Daily Pivots: (S1) 0.8379; (P) 0.8428; (R1) 0.8480; More…
Intraday bias in USD/CHF is turned neutral with 4H MACD crossed above signal line. But further decline will remain in favor as long as 0.8536 resistance holds. Below 0.8374 will resume the fall from 0.9223 to retest 0.8332 low. Decisive break there will indicate larger down trend resumption. However, considering bullish convergence condition in 4H MACD, break of 0.8536 resistance will now confirm short term bottoming, and turn bias back to the upside for 0.8747 resistance.
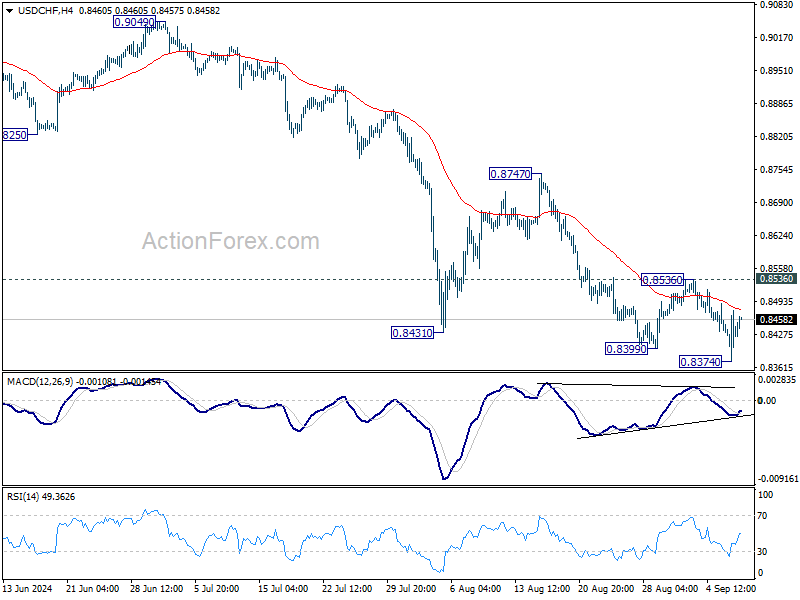
In the bigger picture, price actions from 0.8332 (2023 low) are currently seen as a medium term corrective pattern, with fall from 0.9223 as the second leg. Strong support could be seen from 0.8332 to bring rebound. Yet, overall outlook will continue to stay bearish as long as 0.9243 resistance holds. Firm break of 0.8332, however, will resume larger down trend from 1.0146 (2022 high).
USD/JPY Daily Outlook
Daily Pivots: (S1) 141.42; (P) 142.66; (R1) 143.54; More...
Intraday bias in USD/JPY remains on the downside with focus on 141.67 support. Firm break there will resume whole decline from 161.95 high, for 140.25 support next. On the upside, above 144.22 minor resistance will turn intraday bias neutral first. But risk will stay on the downside as long as 147.20 resistance holds, in case of recovery.
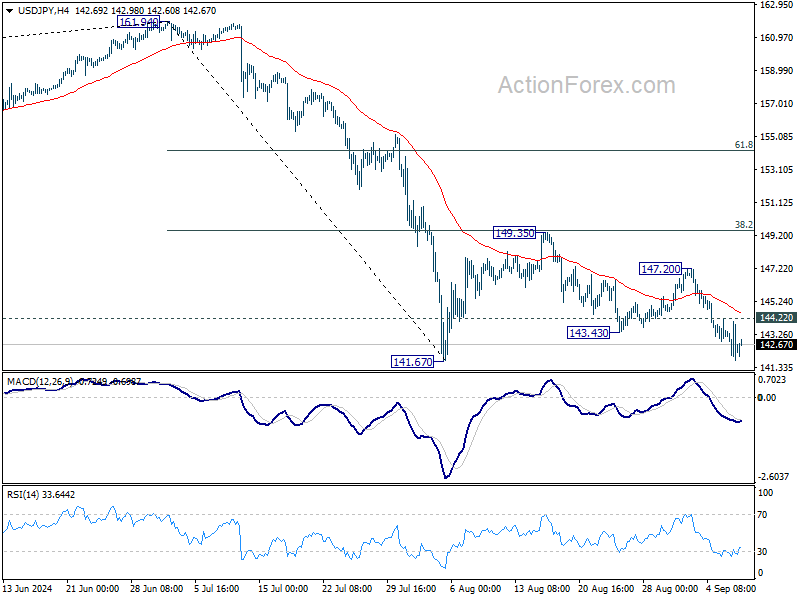
In the bigger picture, fall from 161.94 medium term top is seen as correcting whole up trend from 102.58 (2021 low). Deeper decline could be seen to 38.2% retracement of 102.58 to 161.94 at 139.26, which is close to 140.25 support. In any case, risk will stay on the downside as long as 55 W EMA (now at 149.21) holds. Nevertheless, firm break of 55 W EMA will suggest that the range for medium term corrective pattern is already set.
Forex Unmoved by Asian Selloff, Traders Cautious Ahead of US CPI, UK Data, and ECB Rate Cut
Asian markets started the week on a weak note, with sharp declines following the broader selloff in US markets after last week’s non-farm payroll report. Adding to the bearish mood was weaker-than-expected inflation data from China, which dampened sentiment further. However, the reaction in the forex market has been somewhat muted, with commodity-linked currencies, like the Australian and New Zealand Dollars, showing slight recoveries after last week’s declines. Meanwhile, traditional safe-haven currencies, such as Yen and Swiss Franc, have softened modestly. With little on the economic calendar today, trading is expected to remain subdued as investors wait for more clarity later in the week.
Traders are likely to adopt a more cautious stance as they await several key events later in the week, which could spark significant market volatility. US CPI release on Wednesday is the main event, as it could shape Fed's move at the start of its rate-cutting cycle this month. At the same time, UK employment data due on Tuesday and GDP on Wednesday, will be closely monitored. Adding to the mix, ECB is widely expected to cut interest rates on Thursday.
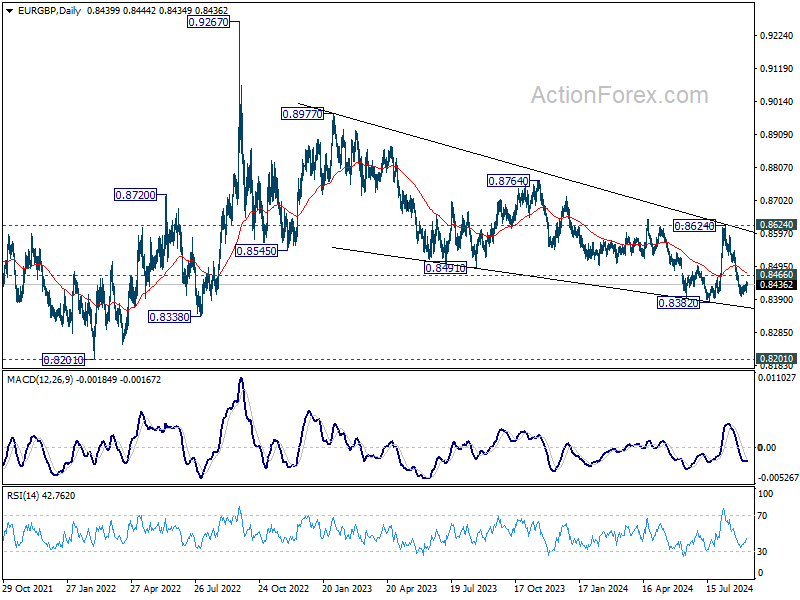
A pair to watch closely during this period is EUR/GBP. With significant events coming from both the Eurozone and the UK, this currency pair is likely to experience heightened volatility. Technically, while EUR/GBP recovered ahead of 0.8382 low, momentum has been very weak so far. Outlook will stay bearish as long as 0.8466 minor resistance holds. Retest of 0.8382 should be seen next, and firm break there will resume larger down trend from 0.9267 (2022 high).
In Asia, at the time of writing, Nikkei is down -2.14%. Hong Kong HSI is down -1.86%. China Shanghai SSE is down -0.93%. Singapore Strait Times is up 0.76%. Japan 10-year JGB yield is up 0.0438 at 0.894.
China's CPI inches up to 0.6% yoy in Aug, but deflationary pressures persist as PPI declines again
China's inflation data for August showed a slight rise in consumer prices, but deflationary pressures continue to weigh on the economy. CPI increased from 0.5% yoy in July to 0.6% yoy, falling short of market expectations of 0.7% yoy.
Food prices saw a notable rise, jumping 2.8% yoy, driven by a 16.1% yoy surge in pork prices and a 21.8% yoy increase in vegetable prices. However, non-food inflation eased significantly, dropping from 0.7% yoy to just 0.2%. Core CPI also fell slightly, rising only 0.3% yoy compared to 0.4% yoy in July.
On a month-over-month basis, China's CPI rose by 0.4% mom , following a 0.5% mom increase in the prior month. While positive, this figure also came in below expectations of 0.5% mom.
Producer prices, on the other hand, extended their negative streak for the 23rd consecutive month. PPI fell from -0.8% yoy in July to -1.8% yoy in August, worse than the anticipated decline of -1.4% yoy.
This persistent deflation in factory-gate prices is being attributed to weak market demand and a continued decline in international commodity prices, according to NBS statistician Dong Lijuan.
Dong also noted that the slight rise in consumer prices in August was largely influenced by seasonal factors, such as high temperatures and rainfall, which boosted food prices.
However, the underlying weakness in both consumer and producer prices points to broader structural issues in China's economy. Economists warn that the ongoing deflationary pressures are a result of production outpacing demand, contributing to a growing surplus and continued challenges for the manufacturing sector.
Copper weakness deepens, adding pressure on Aussie
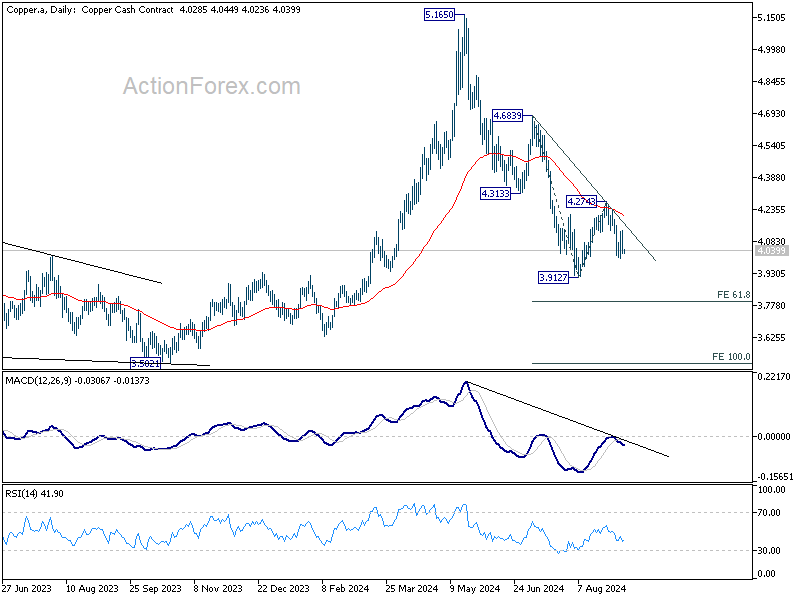
Spot copper prices fell notably last week after Goldman Sachs abandoned its long-standing bullish position. The ongoing decline in the metal, which has been steadily falling since May, is now facing further downside pressure, a trend that could weigh heavily on the Australian Dollar given the country's commodity-linked economy.
Goldman Sachs made waves by slashing its 2025 copper price forecast by nearly a third, citing weaker-than-expected demand outlook in China. Previously, the bank had projected that copper would reach USD 15k per tonne next year. That forecast has now been downgraded to just USD 10.1k. The bank noted that softer demand for commodities and increasing downside risks to China's economy required a "more selective and less constructive" view of the broader commodities market.
Technically, spot copper's price action also supports this bearish outlook. Rebound from 3.9127 appears to have topped out at 4.2743, where it was rejected by the falling 55 D EMA, an bearish indication that the market is gearing up for further declines. As long as 4.2743 resistance level holds, risk remains skewed to the downside. Firm Break of 3.9127 will resume whole fall from 5.1650 to 61.8% projection of 4.6839 to 3.9127 from 4.2743 at 3.7977 next.
The outlook for the Australian Dollar is closely linked to these developments. With copper facing continued weakness, the AUD is likely to come under additional pressure.
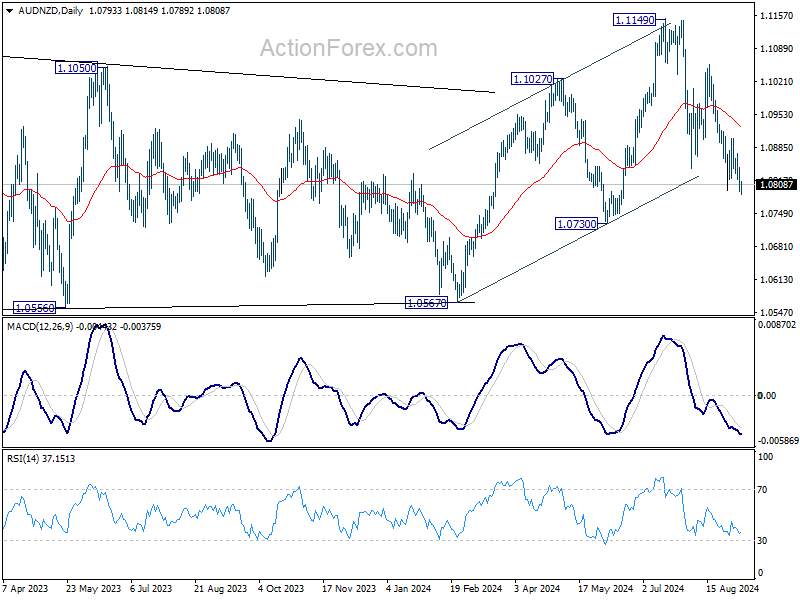
AUD/NZD has been on a downtrend since July, with only a brief recovery following the unexpected rate cut by RBNZ in mid-August. For now, further fall is expected as long as 55 D EMA (now at 1.0930) holds. Next target is 1.0730. Some support could be found there to form a bottom. However, decisive break of 1.0730 will pave the way back to 1.0567 key support.
ECB set for rate cut, US CPI to shape Fed’s next move (hopefully)
With ECB set to meet, inflation data on the docket for the US, and critical job and GDP numbers out of the UK, this week’s will play a key role in shaping market sentiment and currency market movements.
ECB is widely expected to announce a 25bps rate cut at its meeting, the second such reduction in its current easing cycle. This would bring the main refinancing rate down to 4.00% and the deposit rate to 3.50%. ECB has long signaled that September would be a critical month for policy changes, given the updated economic projections and comprehensive set of data released.
With inflation slowing to 2.2% in August and economic activity weakening, ECB is given the greenlight to move again. However, negotiated wage growth, while slowing from 4.74% to 3.55% in Q2, remains elevated, which may keep ECB from committing to additional cuts in the near future. A recent Reuters poll suggests that 64 of 77 economists expect another 25bps cut in December, but this will depend on how economic data evolves in the coming months.
In the US, focus will be on August's CPI data. After last week's non-farm payroll report left markets uncertain about whether Fed will opt for a 25 or 50bps rate cut this month, traders are hoping the CPI numbers will provide a clearer picture. Headline inflation is projected to slow to 2.6%, its lowest level since March 2021, down from 2.9%. However, core inflation is expected to hold steady at 3.2%, potentially complicating Fed's decision. Should core inflation prove sticky, the Fed may opt for a cautious 25bps cut, which could further heighten risk-off sentiment in an already volatile market environment.
In the UK, job data and GDP numbers will be in focus ahead of the BoE's rate decision on September 19. However, most MPC members are unlikely to take a firm stance until they see the CPI figures due on September 18. At present, markets are leaning toward BoE skipping a rate cut this month, deferring until November when new economic forecasts are available. However, any sharp deterioration in employment or growth data could push BoE toward more immediate action.
Here are some highlights for the week:
- Monday: Japan GDP final, current account, bank lending; China CPI, PPI; Eurozone Sentix investor confidence.
- Tuesday: New Zealand manufacturing sales; Japan M2 machine tool orders; Australia Westpac consumer sentiment, NAB business confidence; China trade balance; Germany CPI final; UK employment; US NFIB small business index.
- Wednesday: UK GDP, , production, trade balance; US CPI.
- Thursday: Japan BSI manufacturing, PPI; ECB rate decision; Canada building permits; US PPI, jobless claims.
- Friday: New Zealand BNZ manufacturing; Eurozone industrial production; Canada wholesale sales; US U of Michigan consumer sentiment.
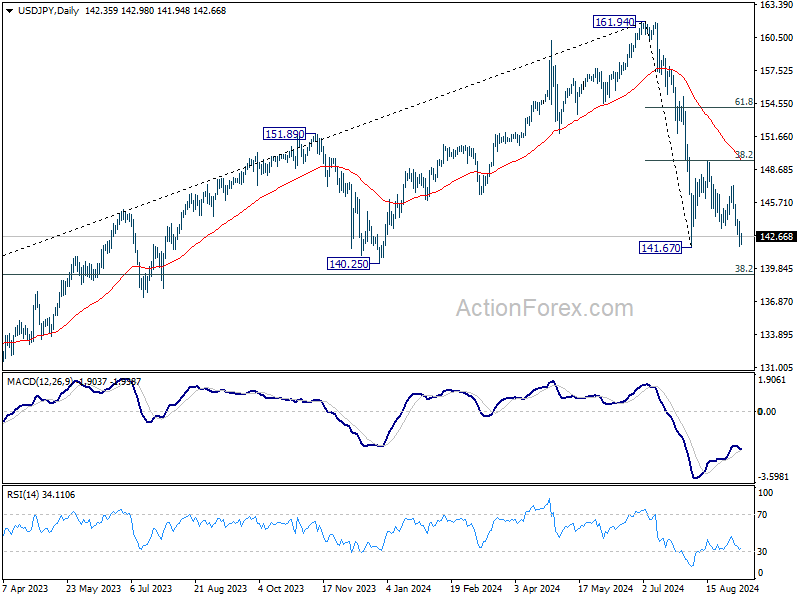
USD/JPY Daily Outlook
Daily Pivots: (S1) 141.42; (P) 142.66; (R1) 143.54; More...
Intraday bias in USD/JPY remains on the downside with focus on 141.67 support. Firm break there will resume whole decline from 161.95 high, for 140.25 support next. On the upside, above 144.22 minor resistance will turn intraday bias neutral first. But risk will stay on the downside as long as 147.20 resistance holds, in case of recovery.
In the bigger picture, fall from 161.94 medium term top is seen as correcting whole up trend from 102.58 (2021 low). Deeper decline could be seen to 38.2% retracement of 102.58 to 161.94 at 139.26, which is close to 140.25 support. In any case, risk will stay on the downside as long as 55 W EMA (now at 149.21) holds. Nevertheless, firm break of 55 W EMA will suggest that the range for medium term corrective pattern is already set.
Economic Indicators Update
| GMT | Ccy | Events | Actual | Forecast | Previous | Revised |
|---|---|---|---|---|---|---|
| 23:50 | JPY | Bank Lending Y/Y Aug | 3.00% | 3.20% | 3.20% | |
| 23:50 | JPY | Current Account (JPY) Jul | 2.80T | 2.10T | 1.78T | |
| 23:50 | JPY | GDP Q/Q Q2 F | 0.70% | 0.80% | 0.80% | |
| 23:50 | JPY | GDP Deflator Y/Y Q2 F | 3.20% | 3.00% | 3.00% | |
| 01:30 | CNY | CPI Y/Y Aug | 0.60% | 0.70% | 0.50% | |
| 01:30 | CNY | PPI Y/Y Aug | -1.80% | -1.40% | -0.80% | |
| 05:00 | JPY | Eco Watchers Survey: Current Aug | 47.6 | 47.5 | ||
| 08:30 | EUR | Eurozone Sentix Investor Confidence Sep | -11.7 | -13.9 | ||
| 14:00 | USD | Wholesale Inventories Jul F | 0.30% | 0.30% |
Copper weakness deepens, adding pressure on Aussie
Spot copper prices fell notably last week after Goldman Sachs abandoned its long-standing bullish position. The ongoing decline in the metal, which has been steadily falling since May, is now facing further downside pressure, a trend that could weigh heavily on the Australian Dollar given the country's commodity-linked economy.
Goldman Sachs made waves by slashing its 2025 copper price forecast by nearly a third, citing weaker-than-expected demand outlook in China. Previously, the bank had projected that copper would reach USD 15k per tonne next year. That forecast has now been downgraded to just USD 10.1k. The bank noted that softer demand for commodities and increasing downside risks to China's economy required a "more selective and less constructive" view of the broader commodities market.
Technically, spot copper's price action also supports this bearish outlook. Rebound from 3.9127 appears to have topped out at 4.2743, where it was rejected by the falling 55 D EMA, an bearish indication that the market is gearing up for further declines. As long as 4.2743 resistance level holds, risk remains skewed to the downside. Firm Break of 3.9127 will resume whole fall from 5.1650 to 61.8% projection of 4.6839 to 3.9127 from 4.2743 at 3.7977 next.
The outlook for the Australian Dollar is closely linked to these developments. With copper facing continued weakness, the AUD is likely to come under additional pressure.
AUD/NZD has been on a downtrend since July, with only a brief recovery following the unexpected rate cut by RBNZ in mid-August. For now, further fall is expected as long as 55 D EMA (now at 1.0930) holds. Next target is 1.0730. Some support could be found there to form a bottom. However, decisive break of 1.0730 will pave the way back to 1.0567 key support.
China’s CPI inches up to 0.6% yoy in Aug, but deflationary pressures persist as PPI declines again
China's inflation data for August showed a slight rise in consumer prices, but deflationary pressures continue to weigh on the economy. CPI increased from 0.5% yoy in July to 0.6% yoy, falling short of market expectations of 0.7% yoy.
Food prices saw a notable rise, jumping 2.8% yoy, driven by a 16.1% yoy surge in pork prices and a 21.8% yoy increase in vegetable prices. However, non-food inflation eased significantly, dropping from 0.7% yoy to just 0.2%. Core CPI also fell slightly, rising only 0.3% yoy compared to 0.4% yoy in July.
On a month-over-month basis, China's CPI rose by 0.4% mom , following a 0.5% mom increase in the prior month. While positive, this figure also came in below expectations of 0.5% mom.
Producer prices, on the other hand, extended their negative streak for the 23rd consecutive month. PPI fell from -0.8% yoy in July to -1.8% yoy in August, worse than the anticipated decline of -1.4% yoy.
This persistent deflation in factory-gate prices is being attributed to weak market demand and a continued decline in international commodity prices, according to NBS statistician Dong Lijuan.
Dong also noted that the slight rise in consumer prices in August was largely influenced by seasonal factors, such as high temperatures and rainfall, which boosted food prices.
However, the underlying weakness in both consumer and producer prices points to broader structural issues in China's economy. Economists warn that the ongoing deflationary pressures are a result of production outpacing demand, contributing to a growing surplus and continued challenges for the manufacturing sector.
EUR/USD Faces Challenges: Can It Break To New Gains?
Key Highlights
- EUR/USD is facing hurdles near the 1.1120 and 1.1140 levels.
- A major contracting triangle is forming with support at 1.1060 on the 4-hour chart.
- GBP/USD is consolidating gains above the 1.3050 level.
- Oil prices extended losses below the $70.00 support.
EUR/USD Technical Analysis
The Euro started another increase from the 1.1025 support against the US Dollar. EUR/USD gained pace for a move above 1.1100 but struggled near 1.1150.
Looking at the 4-hour chart, the pair failed to clear the 61.8% Fib retracement level of the downward move from the 1.1201 swing high to the 1.1026 low. There was a sharp bearish reaction, and the pair trimmed some gains.
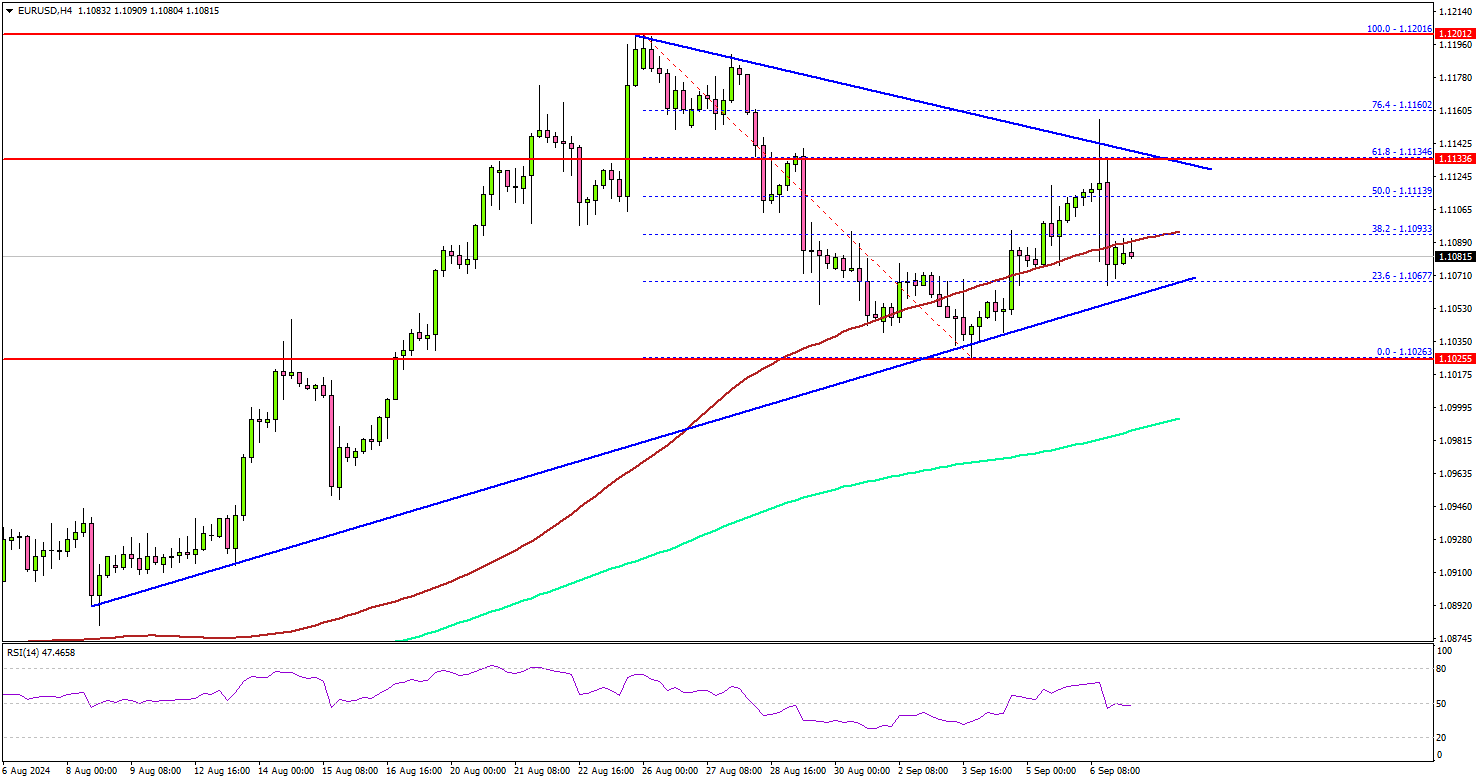
There was a drop below the 1.1100 and the 100 simple moving average (red, 4-hour), but it stayed above the 200 simple moving average (green, 4-hour). On the downside, immediate support sits near the 1.1050 level.
There is also a major contracting triangle forming with support at 1.1060 on the same chart. The next key support sits near the 1.1020 level.
The main support is now forming near 1.0980. A downside break below the 1.0980 level could set the pace for a larger decline. The next major support is near the 1.0920 level.
On the upside, the pair could face resistance near the 1.1120 level. The next key resistance sits near the 1.1140 level and the triangle’s upper trend line. A clear move above the 1.1140 level could set the pace for a move toward the 1.1200 zone. Any more gains might call for a test of the 1.1250 zone.
Looking at GBP/USD, the pair trimmed some gains, traded below 1.3150, and is now consolidating above the 1.3050 level.
Upcoming Economic Events:
- Euro Zone Sentix Investor Confidence for Sep 2024 - Forecast -13.0, versus -13.9 previous.
EURCAD Wave Analysis
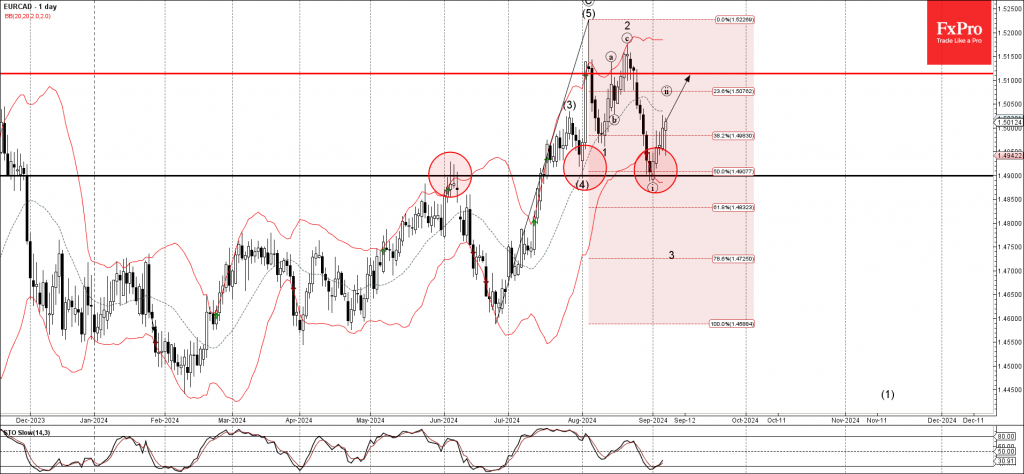
- EURCAD reversed from pivotal support level 1.4900
- Likely to rise to resistance level 1.5100
EURCAD currency pair recently reversed from the pivotal support level 1.4900 (a former monthly high from July, which stopped the previous correction (4)).
The support level 1.4900 was strengthened by the lower daily Bollinger Band and by the 50% Fibonacci correction of the upward impulse from June.
Given the clear daily uptrend and the bearish Canadian dollar sentiment seen across the FX markets today, EURCAD currency pair can be expected to rise further to the next resistance level 1.5100.