Sample Category Title
Is EUR/USD Vulnerable Ahead of ECB Meeting…? DXY to Play a Major Role
- The US Dollar Index (DXY) has rebounded since Friday’s jobs data release, driven by altered rate cut expectations.
- EUR/USD is particularly affected by the DXY recovery, with the Euro’s recent strength potentially waning due to poor German data and shifting rate cut expectations.
- The DXY’s technical analysis suggests further upside potential, with immediate resistance at 102.16 and 102.60.
The US Dollar Index (DXY) has seen a stark turnaround since the jobs data release on Friday. The immediate aftermath left the US Dollar reeling as the DXY looked set to print fresh lows. However, as the data was digested and market participants altered their rate cut expectations, the DXY roared to life and has continued that recovery to start the week.
US Federal Reserve Interest Rate Policy Probability
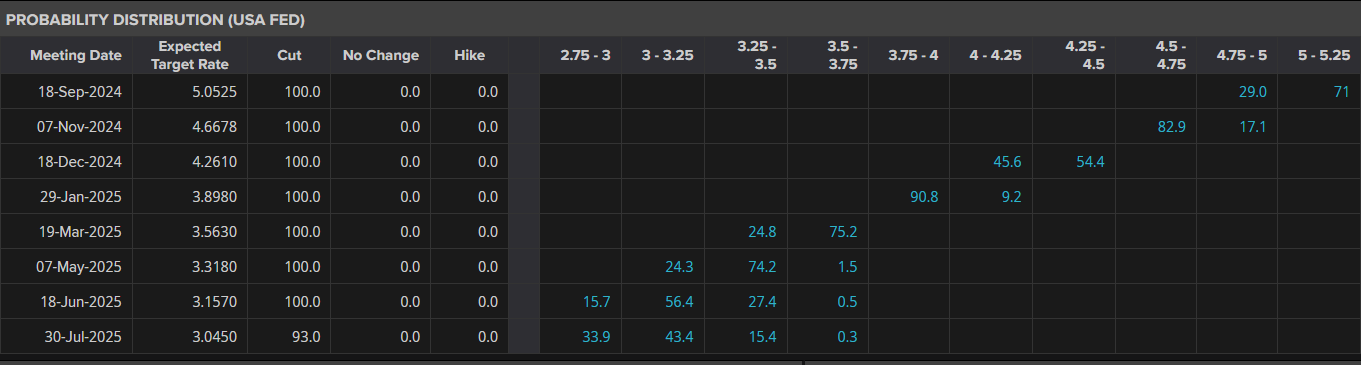
Source: LSEG (click to enlarge)
Looking at FX pairs and the one that grabs my attention the most is EUR/USD which to me appears to be the biggest loser from the DXY recovery, let me explain. The Euro enjoyed a stellar run against the greenback since the last ECB meeting as markets grew more aggressive with regards to the Fed rate cut cycle. However, over the last 10 days or so this narrative has changed somewhat.
A batch of poor data from Germany (Europe’s most industrialized economy) shows the challenges facing the European Central Bank. The ECB are all set to cut rates by another 25 bps on Thursday just the DXY looks set for a recovery. Markets are now pricing in a 25 bps cut from the Fed and as I see it a lot of that may already be priced in. If indeed that is the case, then the rate cut on September 18 may have a muted impact on the US Dollar and thus leave EUR/USD in a tight spot.
Market analysts have been touting a level around 1.12 for EUR/USD by year end, which remains a possibility. Given that September and October are usually strong months fro the USD and the fact that a lot of the 25 bps cut expected by the Fed may be priced in, this could leave the Euro vulnerable to further losses.
Now of course this could change very quickly as we have seen this year, with each data release shifting expectations a considerable amount. However, this week’s US data which comes in the form of CPI and PPI are no longer driving market participants’ decisions making. Labor data is now driving sentiment and decision making and could mean that this week’s US data may do little to shift the needle in regards to rate cut expectations.
Now looking at a comparison of rate cut expectations for the remainder of the year and there is a hope for the Euro as the year end approaches. Markets are pricing in two more 25 bps cuts from the ECB, but the December meeting is currently 50%. In contrast, the Fed is seen delivering three 25 bps cuts at each remaining meeting this year which could work in the Euros favor.
In the short-term however, I see challenges for the Euro especially if the US Dollar recovery continues to gather pace.
ECB Interest Rate Policy Probability
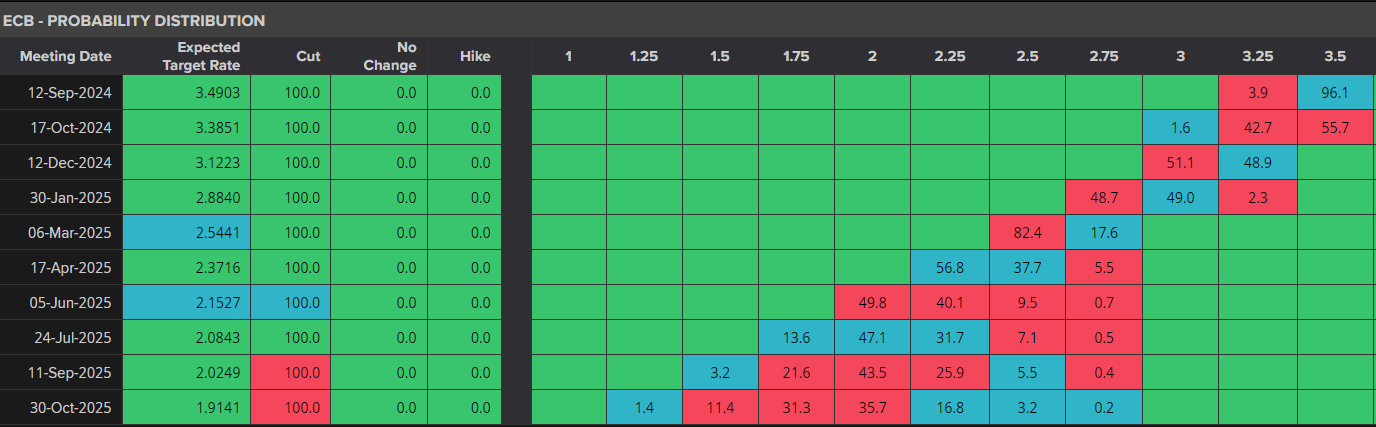
Source: LSEG (click to enlarge)
Technical Analysis
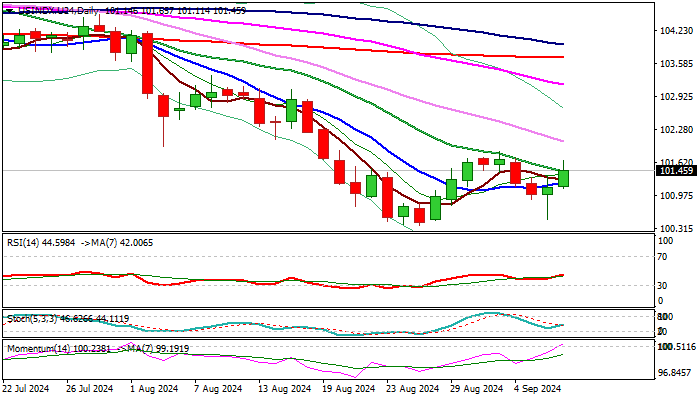
The US Dollar Index (DXY) is on course for a morningstar candlestick pattern off a key support level. This coupled with a higher low suggest that further upside may be in the offing in the days ahead.
Immediate resistance ahead is provided by the 102.16 handle before the 102.60 mark becomes a serious consideration.
Conversely, a break back to the downside has to navigate its way past support at 101.18 before the recent lows of 100.50 become a possibility. Beyond that the key psychological 100.00 lies in wait.
US Dollar Index Daily Chat, September 9, 2024
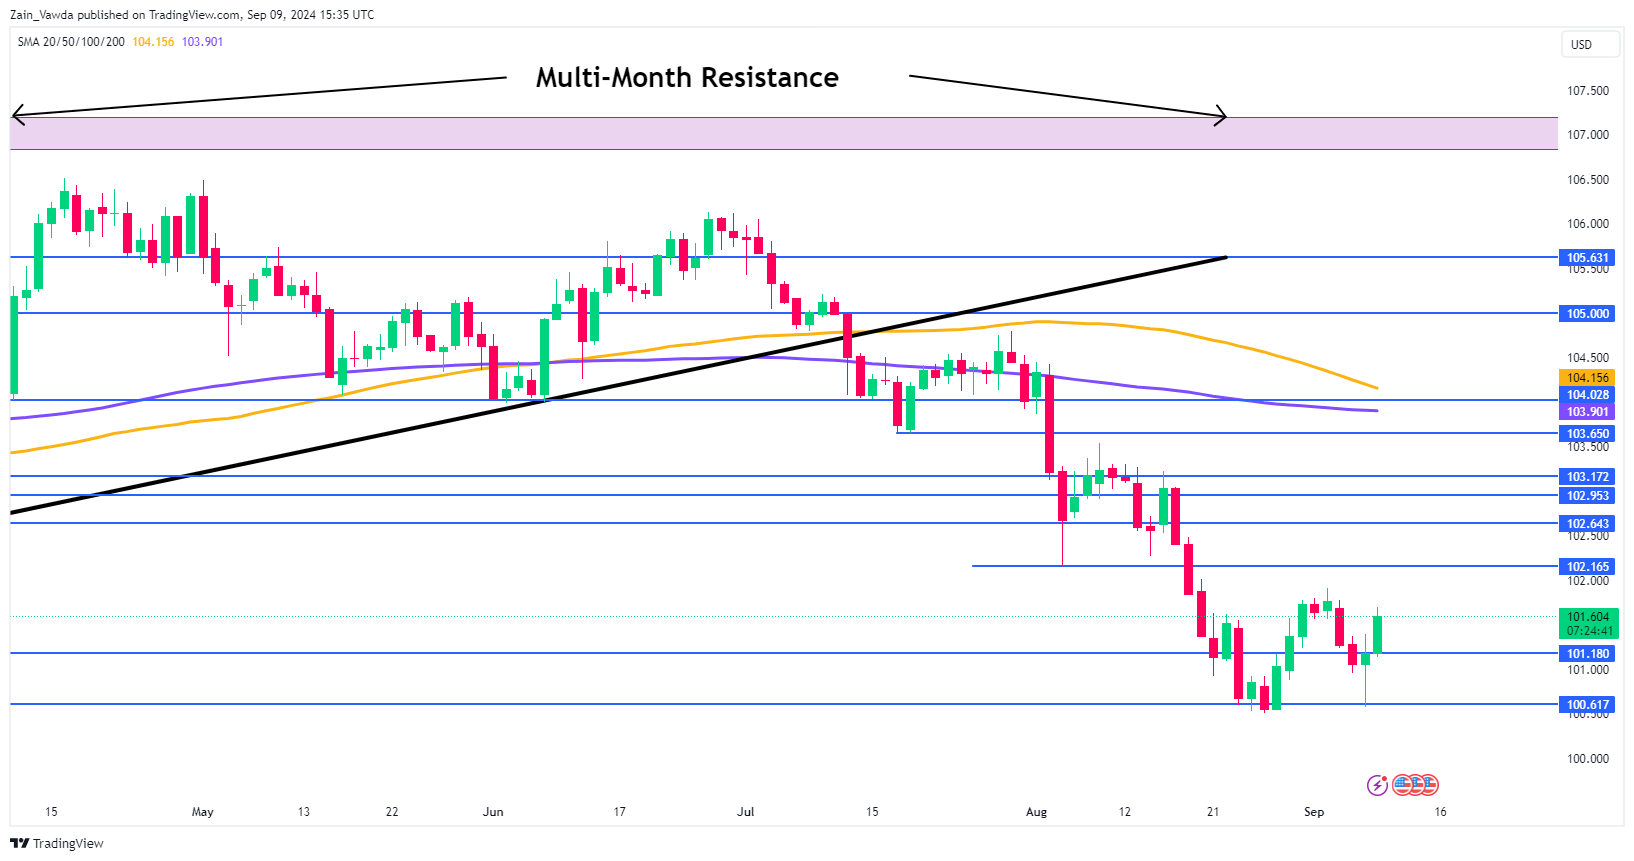
Source:TradingView.com (click to enlarge)
EUR/USD Technical Analysis
From a technical standpoint, EUR/USD has printed a fresh lower high at the back end of last last week. Having topped out just shy of the 1.1200 handle on August 26, the pair has been on a steady trajectory to the downside.
During the middle of last week, bulls made an attempt to take charge once more but Fridays significant selloff and resurgent US Dollar brought pair back below the 1.1100 handle. As things stand, immediate support rests at the psychological 1.1000 level with 1.0948 the next area of interest.
A bullish continuation from here will require bulls to navigate the 1.1100 and 1.1200 resistance areas before any further upside is possible.
EUR/USD Daily Chat, September 9, 2024
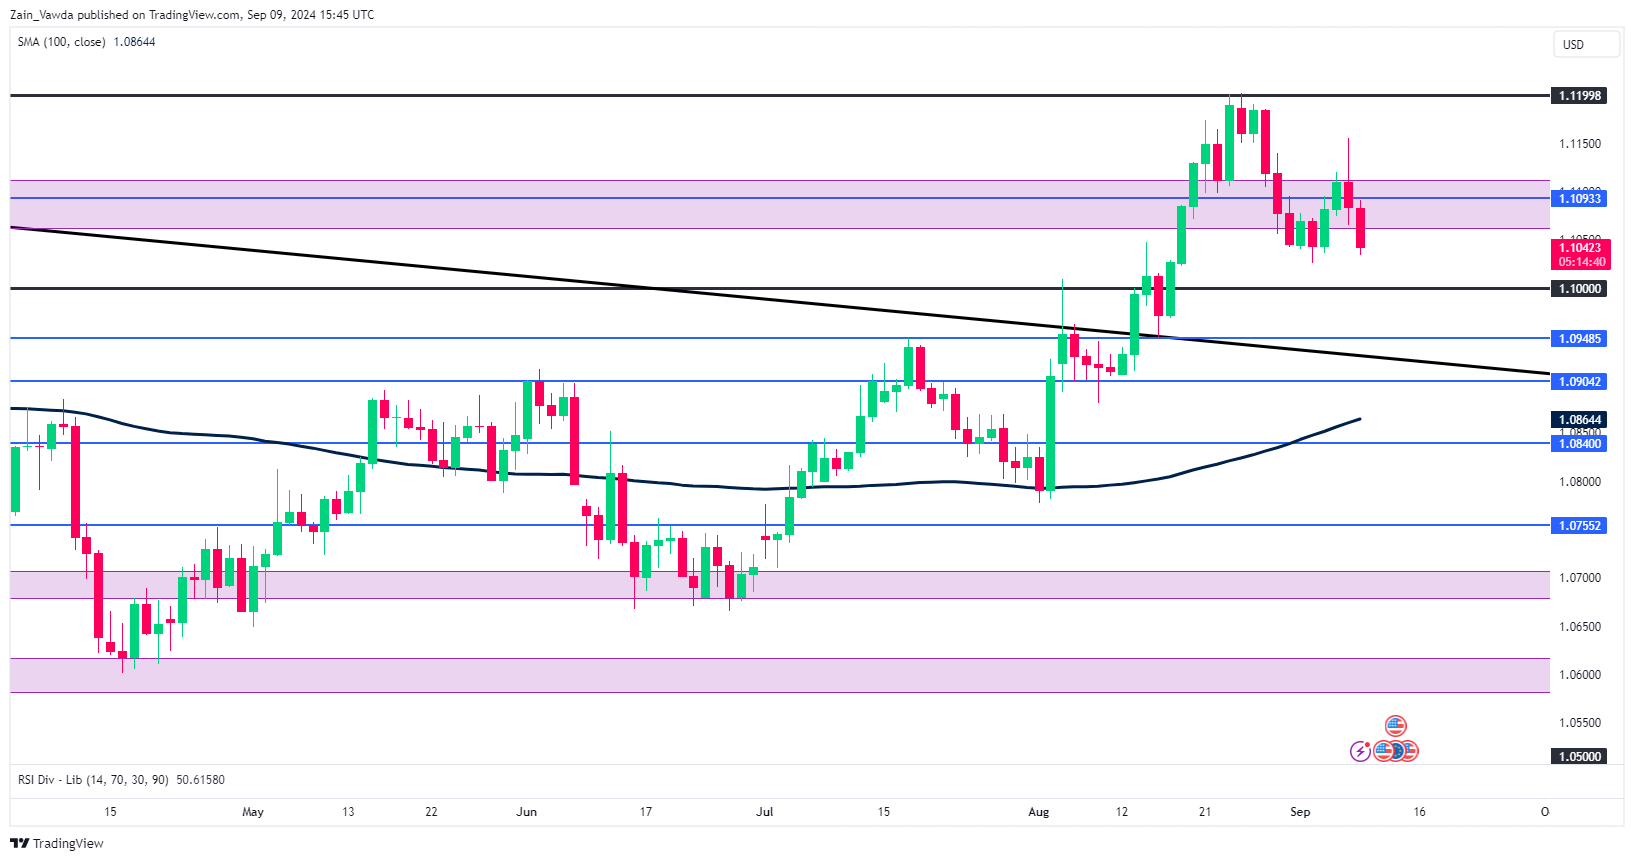
Source: TradingView.com (click to enlarge)
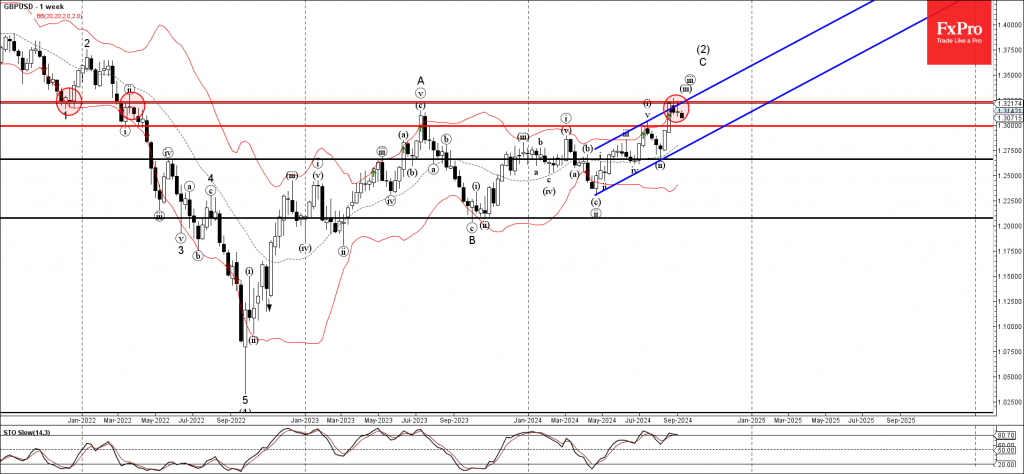
GBPUSD Wave Analysis
- GBPUSD reversed from strong resistance level 1.3230
- Likely to fall to support level 1.3000
GBPUSD currency pair recently reversed down from the strong resistance level 1.3230 (former strong support from the end of 2021).
The resistance level 1.3230 was strengthened by the upper daily Bollinger Band and by the resistance trendline of the daily up channel from May.
Given the strength of the resistance level 1.3230 and the overbought daily Stochastic, GBPUSD currency pair can fall further to the next round support level 1.3000.
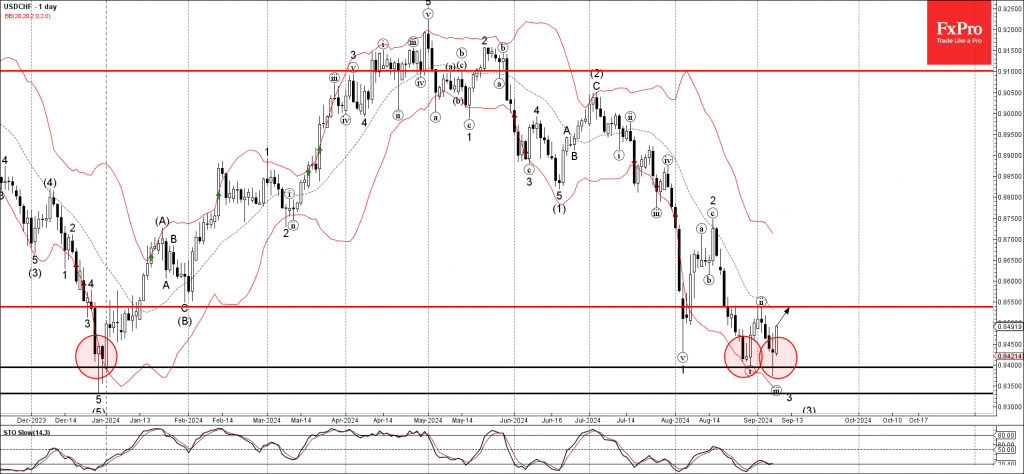
USDCHF Wave Analysis
- USDCHF reversed from support level 0.8400
- Likely to rise to resistance level 0.8550
USDCHF currency pair recently reversed up from the key support level 0.8400 (which has been reversing the price since the end of last year).
The upward reversal from the support level 0.8400 created the daily Japanese candlesticks reversal pattern Long-legged Doji.
Given the strength of the support level 0.8400 and the bullish US dollar sentiment seen across the FX markets today, USDCHF currency pair can rise further to the next resistance level 0.8550.
S&P 500, Nasdaq 100 – ‘Soft Landing’ Optimism Leads to Early Week Gains
- Major Wall Street indices started the week with gains, fueled by optimism for a “soft landing”.
- Concerns remain about the divergence between full and part-time workers, a potential recession indicator.
- Technical analysis suggests potential for further upside in the S&P 500 and Nasdaq 100, but historical trends and upcoming events warrant caution.
The major Wall Street Indexes have all started the week on the front foot, looking to recover some of Friday’s losses. There seems to be a fair bit of optimism today that a soft landing may be on the cards as US unemployment improved.
US equities experienced outflows last week which made it 3 out of the last 4 weeks. Money markets were the largest beneficiaries as fund flows and repositioning continue ahead of a busy couple of months.
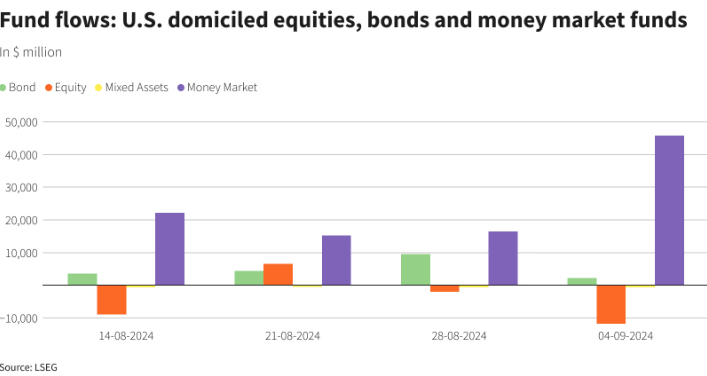
Source: LSEG Workspace
Despite the optimism around jobs data there are some underlying concerns which may be overlooked. A key one being the divergence between full and part-time workers which is widening. This phenomenon usually precedes a recession as indicated in a research note by ING think.
However, for now market participants are pricing in a 25 bps cut by the Fed at the September meeting. Concerning inflation data from China this morning was shrugged off with tomorrow’s import and export numbers likely to play a bigger role in the overall market sentiment.
Some individual movers in early trade today include Boeing BA.N which is up 4.7% after reaching a tentative agreement with a US Pacific NorthWest union. As the threat of a critical strike looms, this may go some way in mitigating such a disaster and could explain the jump in the share price. The union does represent 32k workers.
Dell and Palantir also enjoyed positive starts with the latter up around 8%. Dell was up around 5.9% on the day.
Nasdaq 100 Early Session Heatmap
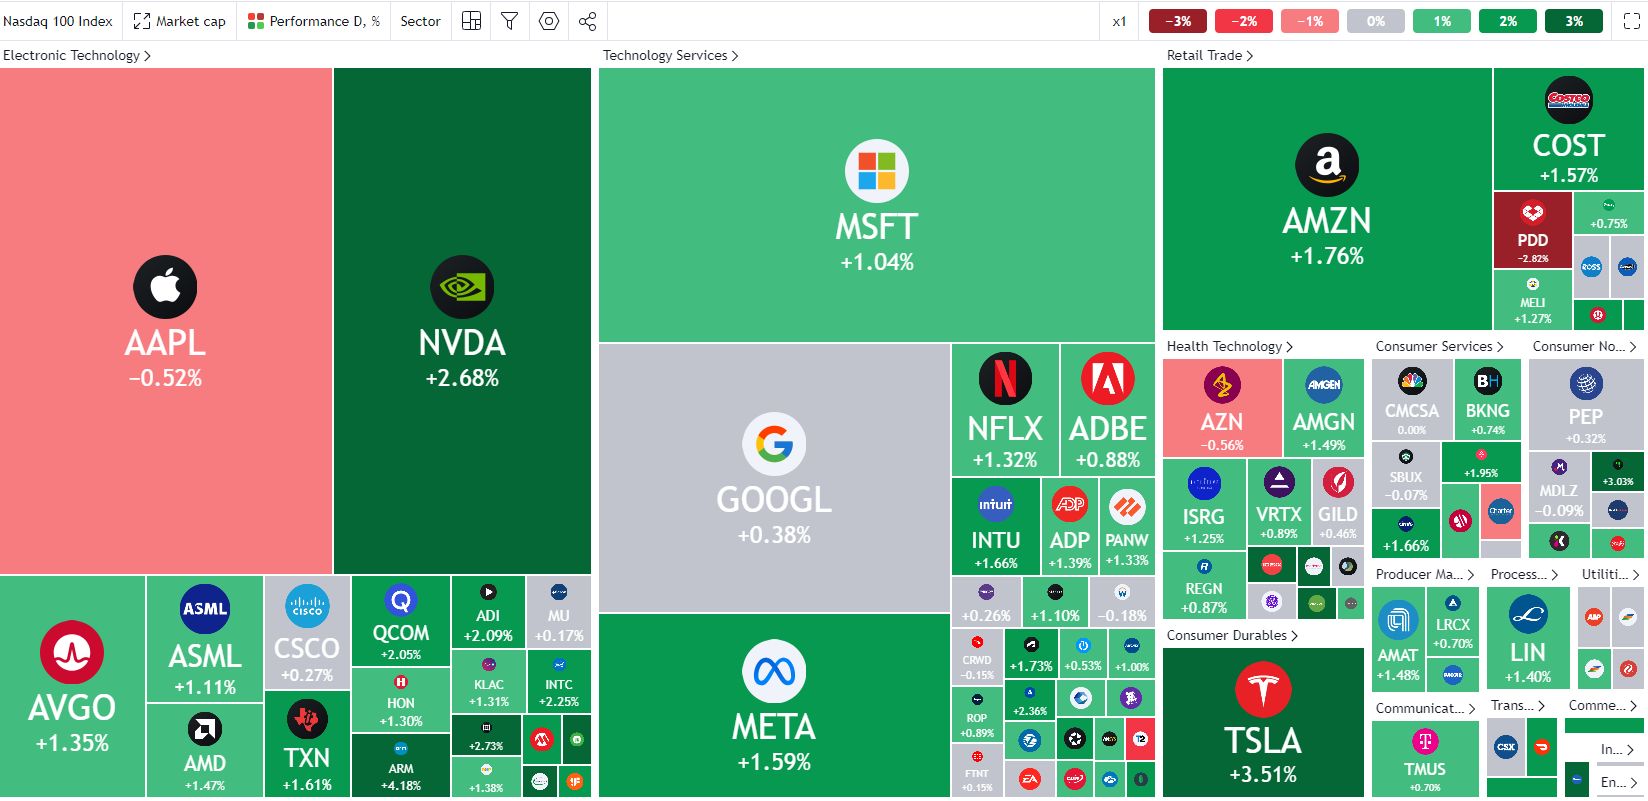
Source: TradingView
US PPI and CPI are ahead this week, however neither are likely to shake the needle where the Fed are concerned. Markets have for the time being at least pivoted toward labor data as the rate cut gauge rather than inflation.
Given the knowledge that September and part of October are historically bad for US stocks, was last week’s selloff as bad as it’s going to get? Or is there another selloff in store for market participants once the FOMC meeting concludes on September 18?
Technical Analysis
S&P 500
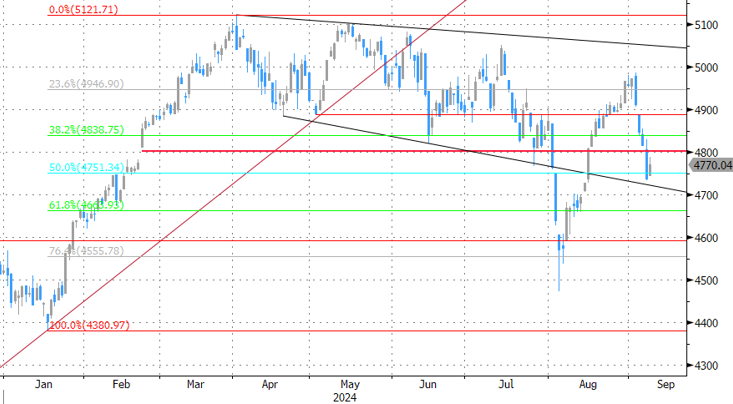
From a technical perspective, the S&P is coming off its worst week since March 2023 but has made an excellent start to the week. Finding support off a key level around 5390 (July 25 low), the index is on course for a bullish inside bar or engulfing candle close. Either of the two would hint at further upside ahead.
The headwinds presents are substantial however, and sentiment can always shift on a dime. Hence, marrying any bullish continuation bias at this stage may be premature. On the upside resistance is around the psychological 5500 before the 5538 handle comes into focus.
Immediate support rests at the 5390 mark before 5330 comes into focus. There is the 100-day MA that rests around the 5421 which could also provide some short-term support.
S&P 500 Daily Chart, September 9, 2024
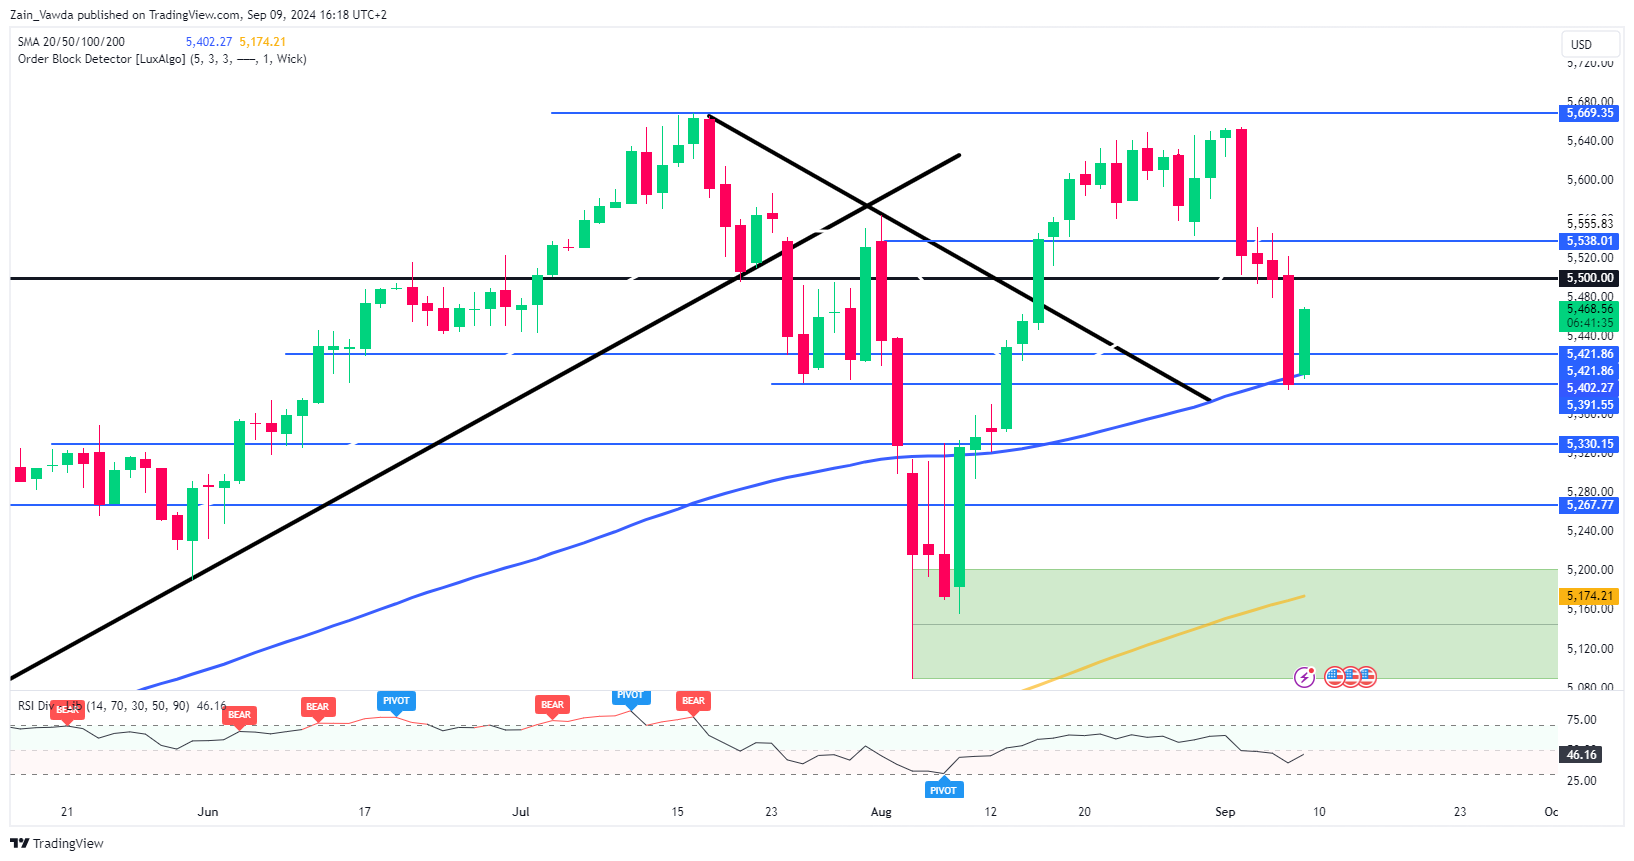
Source: TradingView (click to enlarge)
Support
- 5421
- 5390
- 5330
Resistance
- 5500
- 5538
- 5635
Nasdaq 100
From a technical perspective, the Nasdaq 100 on a daily timeframe is similar to the S&P as it has rallied over 330 points since the market open. We are seeing a slight pullback at the time of writing and given that historically September is a poor month for equities, we could be in for a bumpy ride.
There is a chance that rallies to the upside may face selling pressure and that the recovery may not be as smooth as market participants may hope for. Barring a dramatic collapse however, the Nasdaq 100 is on course to record a inside bar bullish close which hints at further upside ahead.
Having found support last week in between a key level and the 200-day MA which rests at 18241, there is significant hurdles up ahead which the index failed to clear on Friday. The first point of interest will arrive at 18800 before the confluence area around 19000 (which houses the 100-day MA) comes into focus.
Conversely, a break back to the downside would need to navigate below the 200-day MA before eyeing the 18000 level. This opens the door for a retest of the August lows around 17800 and 17330.
Nasdaq 100 Daily Chart, September 9, 2024
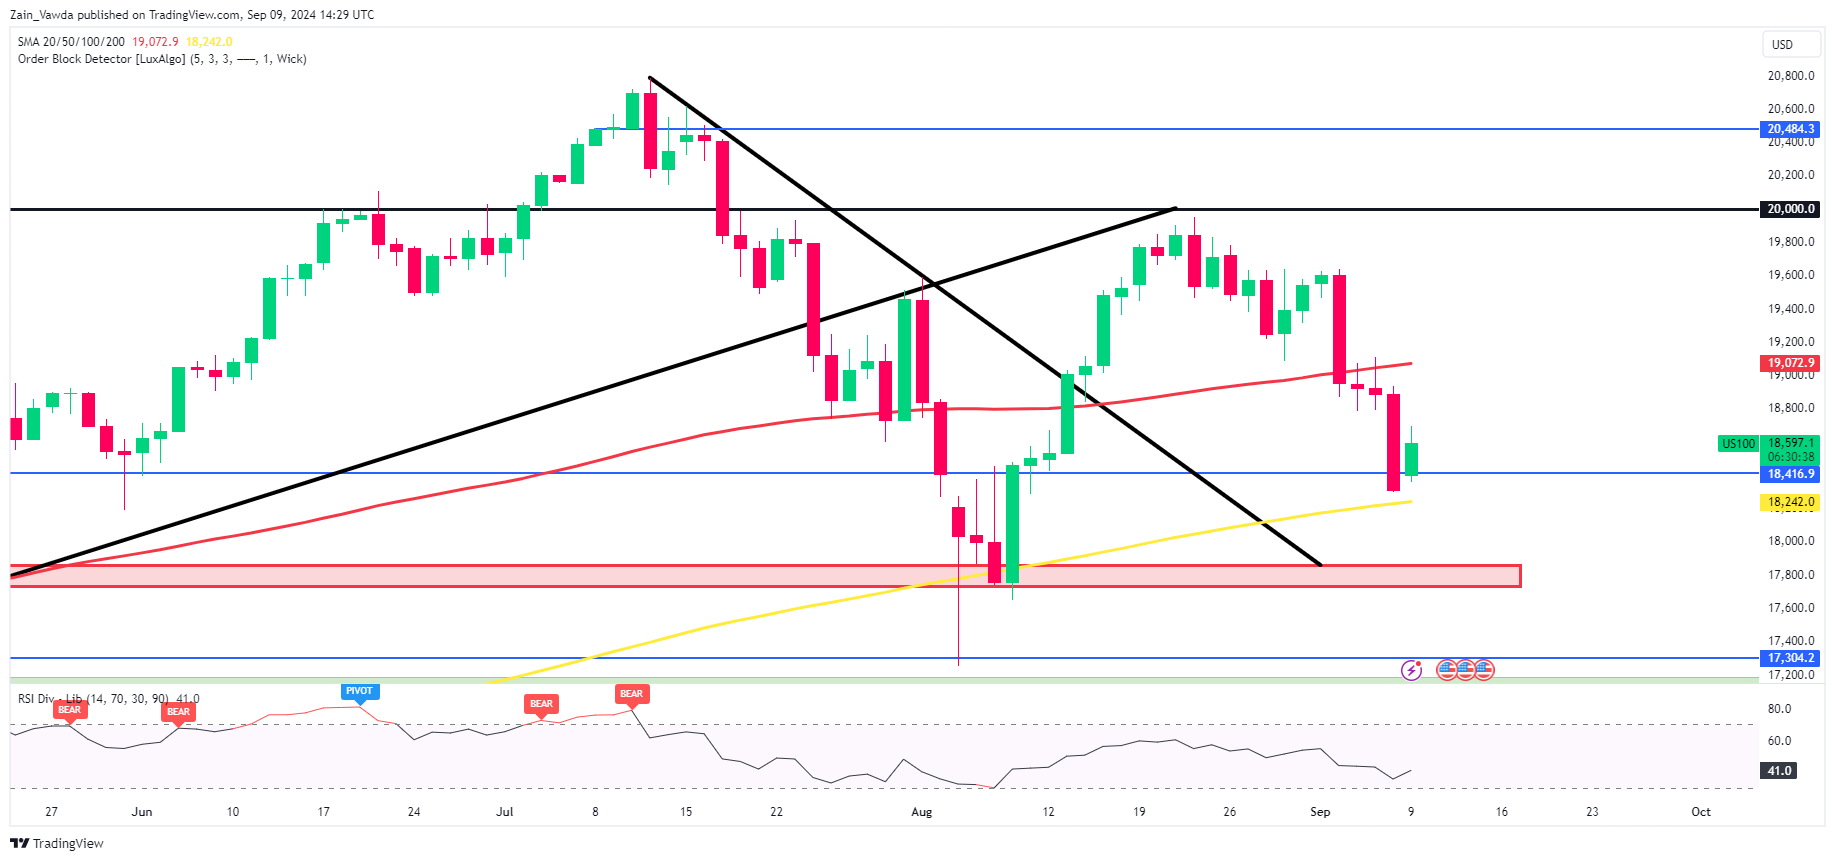
Source: TradingView (click to enlarge)
Support
- 18241
- 18000
- 17800
Resistance
- 18800
- 19000
- 19610
Dollar Index Outlook: Dollar Regained Traction After Mixed US Labor Data
The dollar index rose on Monday after almost equal bets for 25 or 50 basis points Fed rate cut diverged in favor of less aggressive option, cooled by mixed US jobs data which point to orderly slowdown in US labor market.
Although the dollar benefited from more dovish signals, markets look for further information to complete the picture of possible Fed decisions in the policy meeting, due later this month.
Release of US August inflation report on Wednesday is expected to provide the last part of mosaic, which US policymakers look for.
However, rising concerns about the condition of the US economy, in light of the recent information that the economy is at the edge of recession, keep traders as well as the central bank cautious.
Consumer prices are expected to rise at unchanged pace of 0.2% month on month in August, while annualized inflation is expected to ease to 2.6% from 2.9% in July.
Technical picture improved on daily chart, as north-heading 14- momentum broke into positive territory and the price rose above converging 10/20DMA’s, with the action being underpinned by long-tailed Friday’s candlestick which points to strong bids.
However, signals still look for verification, with close above 20DMA (101.44) seen as minimum requirement with sustained break above 101.84 (Sep 3 lower top) needed to complete bullish failure swing pattern and confirm signal.
Res: 101.65; 101.84; 102.03; 102.64.
Sup: 101.23; 101.08; 100.49; 100.38.
Sunset Market Commentary
Markets
Friday’s payrolls were soft but not that weak for markets to be sure that the Fed will start its easing cycle with a 50 bps step next week. In final comments before the start of the blackout period for Fed-communication, Fed’s Waller rubberstamped a ‘series of rate cuts’, but said to remain ‘open minded about the size and pace of rate cuts’. Given recent sharp decline in yields, investors for now don’t push for an even more aggressive positioning. Yields ‘rebounded’ off recent lows late on Friday and tried to build on that ‘correction’ today. US yields currently are gaining between 3.5 bps (2-y) and 2.0 bps (30-y). German yields add 1.0 bp (2-y) to 2.5 bps (10 & 30-y). We don’t draw any firm conclusions. Today’s correction occurs in a session deprived of any important data and intraday momentum wasn’t convincing. Yields also found some support from a slightly better risk sentiment after Friday’s post-payrolls risk-off. (Eurostoxx50 + 0.70%, S&P 500 opened 0.75% higher after a loss of 1.73% on Friday). Still, the reaction function of equities to softer data is also far from unequivocal. Sometimes (e.g. early August and to some extent last week) recession fears are seen as a negative for equites. At other moments, investors tend to embrace a substantial easing of financial conditions. Again, an inclusive story line. It’s unlikely that markets will draw a clear directional conclusion before next week’s Fed decision/policy guidance. Wednesday’s US inflation figures probably won’t decide on this topic. The focus is on growth and on the labour market. Ongoing uncertainty on global demand (cf. poor Chinese price data this morning) prevents any stained rebound in oil (currently brent $71.8 p/b).
On FX, the dollar tries a technical rebound after testing key support levels on Friday. DXY trades near 101.6 after testing the 100.50/60 area. Idem for USD/JPY (143.1) as it tries to leave the 141.70/80 area. The euro already underperformed the likes of the dollar and the yen of late and continues trading in the defensive. Europe hasn’t much to offer in a context growing uncertainy on growth. At 1.1045, EUR/USD is nearing intermediate support (1.1026 ST low). Sterling (EUR/GBP 0.8437) regains part of Friday’s risk-off loss against the euro but isn’t able to join the USD rebound (cable 1.3095), looking forward to tomorrow’s UK labour data. Despite the rebound in equities, smaller commodity related currencies or currencies sensitive to the economic cycle mostly continue trading in the defensive (AUD, NZD, but also Norwegian and the Swedish krone).
News & Views
Mario Draghi released his highly anticipated report on the state of the European economy and competitiveness. Titled “The future of European competitiveness” the former ECB chief called for a “new industrial strategy” in which the bloc invests some €800bn annually to develop its advanced technologies, boost defense and security of critical raw materials as well as create a plan to meeting its climate targets. Draghi also recommended relaxing competition rules so that policy “does not become a barrier” to the bloc’s industrial goals. Calling it an “existential challenge”, he pushed Europe to boost investment by about 5 ppts of GDP in order to transform the economy so that it can keep up with other major players including the US and China. Doing so would bring the investment-to-GDP ratio to its highest level since the seventies. The ex-ECB president argued for integrating capital markets (by centralizing market supervision) but said that the private sector is unlikely to be able to finance the whole undertaking. Public sector support is needed and he repeated a call for a common safe asset and joint EU funding to back “European public goods” such as common energy infrastructure and joint defense procurement. Draghi also favoured new levies at the EU level to finance more spending through the common budget.
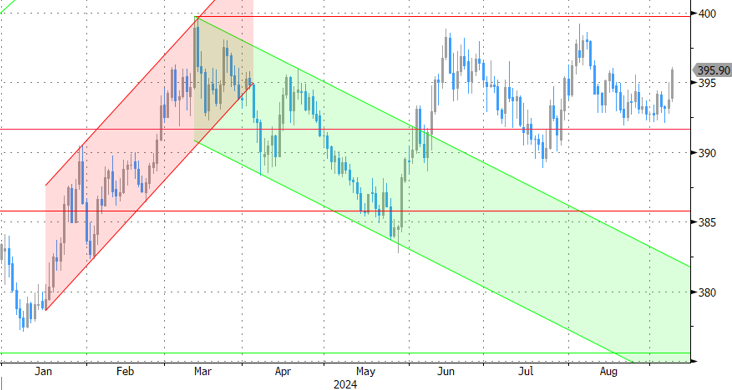
The Hungarian forint underperforms its regional peers today. EUR/HUF topped the 395 barrier in the slipstream of articles flagging prime minister Orban’s intention to raise spending ahead of the 2026 elections. First reports emerged last Friday on Bloomberg and Orban himself in comments on social media yesterday appeared to confirm this, adding that he aims to achieve it while keeping public finances stable. After missing budget deficit targets multiple times, markets are skeptical that this time would be any different. Meanwhile, Orban is scouting the field for a successor to Matolcsy as head of the central bank. Finance minister Varga and economy minister Nagy have come up over the weekend as potential candidates. But neither seem to instill confidence: the former’s track record is one of long-running high deficits despite his reputation as a technocratic defender of fiscal prudence. The latter openly favours interventionist policies (both fiscal and monetary).
Graphs
EUR/HUF: forint underperforms regional peers as government is backtracking on fiscal consolidation ‘commitment’.
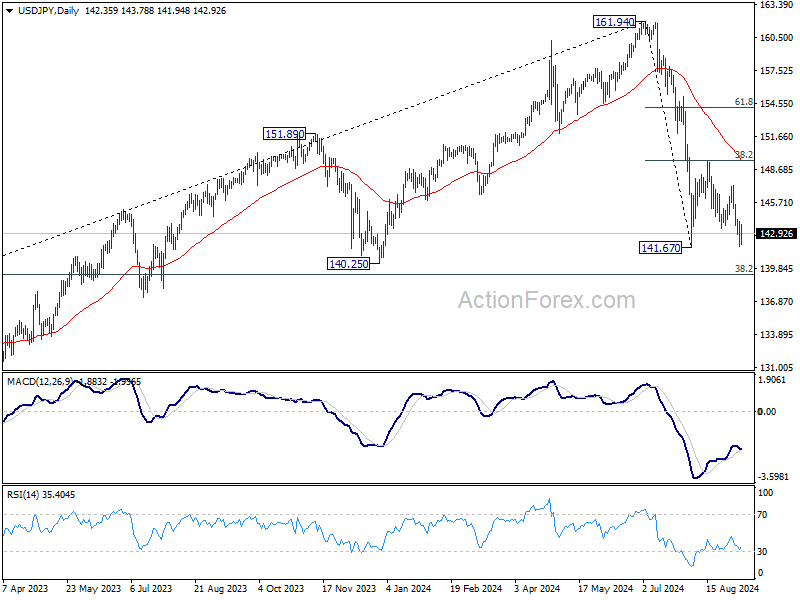
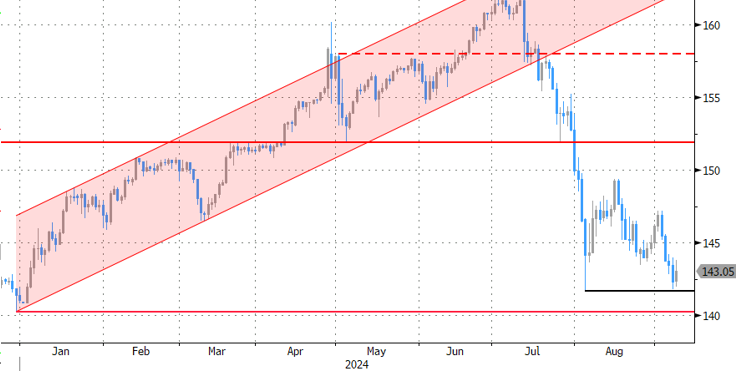
USD/JPY: dollar decline halts ahead of key support as markets ponder the amount and pace of Fed rate cuts.
Eurostoxx 50: correction takes a breather. Technical picture remains unconvincing.
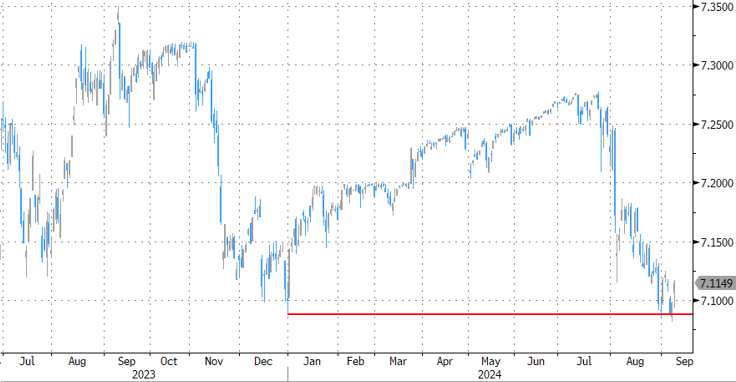
USD/CNY: yuan declines on broader USD rebound. China deflation risks suggest ongoing yuan softness too.
GBP/USD Mid-Day Outlook
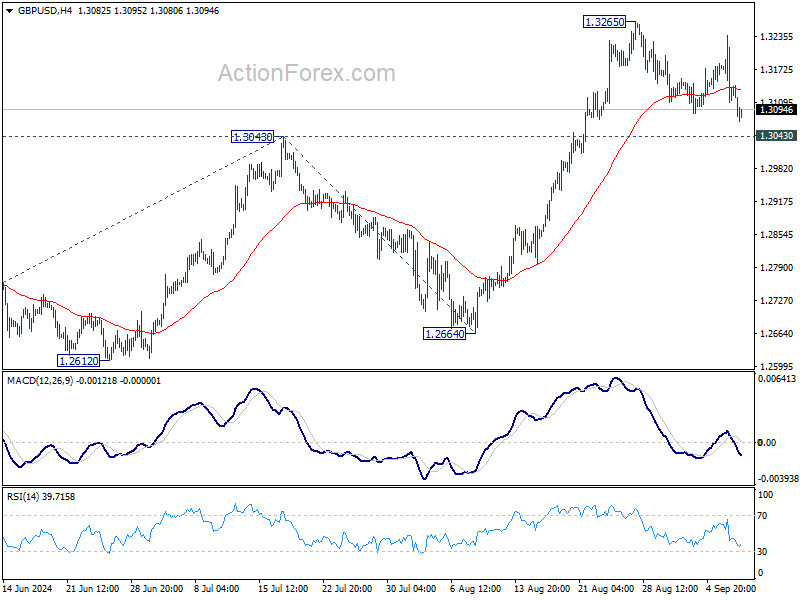
Daily Pivots: (S1) 1.3078; (P) 1.3158; (R1) 1.3207; More...
Outlook in GBP/USD is unchanged as range trading continues below 1.3265. Further rise is expected with 1.3043 resistance turned support intact. On the upside, firm break of 1.3265 will resume larger up trend to 100% projection of 1.2298 to 1.3043 from 1.2664 at 1.3409. However, firm break of 1.3043 will turn bias back to the downside for deeper pullback.
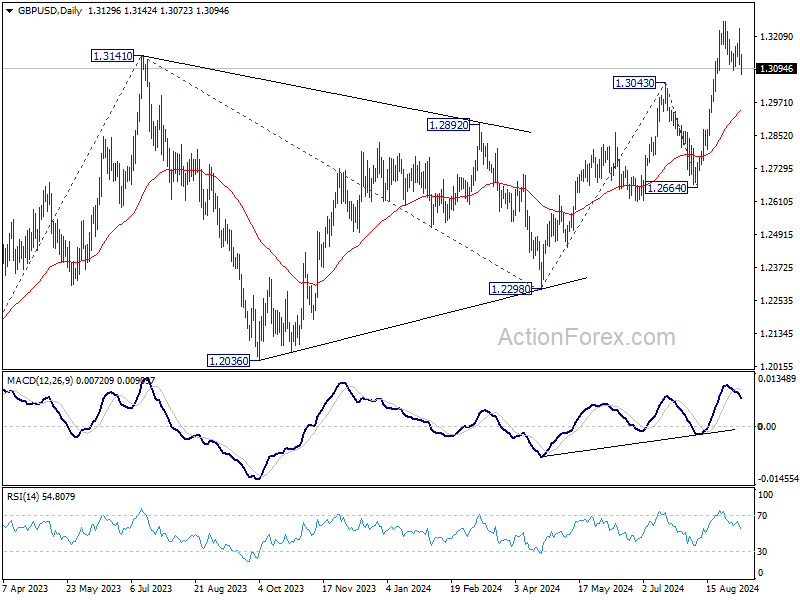
In the bigger picture, up trend from 1.0351 (2022 low) is in progress. Next target is 38.2% projection of 1.0351 to 1.3141 from 1.2298 at 1.3364. For now, outlook will stay bullish as long as 1.2664 support holds, even in case of deep pullback.
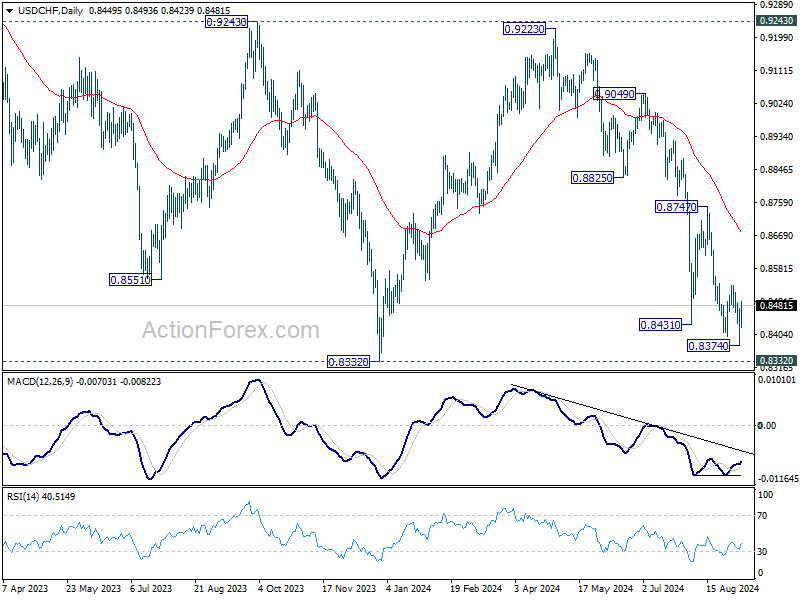
USD/CHF Mid-Day Outlook
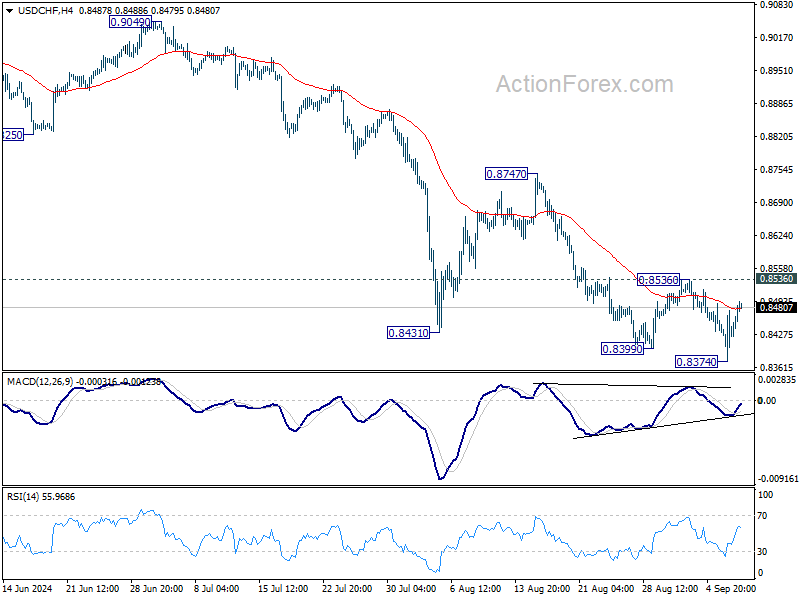
Daily Pivots: (S1) 0.8379; (P) 0.8428; (R1) 0.8480; More…
Intraday bias in USD/CHF remains neutral and further decline is expected as long as 0.8536 resistance holds. Below 0.8374 will resume the fall from 0.9223 to retest 0.8332 low. Decisive break there will indicate larger down trend resumption. However, considering bullish convergence condition in 4H MACD, break of 0.8536 resistance will now confirm short term bottoming, and turn bias back to the upside for 0.8747 resistance.
In the bigger picture, price actions from 0.8332 (2023 low) are currently seen as a medium term corrective pattern, with fall from 0.9223 as the second leg. Strong support could be seen from 0.8332 to bring rebound. Yet, overall outlook will continue to stay bearish as long as 0.9243 resistance holds. Firm break of 0.8332, however, will resume larger down trend from 1.0146 (2022 high).
USD/JPY Mid-Day Outlook
Daily Pivots: (S1) 141.42; (P) 142.66; (R1) 143.54; More...
Intraday bias in USD/JPY is turned neutral with 4H MACD crossed above signal line. But further decline is expected as long as 147.20 resistance holds. Decisive break of 141.67 will resume whole decline from 161.95 high. Next target will be 140.25 support.
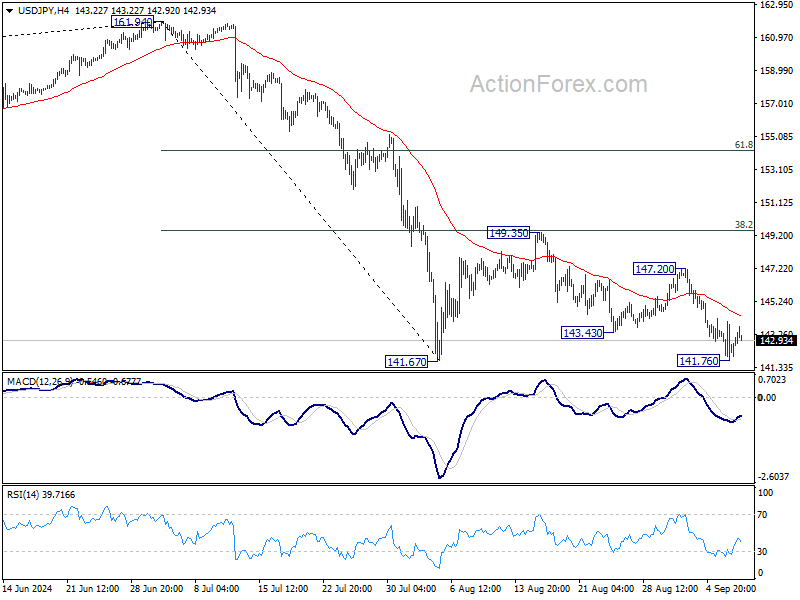
In the bigger picture, fall from 161.94 medium term top is seen as correcting whole up trend from 102.58 (2021 low). Deeper decline could be seen to 38.2% retracement of 102.58 to 161.94 at 139.26, which is close to 140.25 support. In any case, risk will stay on the downside as long as 55 W EMA (now at 149.21) holds. Nevertheless, firm break of 55 W EMA will suggest that the range for medium term corrective pattern is already set.