
Sample Category Title
AUD/USD Steady Despite Weak GDP
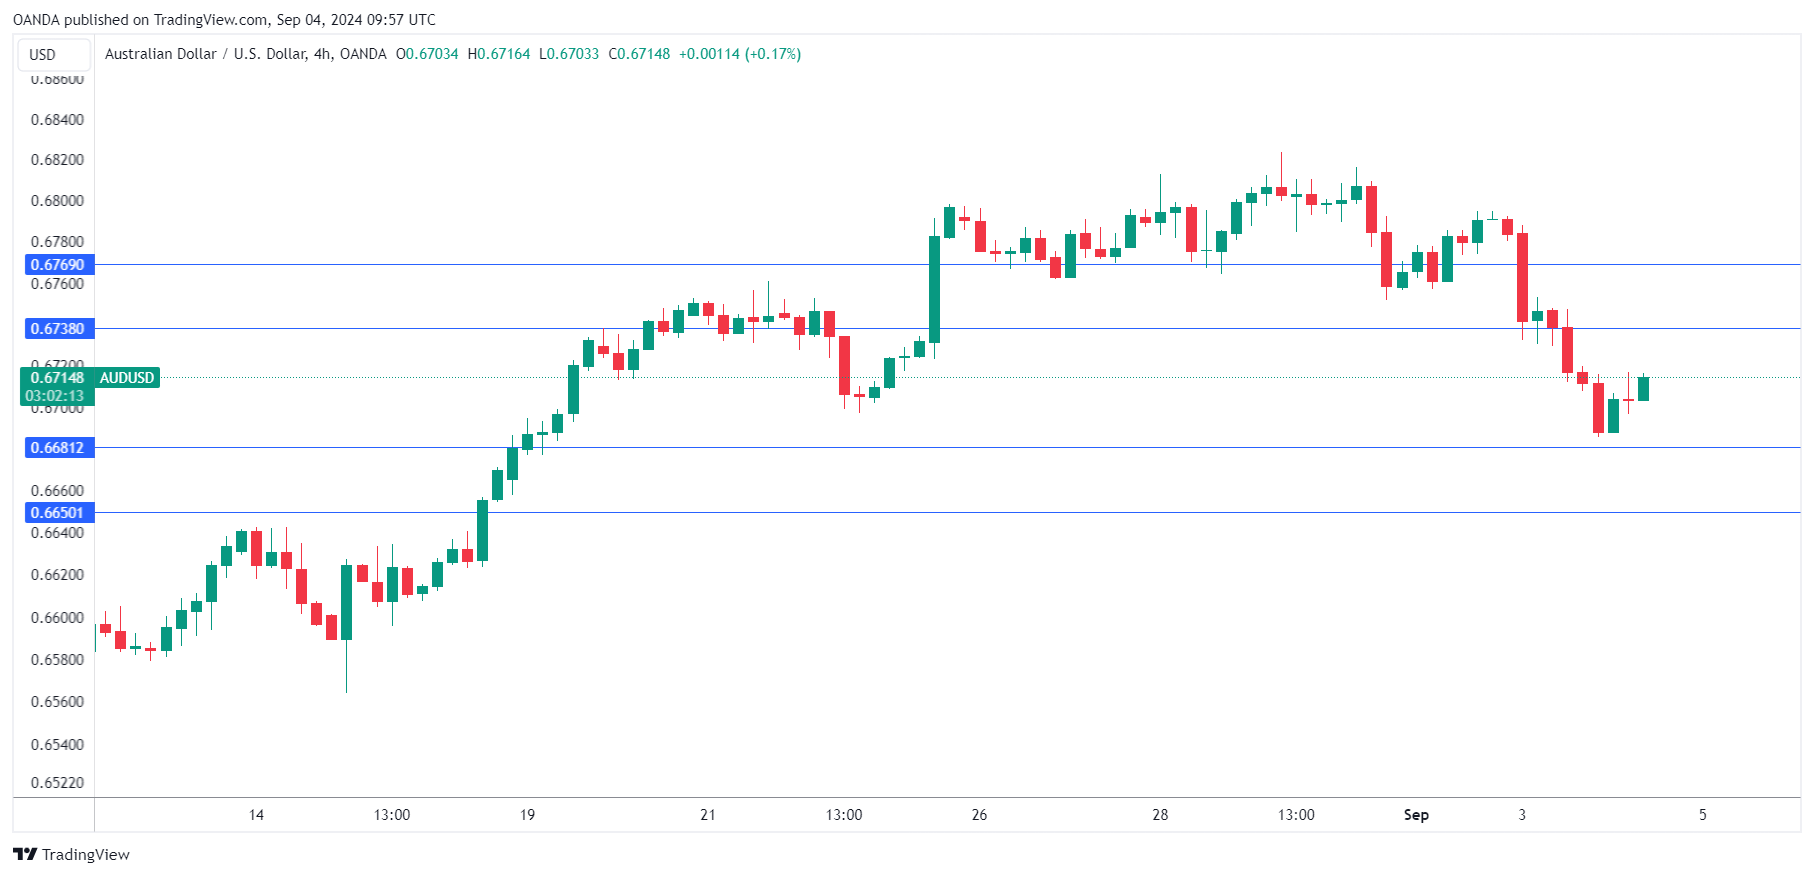
The Australian dollar is drifting on Wednesday. AUD/USD is trading at 0.6704 in the European session, down 0.10% today at the time of writing. The Australian dollar took a bath a day earlier, sliding 1.1%, one of the sharpest daily declines this year.
Australia’s GDP dips to 0.2%
Australia’s economy gained a paltry 0.2% q/q in the second quarter, shy of the market estimate of 0.3% and unchanged for a third consecutive quarter. This was the softest pace of growth in five quarters and the small gain was driven by higher government spending as household spending declined. Yearly, GDP climbed 1%, in line with the market estimate and down from 1.3% in the first quarter. This was the lowest annual GDP release since the fourth quarter of 2020.
Australia’s economic picture is being described by some local commentators as a “horror show”. This is not a wild exaggeration as GDP is in the doldrums, inflation remains sticky and consumer spending was flat in July. The Reserve Bank has maintained rates at 4.35% since November but inflation hasn’t fallen as quickly as anticipated.
The GDP release is unlikely to be a factor at the Reserve Bank of Australia’s next meeting on Sept. 24. The central bank is primarily concerned with inflation and the labor market. Governor Bullock has essentially ruled out a rate cut in the next six months but the markets have priced in a rate cut before year’s end and more cuts in early 2025.
Bullock will speak at an event in Sydney early on Thursday and the markets will be looking for some insights from the hawkish Governor regarding future rate policy.
AUD/USD Technical
- There is support at 0.6681 and 0.6650
- 0.6738 and 0.6769 are the next resistance lines
Eurozone PPI rises 0.8% in Jul, driven by energy costs
In July, Eurozone PPI rose 0.8% mom, surpassing expectations of 0.3% mom increase. On a yearly basis, however, PPI was down by -2.1% yoy, though better than the expected -2.5% yoy decline. Energy costs were the primary driver, with prices surging by 2.8% mom during the month, while other sectors showed more modest or negative price movements. Intermediate goods fell by -0.1% mom, durable consumer goods rose 0.1% mom, and non-durable consumer goods dipped by -0.1% mom. Prices for capital goods remained unchanged.
EU-wide PPI also saw significant movement, falling -0.8% mom and -19% yoy. The biggest monthly price increases were recorded in Bulgaria (+3.6%), Greece (+2.9%), and Romania (+2.7%), while the largest decreases occurred in Sweden (-0.9%), Finland (-0.7%), and Austria (-0.2%).
UK PMI services finalized at 53.7, inflation pressures ease
UK services sector continued its expansion in August, with the PMI Services index finalized at 53.7, up from 52.5 in July, marking the 10th consecutive month of growth. PMI Composite also showed improvement, climbing to 53.8 from 52.8, indicating the fastest pace of overall economic growth since April.
Tim Moore, Economics Director at S&P Global Market Intelligence, noted that "August data highlighted a recovery in UK service sector performance" as improving economic conditions and domestic political stability supported customer demand. New business saw a robust increase after a summer slowdown in decision-making, fueling the strongest service sector activity in months.
Service providers responded to this uptick by increasing staff levels, with job creation outpacing the first half of 2024. However, businesses still faced challenges from shortage of candidates and rising wage pressures. Despite higher salary payments, the rate of input price inflation continued to fall, reaching its lowest level since January 2021. In addition, prices charged by service providers rose at the slowest pace in three-and-a-half years, further indicating easing inflationary pressures in the sector.
US 100 Index Under Pressure
- US 100 index drops, reversing the August rally
- Nvidia woes keep sentiment negative
- Momentum indicators are turning bearish
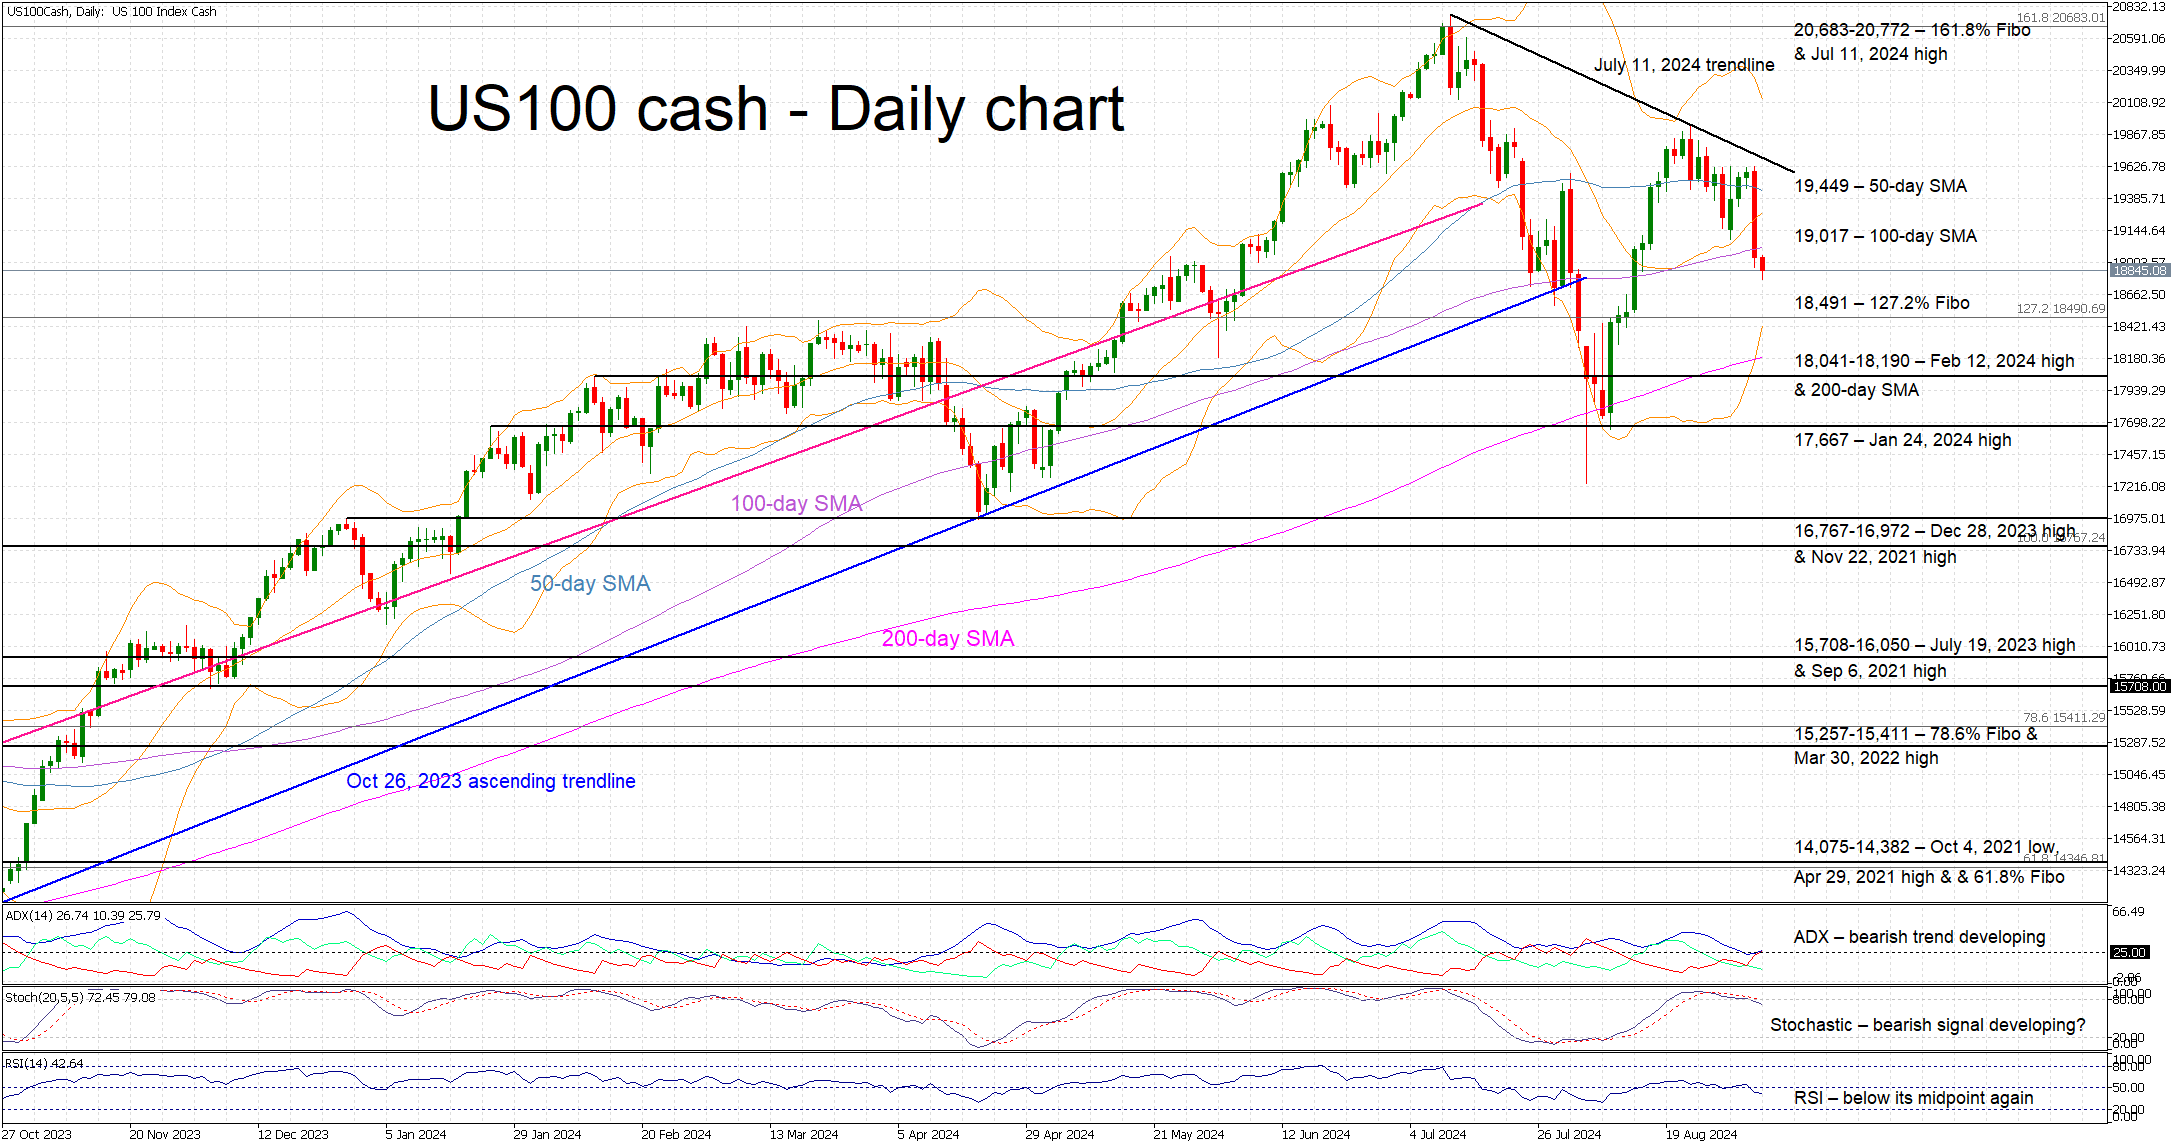
The US 100 cash index is in the red again today, trading back below the 100-day simple moving average (SMA) and having surrendered half of its August gains. Nvidia’s underperformance is keeping the index under pressure with the market preparing for this week's key US labour market data releases and counting down to the September 18 Fed meeting.
The momentum indicators are gradually turning bearish. More specifically, the Average Directional Movement Index (ADX) is edging higher and thus signalling a strengthening bearish trend in the US 100 index. Interestingly, the RSI has dropped below its midpoint for the first time since August 13. More importantly, the stochastic oscillator is trading lower, below its overbought territory. Should this move pick up pace, it would be seen as a very strong bearish signal.
If the bears remain confident, they could try to keep the US 100 index below the 100-day SMA and gradually push it towards the 127.2% Fibonacci extension level of the November 22, 2021 – October 13, 2022 downtrend at 18,491. If successful, they could then have a go at testing the support set by the 18,041-18,190 range.
On the flip side, the bulls are desperately trying to regain control and gradually push the US 100 index above both the 100- and 50-day SMAs at 19,017 and 19,449 respectively. They could then test the resistance set by the July 11, 2024 trendline with the next plausible target being the 20,683-20,772 area.
To sum up, momentum has turned negative in the US 100 index but in order to achieve a lower low the bears have to overcome a series of key support levels.
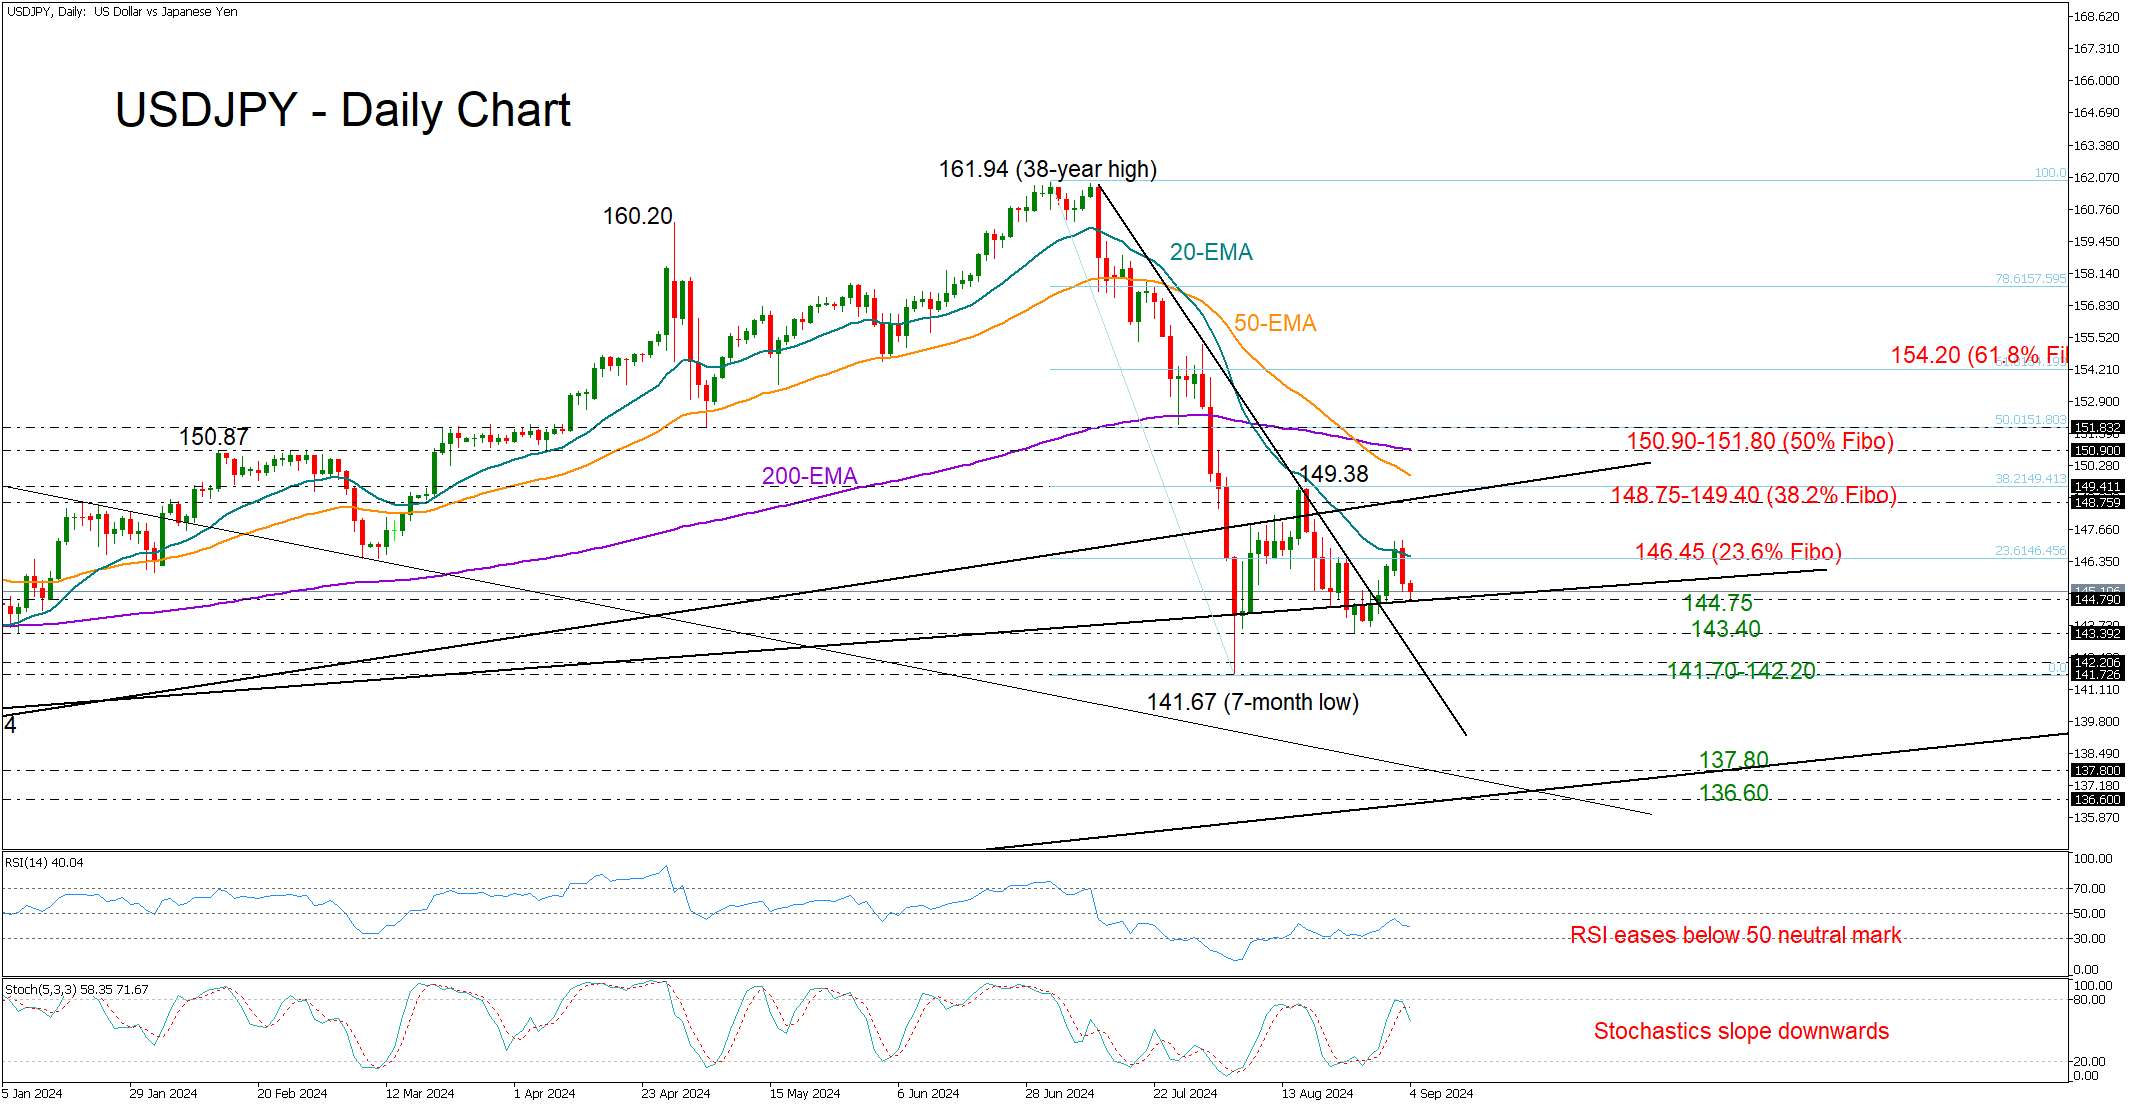
USDJPY Trapped in a Gloomy Trajectory
- USDJPY drifts back below 147.00 area; tests support trendline
- Technical picture signals bearish trend continuation
USDJPY was unable to maintain its strength on Tuesday despite briefly surpassing the 147.00 level, as the 20-day exponential moving average (EMA) caused a retreat towards the support trendline from July 2023 at 144.75.
The technical indicators cannot guarantee an immediate bullish rotation as the RSI has changed direction to the downside before reaching its 50 neutral mark and the stochastic oscillator has posted a negative cross near its 80 overbought level.
Trend signals are discouraging as well, with the 50- and 200-day EMAs sloping downwards after registering a death cross and the 20-day EMA declining well below them.
Should it dip below 144.80, the price might temporarily stall near 143.40 before encountering the broken resistance trendline at 142.20 and the August trough of 141.67. Then a clear close below the December 2023 bar of 140.80 could cause a rapid downfall towards the 136.60-137.80 zone, where the descending constraining line from November 2023 and the 161.8% Fibonacci extension of the previous upturn are positioned.
If the bulls make a comeback and manage to push the pair above its 20-day EMA at 146.45, a resistance zone could come into play between 148.75 and 149.40. This area is significant as it includes the broken ascending trendline from 2023 and the 38.2% Fibonacci retracement level of the July-August freefall. Note that the 50-day EMA is converging to that zone too. Hence, the bulls may need to knock down that wall to access the 200-day EMA at 150.90 and the 50% Fibonacci mark of 151.80.
In a nutshell, USDJPY appears bearish in the short-term picture, with new selling forces anticipated below 144.75.
USD/JPY Sees Modest Rise Amid Anticipation of BoJ Policy Shift
The USD/JPY pair has slightly increased, rising to 145.95 on Wednesday morning. This movement marks a rebound from two-week lows, though it is still early to suggest a significant reversal in the trend due to the ongoing economic climate.
Market participants are cautious as they await crucial US employment market data for August, which is due later this week. These figures will likely substantially impact the Federal Reserve's forthcoming decisions.
On the Japanese front, the Bank of Japan (BoJ) has maintained its current policy stance but has signalled potential adjustments should economic projections align with actual outcomes. This cautious but responsive approach, including the possibility of a December interest rate hike, reflects the BoJ's commitment to stability in the face of economic indicators.
Recent Japanese economic data has shown a slight improvement, with the manufacturing PMI inching up to 49.8 from 49.5, nearly reaching the critical threshold of 50.0 that differentiates contraction from expansion. This positive development suggests a potential stabilisation in the manufacturing sector.
USD/JPY technical analysis
The H4 chart indicates a recent corrective move up to 147.20, followed by a downward wave targeting 144.11. Should this level be reached, a corrective movement to 145.66 could occur, testing it from below. A further decline to 144.11 is conceivable, with a potential continuation to 141.80 and down to 137.77. This bearish outlook is supported by the MACD indicator, with the signal line positioned above zero but trending downward sharply.
On the H1 chart, USD/JPY executed a downward impulse to 145.66 and has since been consolidating around this level. A break below the consolidation range could initiate the continuation of the downward trend towards 144.11. After reaching this target, a retest of 145.66 may be anticipated. This bearish scenario aligns with the Stochastic oscillator's readings, where the signal line is just above 50 but indicates a downward movement.
Eurozone PMI services finalized at 52.9, cost pressures ease
Eurozone's services sector showed improved growth in August, with PMI Services index rising to 52.9 from July’s 51.9, while the PMI Composite increased to 51.0 from 50.2. Both readings marked three-month highs, signaling a strengthening in overall economic activity. According to HCOB, input cost inflation eased to its lowest point in 2024, though the rate of increase in output charges ticked up slightly.
Country-specific data revealed a mixed picture, with Spain leading the pack with a Composite PMI of 53.5, a two-month high, followed by France at 53.1, a 27-month high. Ireland's Composite PMI hit 52.6, its highest in five months, while Italy recorded a two-month high at 50.8. On the other hand, Germany saw its Composite PMI fall to 48.4, a five-month low.
Cyrus de la Rubia, Chief Economist at Hamburg Commercial Bank, pointed to the "Olympic effect" as a key factor ensuring GDP growth in Eurozone for Q3. While services sector is performing well across all major Eurozone economies, the manufacturing sector remains in recession, with worsening conditions in key countries like Germany and France.
On the inflation front, service providers slightly increased their prices in August, but cost pressures, particularly those driven by wages, have eased. This will likely be a positive signal for ECB, which may "breathe a small sigh of relief" as it weighs its policy decisions. Combined with favorable inflation data from Eurostat, these factors could provide the ECB with further justification to cut interest rates at its upcoming meeting on September 12.
Gold Stands Within Sideways Channel
- Gold eases beneath near-term SMAs
- Stochastics post positive divergence
- MACD strengthens bearish momentum
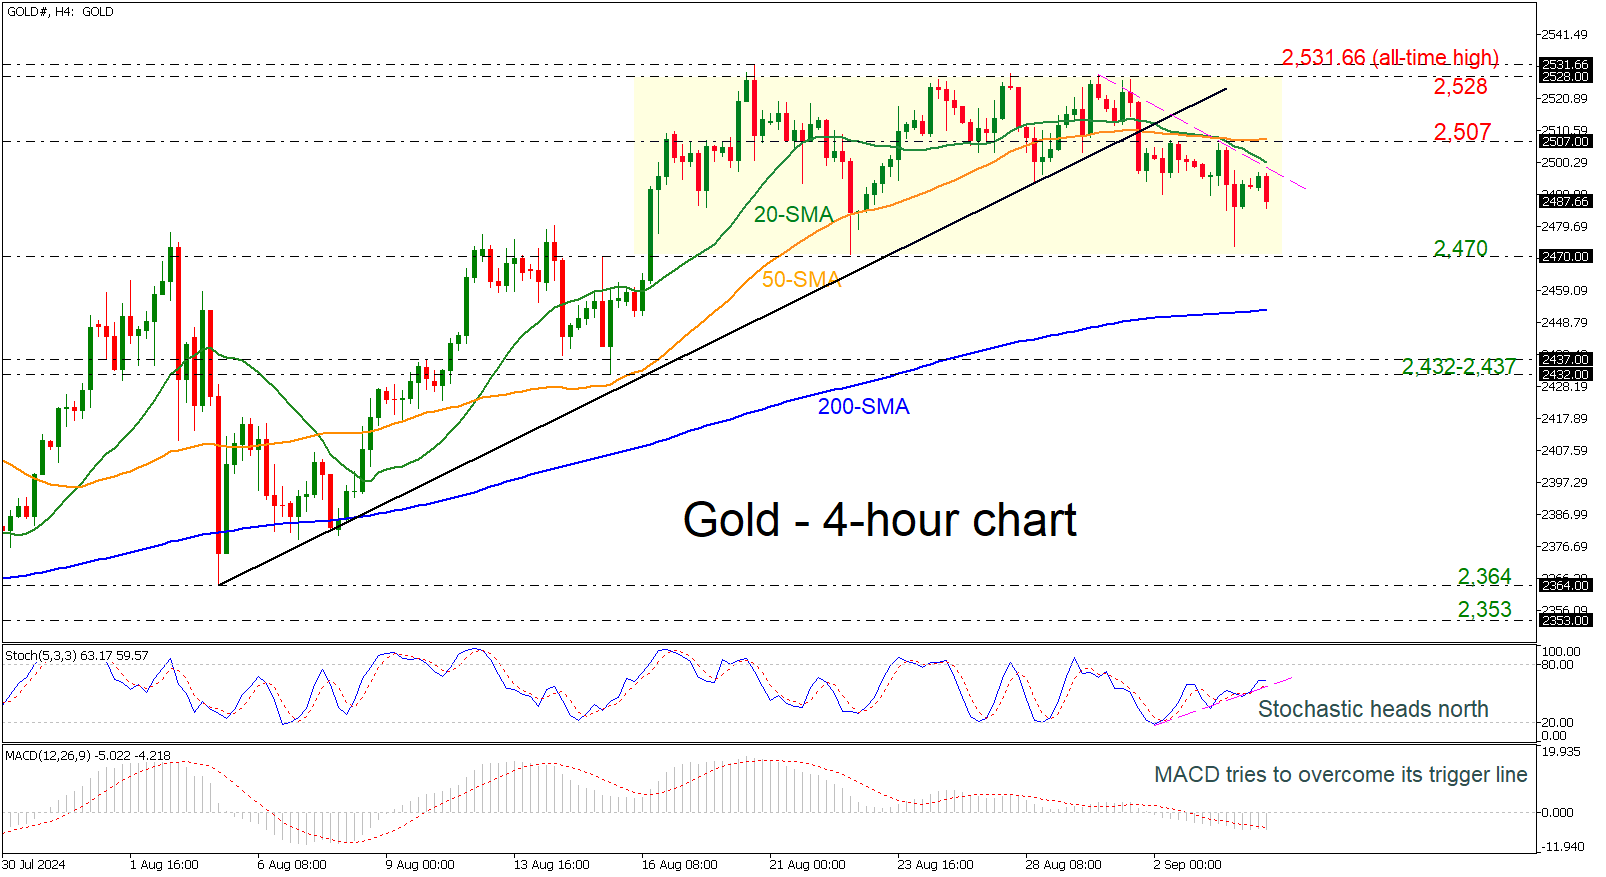
Gold prices have been developing within a trading range of 2,470 to 2,528 since August 16 with mid-level the 2,507 resistance, which overlaps with the 50-period simple moving average (SMA) in the 4-hour chart.
Technically, the stochastic is moving higher, creating a positive divergence as long as the price creates lower lows and the oscillator posts higher highs. This is a sign of a potential upside retracement in the market. However, beneath its trigger and zero lines, the MACD is extending its decline to the downside.
In case of more decreases, it could open the door for a retest of the previous trough of 2,470, while a break beneath the consolidation area may drive the bears until the 200-period SMA at 2,452. A slip below this area may switch the short-term outlook to bearish.
On the flip side, a rally above the 20- and 50-period SMAs, as well as a climb beyond 2,507, may take traders to the previous peaks of 2,528 and 2,531.66.
In summary, the precious metal remains neutral in the near term, with only a rise above 2,531.66 or a fall below the 200-day SMA indicating the next direction in the market.
Data Releases in Line or Below Market Expectations Likely to Trigger the Largest Moves
Markets
US equities went into a tailspin yesterday. The tech-heavy Nasdaq underperformed, racking up losses of 3.26%. Europe’s EuroStoxx50 (-1.22%) painted the perfect bearish engulfer. Volatility spiked with the Vix index jumping to the highest level since the early August market tremors. Stock markets staged an impressive comeback since that meltdown with some indices on Wall Street even eyeballing the previous record highs. Lofty valuations based on a soft landing scenario in the US made them vulnerable for profit-taking. Against that backdrop, yesterday’s unconvincing US manufacturing ISM put markets on edge in the run-up to the remaining, more important publications that include the services ISM and the payrolls report. We also note the further steep decline in commodities (iron, oil …) which markets in current circumstances take as a sign of weak global demand. Risk-off spilled over to core bond markets with yields tumbling between 5.1 and 8 bps in the US and 4.1-7.3 bps in Germany. The 10-yr in the latter more than reversed Monday’s leap higher. Moves in currency markets were as you would expect with the Japanese yen (USD/JPY 145.48), the Swiss franc (EUR/CHF 0.939) and the US dollar (EUR/USD 1.104) securing the top three. Commodity-related currencies such as the AUD, NOK and NZD continue to trade in the defensive.
Yesterday’s price action tells a lot about markets’ state of mind. The balance of risks (in terms of market reaction) has shifted and we think that data releases in line or below market expectations are likely to trigger the largest moves. With about 35 bps of rate cuts priced in for September, there’s additional room towards a 50 bps cut to discount. Today’s JOLTS report could further add to those bets. The downside in core/US yields looks vulnerable with both the US 2-yr and 10-yr near or actually testing the previous August (ex. Aug 5) lows. A break lower would substantially deteriorate the technical picture and with it alter Fed easing expectations, not only for next week but also further out. We stick to the idea that it’s going to be up to Friday’s payrolls to settle the debate though. The dollar would pay a heavy price if the aforementioned unfolds. From a daily perspective we hold a neutral dollar view.
News & Views
Growth in Australia for the third straight quarter printed at a mediocre 0.2% Q/Q and 1.0% Y/Y in Q2. GDP rose 1.5% in the financial year 2023-24. “Excluding the Covid-19 pandemic period, annual financial economic growth was the lowest since 1991-92, the year that included the gradual recovery from the 1991 recession” the Australian Bureau of Statistics assessed. Household spending fell 0.2%, detracting 0.1 ppt from the overall growth. Government spending rose 1.4% Q/Q on continued strength in social benefits programs for health services. Investment (-0.1% Q/Q) fell for the third consecutive quarter. Changes in inventories detracted 0.3 ppts from growth. Net exports contributed 0.2 ppts to growth as exports grew (0.5%) and imports declined (-0.2%). The combination of subdued growth and at the same time ongoing high domestic prices increases and low productivity are a difficult mix for the RBA which until now signaled no room for a rate cut anytime soon. The Aussie dollar loses some further ground this morning after yesterday’s sharp risk-off repositioning (AUD/USD 0.67).
Economic growth in Brazil surprised to the upside in the second quarter, accelerating to 1.4% Q/Q from 0.8% in Q1. Activity was 3.3% higher compared to the same quarter last year. Activity in industry rose 1.8% Q/Q (despite a decline in mining activity) and services grew 1.0%. On the demand side, domestic demand components contributed positively to overall growth but net exports again were a drag (household consumption 1.3% Q/Q, government consumption +1.3%, investment +2.1% exports of goods and services +1.4% and imports +7.6%). In a comment after the release the Brazil Finance Ministry indicated that it might raise the annual growth forecast beyond 2.7% or 2.8% (was 2.5% in July). Strong activity data support the case for the central bank to raise the policy rate at the September meeting.
Graphs
GE 10y yield
The ECB cut policy rates by 25 bps in June and will likely do so again in September. Stubborn inflation (core, services) warrants a cautious approach on follow-up moves. Markets price in two to three more cuts for 2024 as disappointing US and unconvincing EMU activity data rolled in, dragging the long end of the curve down. Yields meanwhile bottomed in the wake of the August market meltdown, preluding a technical correction higher.
US 10y yield
The Fed in its July meeting paved the way for a first cut in September. It turned attentive to risks to the both sides of its dual mandate as the economy is moving to a better in to balance. Markets juggle between 25 and a 50 bps lift-off. The pivot weakened the technical picture in US yields with another batch of weak eco data pushing the 10-yr sub 4%. Powell at Jackson Hole didn’t challenge markets’ positioning.
EUR/USD
EUR/USD moved above the 1.09 resistance area as the dollar lost interest rate support at stealth pace. US recession risks and bets on fast and large (50 bps) rate cuts trumped traditional safe haven flows into USD. EUR/USD 1.12 was tested but survived. A (technical) dollar comeback then kicked in.
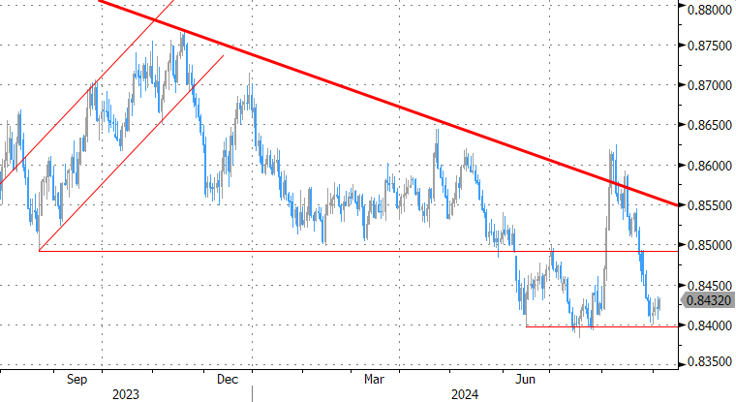
EUR/GBP
The BoE delivered a hawkish cut in August. Policy restrictiveness will be further unwound gradually on a pace determined by a broad range of data. The strategy similar to the ECB’s balances out EUR/GBP in a monetary perspective. Recent better UK activity data and a cautious assessment of BoE’s Bailey at Jackson Hole are pushing EUR/GBP lower in the 0.84/0.086 range.
Research US: Soft Landing Still in Sight
- Economic growth is slowing mostly in line with our expectations, but we think recession risks remain low. We make only marginal adjustments to our forecast profile and see 2024 GDP growth at 2.5% (from 2.3%) and 2025 at 1.5% (unchanged).
- Potential output continues to grow at a brisk pace, supported by increases in labour supply, solid productivity growth and fiscal policy driven demand for manufacturing investments.
- Risks to the outlook remain somewhat skewed to the downside. The current low savings rate indicates that consumers’ buffers remain weak. Slow monetary policy pass-through and high share of fixed rate mortgages suggest that rate cuts will not provide a rapid boost to economic growth, if the outlook deteriorates faster than we expect.
- Inflation forecasts have been adjusted modestly lower. We see headline inflation averaging 2.9% in 2024 (from 3.2%) and 2.2% in 2025 (from 2.5%) and core inflation at 3.3% in 2024 (from 3.4%) and 2.4% in 2025 (from 2.6%). We now expect the Fed to cut interest rates by 25bp at every meeting from September until June 2025 (prev. only every other meeting from September), followed by two final cuts in H2 2025 (terminal rate 3.00-3.25%; prev. 3.75-4.00%).
Economic growth slowed down during the first half of 2024, partly due to negative contribution from net exports but also slowing private consumption and investment growth. Labour market conditions have also cooled faster than expected, but mostly as a result of rapidly growing labour force, as number of layoffs is still low. Overall, we think the US economy remains on a solid footing and the soft landing is still in sight.
In contrast to some European economies, US consumers’ savings rates have remained low throughout the post-pandemic period. Solid labour markets and relatively upbeat consumer sentiment have supported continuous growth in real spending volumes. However, if wage growth cools and concerns around rising unemployment start to set in, consumers’ savings buffers remain weak. Latest retail sales and sentiment indicators suggest that for now, nominal spending growth has remained brisk and optimism about future outlook has risen, but also that consumers are getting increasingly worried about their current economic situation.
Investment growth has also slowed down as tight monetary policy bites into businesses’ expansion plans. Uncertainty about the fiscal policy outlook and especially the future of IRA subsidies might have delayed some investment plans as well. However, we expect overall fiscal policy stance to remain expansionary over the coming years, irrespective of the election outcome. Kamala Harris would likely follow on Biden administration’s footsteps, preserving the IRA as intended while opting for corporate tax hikes to fund the growing deficits. On the other hand, while Donald Trump’s plans for scrapping the IRA and sharply increasing tariffs on imports would have disrupting effects on growth in the near-term, he would also provide support via extending the TCJA income tax cuts from his first term while further reducing corporate taxes. We do not foresee either candidate sharply reducing public budget deficits in the near-term but see higher risk of unsustainable debt dynamics in the case of Trump’s victory.
Inflation has slowed down over the summer, and since our June edition, especially the broader services price pressures have eased noticeably. In addition to easing labour shortages, strong labour productivity growth has continued to alleviate firms’ cost pressures. Rising productivity and labour supply mean that US economy’s potential growth remains elevated. We think that the risk of an outright recession remains low, but still see growth slowing below potential over the coming quarters.
As labour markets are now longer overheated and both realized and expected inflation are cooling, we now expect the Fed to cut rates by 25bp in every meeting from September to June 2025, followed by two final 25bp cuts in H2 2025. As such, we see the nominal terminal policy rate at 3.00-3.25% (prev. 3.75- 4.00%) by the end of 2025.
Expectation of rapid rate cuts has already contributed to easing financial conditions in the markets. On the other hand, slow monetary policy pass-through means that the boost to growth will come with a lengthy delay. 95% of US mortgages are locked into fixed interest rates, and even though mortgage rates have already started to decline, demand for new loans remains low. As recession risks remain low in our view and as FOMC participants have communicated preference for a gradual easing cycle, we do not agree with markets’ speculation about 50bp cuts. But even so, we now think the Fed will cut rates noticeably faster than the ECB, which reflects expectation of continuous growth in the US economy’s productive capacity. The lack of similar slack in the euro area will not, in our view, allow the ECB to cut rates as quickly as the Fed.