Sample Category Title
USD/JPY Mid-Day Outlook
Daily Pivots: (S1) 145.17; (P) 146.62; (R1) 148.04; More...
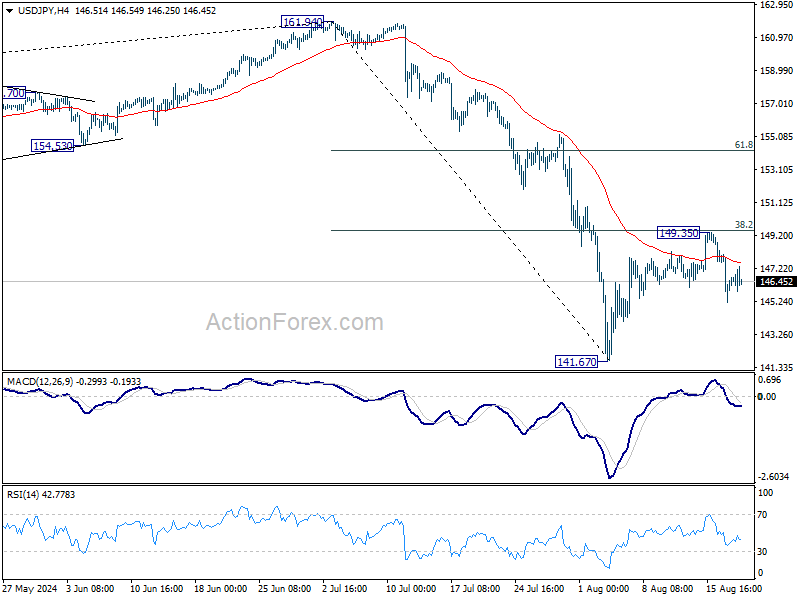
As noted before, USD/JPY's rebound from 141.67 could have completed at 149.35 after rejection by 38.2% retracement of 161.94 to 141.67 at 149.41. Intraday bias stays mildly on the downside for retesting 141.67 low. Firm break there will resume the whole fall from 161.94 to 139.26 fibonacci level next. For now, risk will stay on the downside as long as 149.35 resistance holds, in case of recovery.
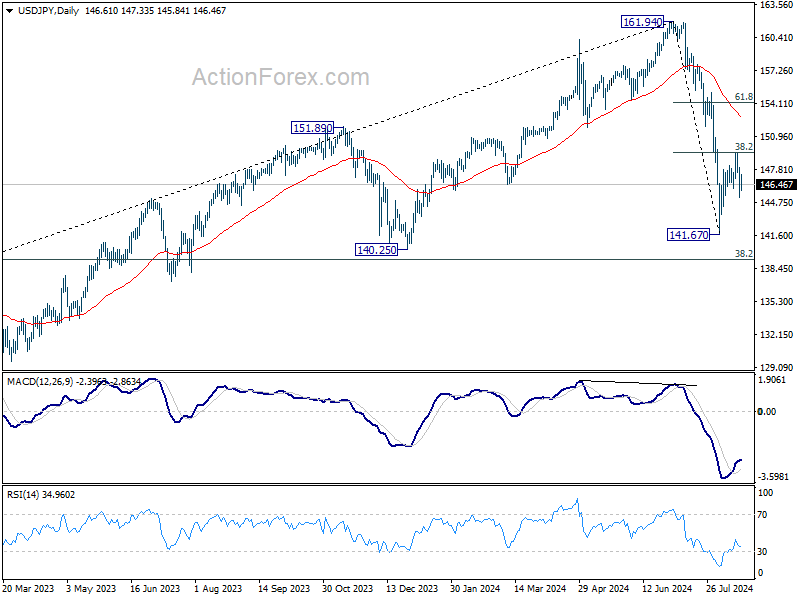
In the bigger picture, fall from 161.94 medium term is seen as correcting whole up trend from 102.58 (2021 low). Deeper decline could be seen to 38.2% retracement of 102.58 to 161.94 at 139.26, which is close to 140.25 support. In any case, risk will stay on the downside as long as 55 W EMA (now at 149.63) holds. Nevertheless, firm break of 55 W EMA will suggest that the range for medium term corrective pattern is already set.
Canada’s CPI slows to 2.5% in Jul, CPI common down to 2.2%
Canada's CPI slowed to 2.5% yoy in July, down from 2.7% yoy in June, aligning with market expectations. This marks the slowest pace of inflation since March 2021. According to Statistics Canada, the deceleration in headline inflation was broad-based, with lower prices for travel tours, passenger vehicles, and electricity contributing to the overall decline.
Core inflation measures also showed signs of easing. CPI median fell from 2.6% yoy to 2.4% yoy, slightly below expectations of 2.5% yoy. CPI trimmed mean slowed from 2.9% yoy to 2.7% yoy, matching expectations, while CPI common edged down from 2.3% yoy to 2.2% yoy, also in line with forecasts.
On a monthly basis, CPI rose by 0.4% mom, exceeding the expected 0.3% mom increase. Notably, gasoline prices jumped 2.4% mom. exerting upward pressure on the headline figure.
Bundesbank expects temporary inflation rise, sees modest economic expansion ahead
In its latest monthly report, Bundesbank cautioned that inflation is expected to "temporarily increase" towards the end of the year. This uptick is anticipated as the currently negative inflation rates for energy turn positive, and the depressed profit margins for mineral oil products begin to recover.
Looking ahead, Bundesbank forecasts slight expansion in Germany's economic output. The report notes that the ongoing weakness in the construction sector and industry—driven largely by weak foreign demand—will likely persist. Despite these challenges, Bundesbank expects growth in private consumption and service sectors during Q3.
The report highlights that with real incomes for private households on the rise, "consumer spending should increase," though it may do so hesitantly. For instance, GfK Consumer Climate Index for July was above the average of the previous quarter, continuing its upward trend from recent months.
EUR/USD Holds Near Seven-Month High Amid Speculation on Fed Rate Cuts
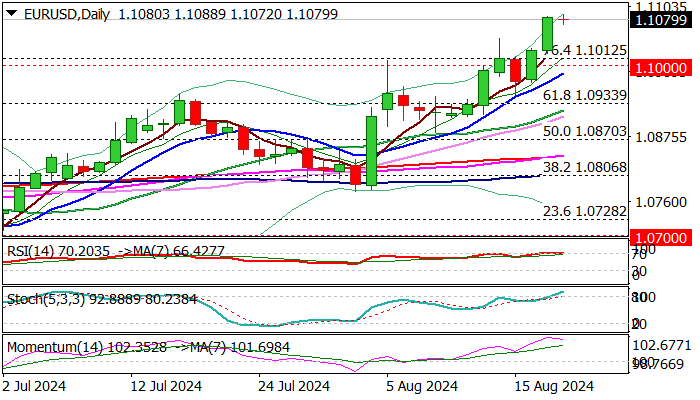
Euro/dollar maintains its position close to a seven-month peak, trading at 1.1077 on Tuesday. The US dollar's weakening continues, largely driven by market expectations of an imminent interest rate cut by the US Federal Reserve next month. Attention is also geared towards Fed Chairman Jerome Powell's upcoming remarks at the Jackson-Hole symposium on Friday.
Market participants anticipate Powell will signal the necessity for a rate reduction. The nuances of his speech will be critically evaluated to discern whether the Fed is leaning towards a moderate 25 basis point cut or a more substantial reduction in September.
While there's a possibility Powell might opt for cautious language to provide the Fed with flexibility to adjust the pace of rate cuts based on future economic data, current conditions seem conducive for at least a 25bp reduction in borrowing costs next month. The Fed could then decide to accelerate cuts depending on subsequent economic indicators.
Until further data becomes available, the US dollar might remain under pressure. So far, EURUSD has appreciated by 2.4% since the start of August, marking the most robust monthly gain since November of the previous year.
Technical analysis of EUR/USD
The EUR/USD has established a consolidation pattern around 1.1020, breaking upwards to reach 1.1080. This growth trajectory appears to have peaked, and the market is now likely to form a consolidation range at these high levels. A downward breakout is anticipated, potentially driving the pair towards 1.0980. A breach of this level could extend losses to 1.0880. The MACD indicator supports this view, with its signal line positioned above zero but poised to decline, suggesting a potential reversal.
On the H1 chart, EUR/USD is currently forming a consolidation range near 1.1080, with a possible expansion to 1.1090. A downward departure from this range could target 1.1020. Following this, a corrective move to 1.1050 may occur before the pair resumes its descent to 1.0990 and potentially extends to 1.0950. This bearish outlook is corroborated by the Stochastic oscillator, which is near the 80 level and anticipated to drop towards 20, indicating a potential decline.
Why Do Oil Prices Post Notable Losses?
- Oil prices have decreased lately as a result of various crucial factors
- Technical Outlook confirms bearish structure
Global economic concerns
The global economy is encountering substantial difficulties, especially in prominent economies such as China and Europe. China's economic expansion has experienced a deceleration below initial projections, resulting in a decrease in industrial operations and a decline in oil demand. Europe has been on the brink of recession due to the disruption of energy supplies caused by the Russia-Ukraine conflict.
Oil production increases
Despite attempts by major oil producers such as Saudi Arabia and Russia to reduce production and maintain current prices, other producers, particularly in the United States, have significantly increased their output. Recently, there has been a 5-6% surge in US oil output, resulting in an excess of supply on the market.
Geopolitical factors
Although geopolitical tensions frequently cause concerns about potential supply interruptions, the current situation in the Middle East has not had a significant impact on oil supplies. However, attention has shifted towards the possibility of a cessation of hostilities in Gaza, which has contributed to the market's lack of predictability.
Despite facing sanctions and geopolitical challenges, Russia has managed to sustain a consistent level of oil output, demonstrating resilience. This resilience has effectively mitigated a substantial decrease in the global oil supply, thereby exacerbating the price slide.
The current decline in oil prices is due to a confluence of factors, including an economic downturn, heightened production levels, seasonal demand fluctuations, and geopolitical influences. These factors are anticipated to continue exerting influence on the industry in the foreseeable future.
Technical Outlook: Daily
- WTI oil battles with uptrend line
- Loses around 8% in one week
WTI crude oil prices have tumbled around 8% after the pullback off the 80.50 resistance level, taking the market well beneath the simple moving average lines and the long-term ascending trend line. If the market closes below the diagonal line, it will support the scenario of steeper decreases. The significant 72.70 support level, which has held since February, could provide immediate support. Even a drop below the 71.30 barrier and the 70.00 round number could serve as a significant turning point.
On the other hand, a recoup of some losses and a climb above 75.20 could open the way for a retest of the SMA lines between 76.88 and 79.65. Above this area, the 80.50 resistance comes next, ahead of the medium-term downtrend line around 82.00.
According to technical oscillators, the RSI is losing momentum beneath the 50 level, while the MACD is ready for a bearish crossover with its red signal line in negative territory in the short-term view.

Technical Outlook: Weekly
- WTI oil holds in symmetrical triangle in weekly chart
- Strong resistance by 200-day SMA at 78.30
Turning to the weekly chart, the price has been developing within a symmetrical triangle since June 2022, with the SMAs exhibiting strong resistance levels between 78.40 and 79.50.
Zooming in on the previous week, the bearish doji candle shows a sign for a potential downside movement, with the first support coming from the 72.70 barrier. A successful plunge beneath the uptrend line could confirm the bearish outlook, hitting the lows in May and December 2023 at 67.80. Falling further, the 64.20 barricade, registered in March 2023, could be a trigger point for traders to continue selling oil prices or be the time for an upside recovery.
Technically, the RSI is pointing down below the neutral threshold of 50, while the MACD is moving with weak momentum marginally below its trigger and zero lines.

Brent Crude – Oil Slides Into Key Support as Geopolitical Risk Takes a Backseat
- Brent crude oil prices continue to fall amidst rumors of a Middle East deal and increased production in Libya.
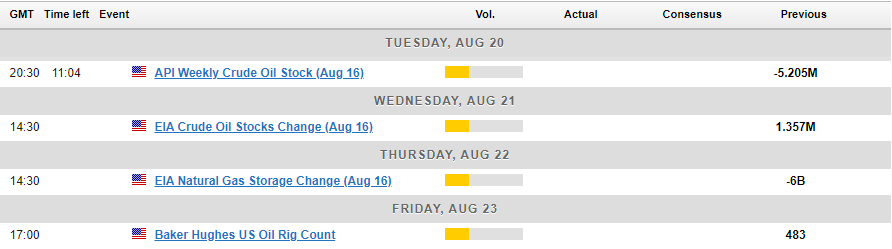
- US crude stockpiles are expected to have decreased, and insights from the Jackson Hole symposium could impact oil prices.
- Technicals point to a key support are. Will we get a short term bounce in Oil prices?
Oil prices are continuing to fall in early European trading, approaching the August 5 low near the $75.00 mark. Brent crude experienced a drop of approximately 2.5% on Monday, fueled by rumors that a Middle East deal might be imminent.
On Monday, U.S. Secretary of State Antony Blinken announced that Israeli Prime Minister Benjamin Netanyahu had accepted a “bridging proposal” from Washington. This proposal aims to resolve disputes hindering a ceasefire agreement in Gaza, with Blinken urging Hamas to also come on board.
Last week’s analysis suggested that the potential for civil war in Libya could support oil prices. However, a recent Reuters report citing two engineers at the Sharara oilfield revealed that production has increased to about 85,000 barrels per day. This boost in production could alleviate concerns about supply disruptions and could be another factor contributing to the current decline in oil prices.
Last week’s trade and output numbers from China also appear to be on the minds of market participants. The print continued a growing trend of disappointing data from the world’s second largest economy.
Inventory Data and Jackson Hole
Oil inventory numbers will once again be in the spotlight, with a preliminary Reuters poll indicating that US crude stockpiles are expected to have decreased by 2.9 million barrels last week. However, given the significant discrepancy in last week’s data, the actual figures could differ substantially.
Later this week, the Jackson Hole symposium will capture the attention of global markets as Central Bank Governors from around the world convene. The most anticipated speech will be from Federal Reserve Chair Jerome Powell. Any insights on potential rate cuts from Powell could be viewed as a positive catalyst for oil prices.
Technical Analysis
From a technical perspective, oil is currently trading within a crucial support zone extending down to the August 5 low around 75.83. This significant support area on the daily chart could present a formidable challenge to break.
Should oil prices bounce from this support zone, they may encounter resistance around 79.00 before targeting the psychological level of 80.00. At this juncture, the newly drawn trendline is likely to come into play, followed by the resistance area at 81.58.
Conversely, a decline from the current price may find support at 76.50 before testing last week’s lows at 75.83.
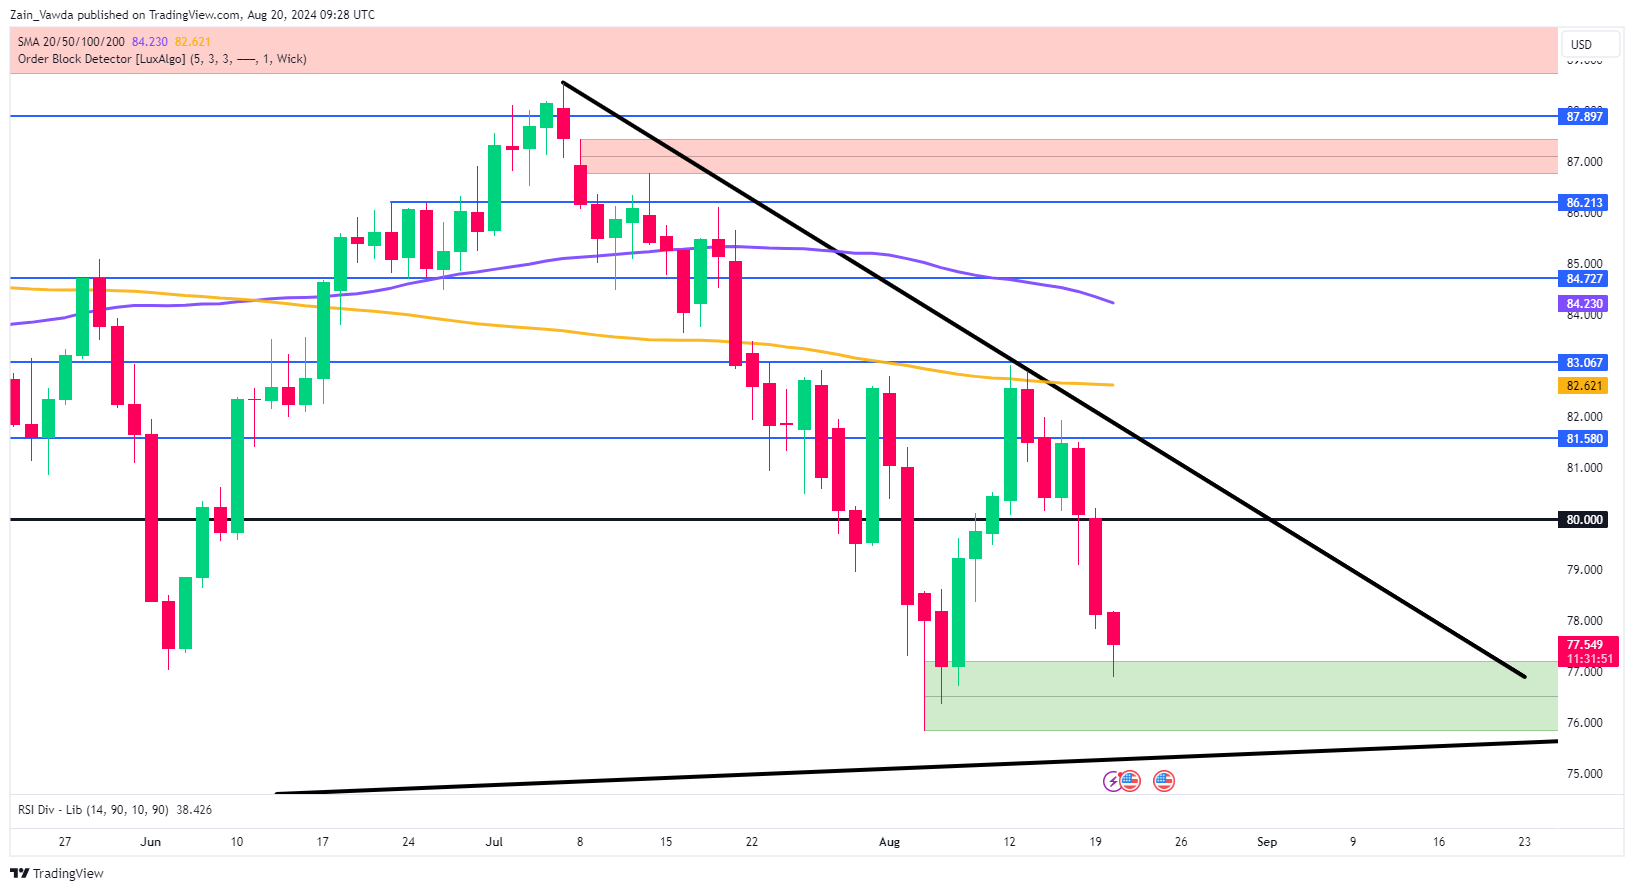
Source: TradingView (click to enlarge)
Support
- 76.50
- 75.83
- 75.00
Resistance
- 78.97
- 80.00
- 81.58
Australian Dollar’s Rally Runs Out of Steam
The Australian dollar has steadied after pummeling the US dollar over the past two sessions. AUD/USD is trading at 0.6729 in the European session, down 0.04% on the day at the time of writing.
RBA minutes: Rates will remain steady
The RBA minutes from the meeting earlier this month reiterated that interest rates aren’t expected to fall anytime soon. RBA members considered raising rates at the meeting but decided that the risks were better balanced by maintaining rates. The members expressed concern about the risk of higher inflation and said that a hike would have been justified if the risks to inflation had risen “materially”. The minutes stated that members considered a rate cut unlikely in the short term and that rates would likely have to remain at current levels for an “extended period”.
Governor RBA has expressed the same hawkish sentiment since the meeting, stating that it was unlikely that the central bank would lower rates in the next six months. The central bank has stuck to its “higher for longer” stance and has held the cash rate at 4.35% for seven straight times. The RBA isn’t about to change its tune, which is out of sync with the markets, which has priced in an initial rate cut in November.
China maintained its Loan Prime Rates at 3.35% for the one-year LPR and 3.85% for the five-year LRP. A month ago, China surprised the markets and lowered the LRP rates in a bid to kick-start the limping economy.
AUD/USD Technical
- There is resistance at 0.6761 and 0.6790
- 0.6706 and 0.6677 are the next support levels

EUR/USD Outlook: Bulls Hold Grip for Further Gains, Shallow Correction Likely to Precede Fresh Push Higher
EURUSD ticked to new 2024 high (1.1088) on Tuesday, but bulls show signs of fatigue after strong rally in past two days.
Fundamentals remain supportive as Eurozone trade surplus strongly widened in June and inflation remained elevated in July, signaling further gains after correction.
Bullish daily studies contribute to positive outlook, but overbought conditions and momentum turning south from new highs warn that bulls might be running out of steam.
Dips should be ideally contained by supports at 1.1000/ 1.0985 zone (broken psychological barrier, reverted to support and daily Tenkan-sen) to keep larger bulls intact for acceleration through 1.1105 (55MMA), towards 1.1139 (Dec 2023 high), guarding 1.1220 (100MMA) and 1.1275 (2023 high).
Close above cracked 200WMA (1.1063) to generate fresh bullish signal.
Res: 1.1088; 1.1105; 1.1139; 1.1220.
Sup: 1.1063; 1.1021; 1.1000; 1.0985.
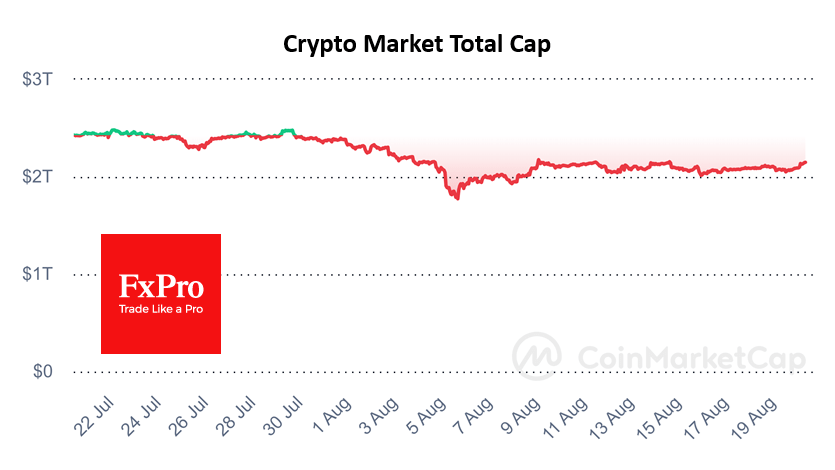
As Crypto Market Tests Resistance, Solana Eyes Support
The cryptocurrency market is once again testing the important $2.15 trillion milestone, adding almost 4% in the last 24 hours. Selling pressure has been building near this level since early August. Now, thanks to the impressive recovery in stock indices, cryptocurrency buyers may feel more confident.
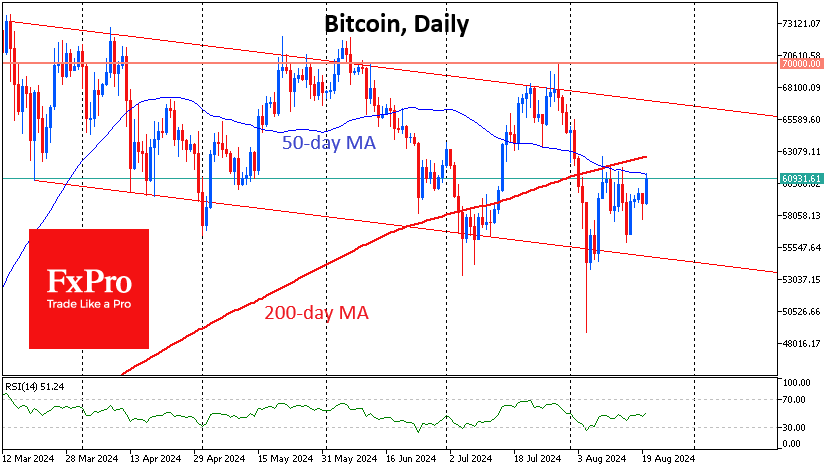
Bitcoin, having added 3.2% since the start of the day and around 4.5% in 24 hours, has once again come close to testing its 50-day moving average, trading just below $61.0K. Overcoming this resistance, from where Bitcoin has been selling off since 9 August, would take it to a test of its 200-day MA near $62.7K. A consolidation above these levels could dramatically improve sentiment in the entire cryptocurrency market and inspire more active buying.
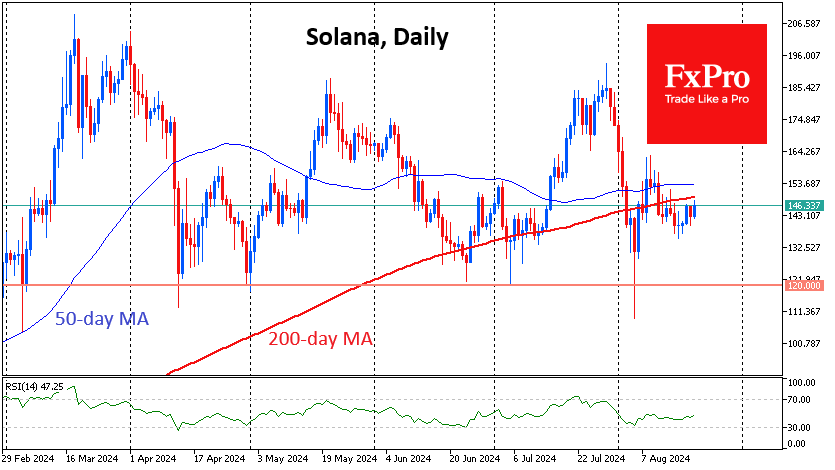
Solana is trading below its 50- and 200-day MAs and near the lower end of its trading range, squeezed by news of the SEC’s doubts about its security status. This reverses the chances that an ETF based on it will be approved soon. Technically, a consolidation under $130 will be an important signal of buyers’ capitulation.
News background
According to CoinShares, crypto fund investments rose by a paltry $30 million last week, following inflows of $176 million the week before. Bitcoin investments rose by $42 million, Ethereum by $4 million, while Solana was hit by a massive outflow of $39 million.
CoinShares noted that Solana is facing its largest outflow of funds amid a sharp decline in trading of the meme coins on which it relies heavily.
BlackRock’s cryptocurrency ETFs have outperformed Grayscale’s products in terms of total assets under management, according to Arkham Intelligence. Just two of BlackRock’s funds – IBIT and ETHA – reached $21.21 billion in AUM, making the largest asset manager the industry leader.
Investment firm Franklin Templeton has filed a Form S-1 with the SEC to launch the Franklin Crypto Index ETF, a combined bitcoin and Ethereum-based exchange-traded fund. Subject to regulatory approval, the firm may add other cryptocurrencies to the product in the future.
Despite Bitcoin falling by a third from its all-time high to its low on 5 August, 74% of coins have not sold or moved in the past six months, according to Glassnode. The holding trend is reducing the available supply, which will lead to higher prices as demand increases.
The Federal Reserve Board of Governors and the Treasury Department’s Financial Crimes Enforcement Network (FinCEN) have proposed amendments to the US Bank Secrecy Act to expand the definition of “money” to include cryptocurrencies and digital assets.
VanEck estimates that Bitcoin miners could generate about $13.9 billion in additional annual revenue by 2027 by shifting 20% of their energy capacity to the AI and high-performance computing sector.
Eurozone CPI finalized at 2.6% in Jul, core CPI at 2.9%
Eurozone CPI was finalized at 2.6% yoy in July, up from June's 2.5% yoy. CPI Core (ex-energy, food, alcohol & tobacco) was finalized at 2.9% yoy, unchanged from June's reading. The highest contribution to the annual inflation rate came from services (+1.82 percentage points, pp), followed by food, alcohol & tobacco (+0.45 pp), non-energy industrial goods (+0.19 pp) and energy (+0.12 pp).
EU CPI was finalized at 2.8% yoy, up from June's 2.6% yoy. The lowest annual rates were registered in Finland (0.5%), Latvia (0.8%) and Denmark (1.0%). The highest annual rates were recorded in Romania (5.8%), Belgium (5.4%) and Hungary (4.1%). Compared with June 2024, annual inflation fell in nine Member States, remained stable in four and rose in fourteen.