Sample Category Title
Fed’s Schmid: Further labor market cooling needed before rate cut
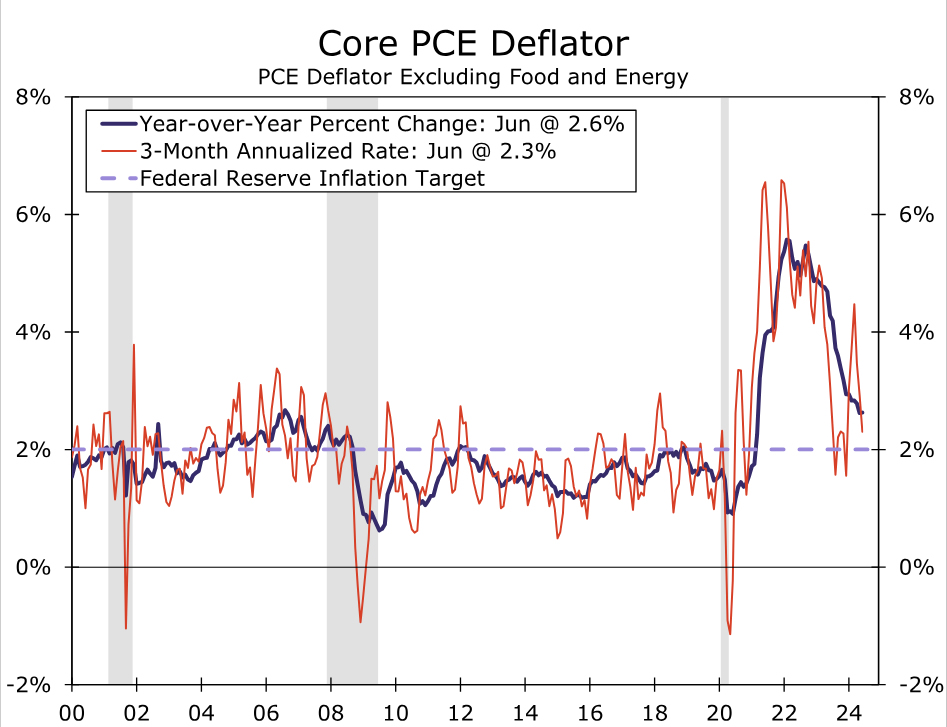
Kansas City Fed President Jeff Schmid acknowledged that while inflation is nearing the Fed's 2% target, currently at around 2.5%, "we are still not quite there."
Nevertheless, "if inflation continues to come in low, my confidence will grow that we are on track to meet the price stability part of our mandate, and it will be appropriate to adjust the stance of policy," Schmid said at a bankers' event overnight.
Despite fears sparked by a weak jobs report, Schmid pushed back against the notion that Fed would need to take aggressive action to avoid a recession. He described the economy as resilient, with strong consumer demand and a labor market that, although cooling, remains "quite healthy."
Schmid noted that Fed's current policy stance "is not that restrictive" and suggested that further cooling in the labor market may be necessary to achieve additional declines in inflation.
Goolsbee: Fed’s focus on economy, not stock market or elections
Chicago Fed President Austan Goolsbee reiterated concerns about the current stance of monetary policy in a Fox interview, warning that maintaining high borrowing costs, even as inflation declines, could further tighten financial conditions and potentially harm the labor market. Goolsbee stressed the importance of balancing monetary policy to avoid unnecessary damage to employment.
He also made it clear that Fed's decisions are driven solely by economic considerations, not by the stock market or political factors. Goolsbee stated, "The Fed's out of the election business. The Fed is in the economic business," emphasizing that the focus remains on maximizing employment and stabilizing prices.
Fed’s Barkin: Disinflation trend positive, economy offers time for deliberate rate decisions
Richmond Fed President Tom Barkin expressed optimism about the ongoing disinflation trend during a virtual event overnight.
Barkin noted that recent data has been encouraging, both in overall levels and across various inflation components, stating that "all the elements of inflation seem to be settling down." He remains "relatively hopeful" that this trend will persist.
Barkin also highlighted that the current economic environment provides some leeway to assess whether the economy is gradually normalizing, which would allow for a steady and deliberate approach to rate adjustments. He pointed out the importance of determining if further aggressive action is necessary, depending on how the economy evolves.
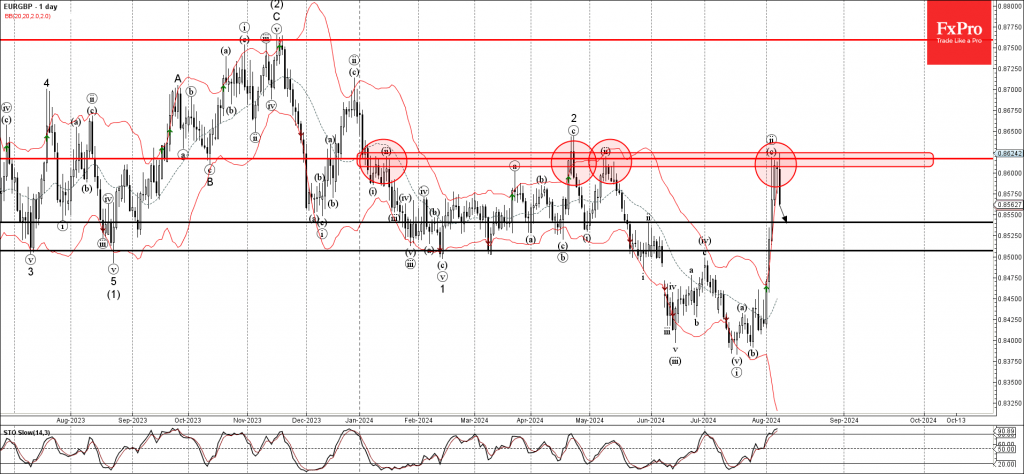
EURGBP Wave Analysis
- EURGBP reversed from resistance zone
- Likely to fall to support level 0.8540
EURGBP currency pair earlier reversed down from the resistance zone set between the pivotal resistance level 0.8620 (which has been reversing the price from January) and the upper daily Bollinger Band.
The downward reversal from the resistance zone created the daily candlesticks reversal pattern Evening Star Doji – which marked the end of the previous correction ii.
Given the strength of the resistance level 0.8620, overbought daily Stochastic and the bullish sterling sentiment, EURGBP currency pair can be expected to fall further toward the next support level 0.8540.
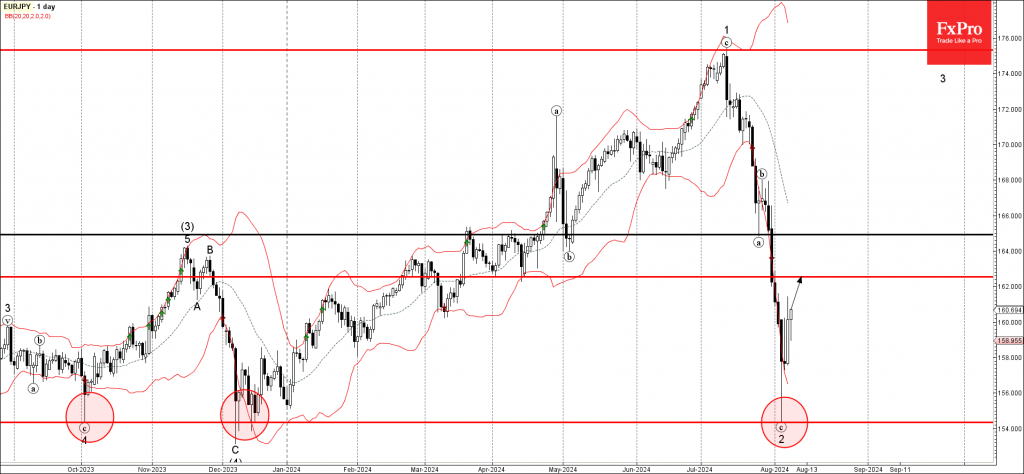
EURJPY Wave Analysis
- EURJPY reversed from support zone
- Likely to rise to resistance level 162.50
EURJPY currency pair recently reversed up sharply from the support zone located between the multi-month support level 154.30 (which has been reversing the price from October) and the lower daily Bollinger Band.
The upward reversal from the support zone created the daily candlesticks reversal pattern Morning Star Doji – strong buy signal for this currency pair.
Given the strength of the support level 154.30, EURJPY currency pair can be expected to rise further toward the next resistance level 162.50.
Oil May Begin a Fresh Climb Soon
Oil prices rose for the third consecutive session on Thursday, driven by easing demand concerns from better-than-expected U.S. job data and escalating tensions in the Middle East. Brent crude increased by 0.73% to $78.90 per barrel, while U.S. West Texas Intermediate climbed 1.16% to $76.10. The market was also influenced by a significant drop in U.S. crude inventories and concerns over potential disruptions in oil supply due to geopolitical tensions. Analysts noted the possibility of Brent prices rebounding to the low-to-mid $80s, citing tight market conditions and ongoing risks. Additionally, Libya's reduced oil production due to protests further supported prices.
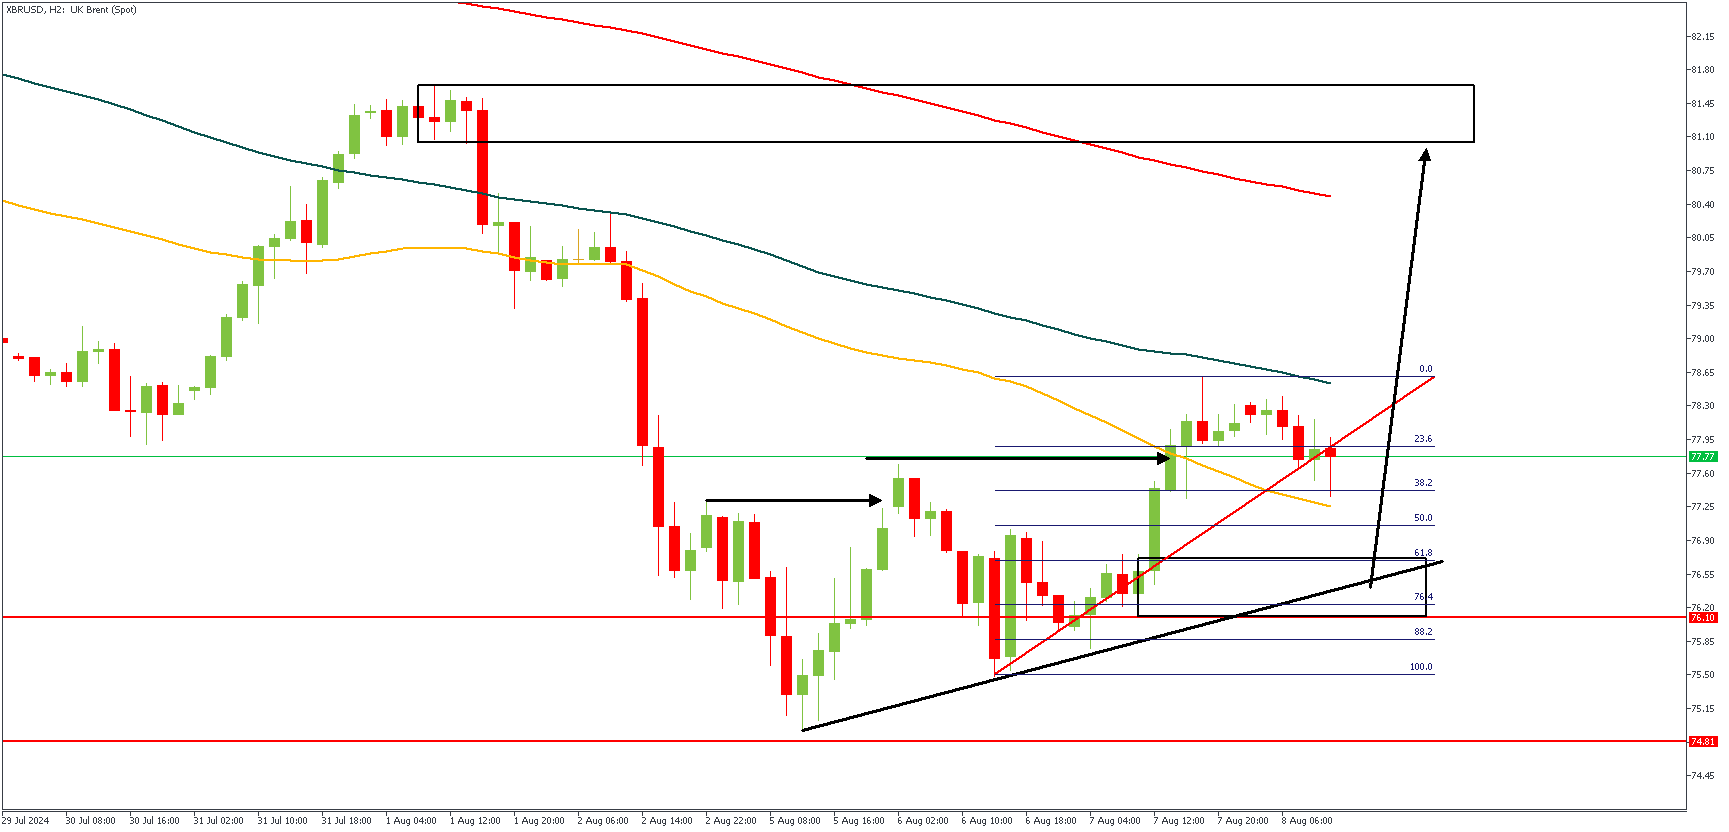
XBRUSD – H2 Timeframe
XBRUSD has recently been rejected off the daily timeframe pivot, with a ‘double break of structure’ price action pattern, a possible bullish sentiment. The trendline support, Fibonacci retracement level, and the drop-base-drop demand zone all point in favor of a bullish outcome. The lower timeframes would, however, provide the basis for an entry in this regard.
Analyst’s Expectations:
- Direction: Bullish
- Target: 81.00
- Invalidation: 75.40
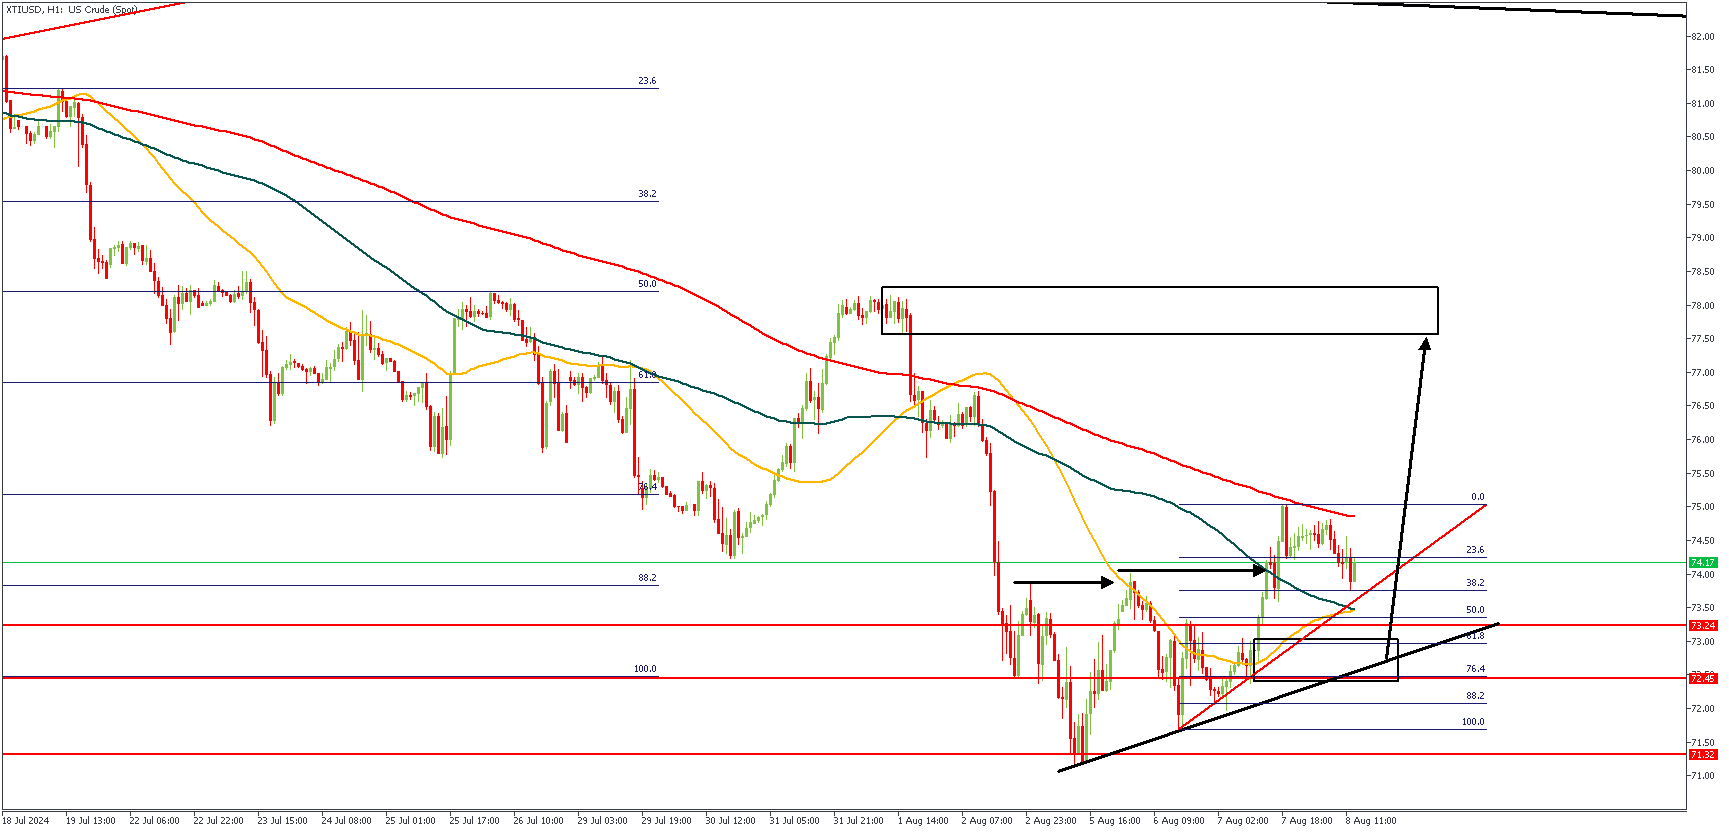
XTIUSD – H1 Timeframe
The 1-hour timeframe chart of the price action on XTIUSD closely mirrors the price action pattern on XBRUSD above; we have the same double-break of structure pattern, the drop-base-rally demand zone, the trendline support, and finally, the 76% of the Fibonacci retracement tool. The sentiment in this regard, is exactly the same: bullish.
Analyst’s Expectations:
- Direction: Bullish
- Target: 77.00
- Invalidation: 71.32
Soft-Landing, or No Soft-Landing, That is the Question: Part I
Part I: A New Toolkit to Predict Soft-Landings, Stagflation and Recessions
Summary
- In this first part of a series of reports, we introduce a new toolkit to predict the probability of soft-landing, stagflation and recessionary episodes.
- Bernanke (2024) reviewed the Bank of England's forecasting process for monetary policymaking, concentrating on the Bank's forecasting and decision-making during times of significant uncertainty. Bernanke outlined some recommendations to design effective policy decisions, placing emphasis on accurately identifying and quantifying risks to the outlook.
- We believe our proposed new framework would help decision makers effectively quantify potential risks to the economic outlook by moving away from the traditional approach of just forecasting recession probability and/or GDP growth rate predictions for the near future.
- The recent monetary policy path has been different from both the recession and the soft-landing projections of 2023, emphasizing the importance of not just concentrating on recession and soft-landing scenarios to forecast policy decisions.
- The toolkit helps analysts identify (a) whether the next phase is a soft-landing, (b) if stagflation is in the near-term picture and (c) whether a recession is coming.
- This report sets the stage by showing why the three economic outlook scenarios are important for monetary policy decisions, particularly in gauging the potential pace of the upcoming easing cycle.
- In the next installment of this series, we quantify historical episodes of soft-landings, stagflation and recessions.
Setting the Stage: A New Toolkit to Quantify Potential Risks to the Economic Outlook
Bernanke (2024) reviewed the Bank of England's forecast process for monetary policymaking, concentrating on the Bank's forecasting and decision-making during times of significant uncertainty, such as in the early years of the post-pandemic era.1 Central bankers around the globe, including in the U.S. and U.K., were challenged by higher inflation and volatile growth rates. For the most advanced economies, the post-pandemic era's higher inflation and volatile growth was, to some extent, different from the post-Great Recession period of muted economic growth and lack of inflation. Naturally, the post-pandemic era requires some new tools to help decision-making. In his review, Bernanke outlined some recommendations to design effective policy decisions, placing emphasis on accurately identifying and quantifying risks to the outlook.
We propose a new framework that would help decision makers effectively quantify potential risks to the economic outlook by moving away from the traditional approach of just forecasting recession probability and/or GDP growth rate predictions for the near future. We suggest characterizing the growth outlook into three different regimes, each of which are structurally different and would require different policy stances. This approach helps decision makers identify (a) whether the next phase is a soft-landing, (b) if stagflation is in the near-term picture and (c) whether a recession is coming. Moreover, the framework would help analysts project when it would be appropriate to (1) expect contractionary policies to fight higher inflation (higher probabilities of stagflation), (2) foresee policy normalization (higher probabilities of soft-landing) or (3) look for the start of expansionary policies (typically during a recession).
We readily acknowledge that, in some ways, predicting the probability of recession may be similar to forecasting the GDP growth rate; however, recession and stagflation predictions help to identify some potential risks to policy decisions. Historically, fighting stagflation is more challenging and may require a different policy path than recessions. For example, the Federal Open Market Committee (FOMC) reduced the fed funds rate in the last four recessions, but raised the fed funds rate to fight inflation in the 1980s stagflation/recessionary episode.
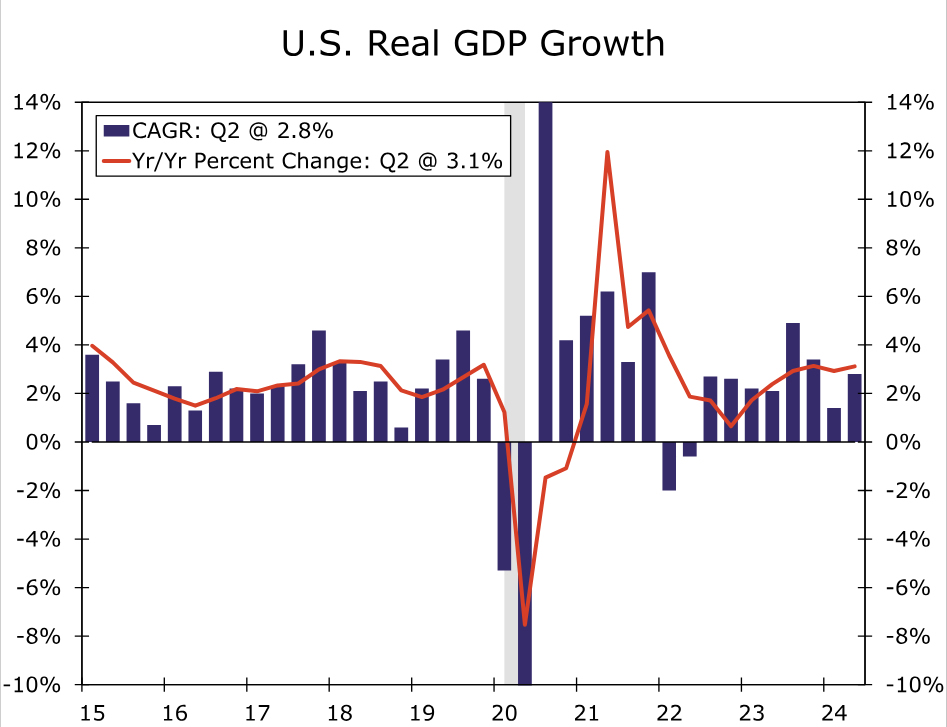
The current cycle stresses the importance of our proposed framework to generate the probabilities of the three suggested scenarios. For example, the past few years have noted talks of recession, stagflation and soft-landing. Members of the FOMC have been busy fighting higher inflation, volatile GDP growth rates and financial market participants' worries about recession and stagflation. Initially, the FOMC characterized the inflation seen after the pandemic as "transitory." When it turned out to be persistent, stagflation fears were raised, especially in the first half of 2022 which saw high inflation levels and negative GDP growth rates. To fight this decades-high inflation, the FOMC enacted the fastest rate hikes in decades. In response to the rapid rate hikes, analysts then predicted a recession. However, the U.S. economy proved resilient and has avoided a recession as of Q2–2024.
In summary, generating a forecast for the GDP growth rate and/or the probability of a recession during the next two quarters is not sufficient. For effective decision-making, it would be better to estimate the probabilities of each scenario (for example, a 30% chance of recession, 50% probability of soft-landing and 20% chance of stagflation). This would provide better information for decision makers who are setting policies for the future path of the economy.
Why is Predicting Recessions Not Enough?
During the 1990s, researchers started forecasting recession probabilities using logit/probit models.2 Recession probability forecasting has turned out to be useful as it helps decision makers by signaling recessions in advance. However, during the past three business cycles—each with the common theme of weaker recoveries—monetary policy stances were expansionary well after the official ending dates of recessions.
Most analysts rely on the NBER recession dates to build models that generate recession probabilities. The NBER employs several variables including GDP, employment and personal income to determine the start and end dates of a recession.3 Since most macroeconomic data are released with a time lag and are prone to revisions, the NBER announcements regarding a recession have start/end date lags. For example, on July 19, 2021, the NBER declared that the 2020 pandemic-era recession ended in April 2020. This announcement came over a year after the official recession end date.
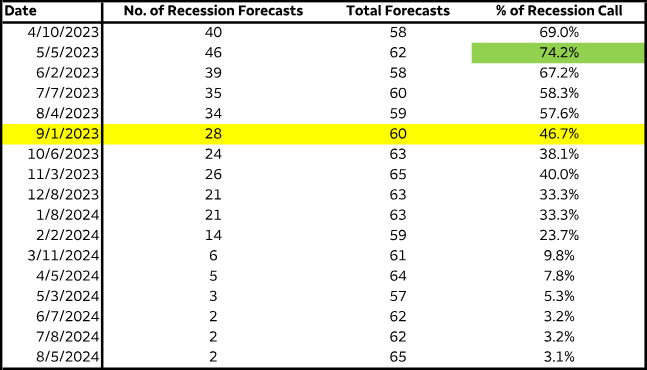
However, monetary policy stances are typically set using near-term forecasts for the economy alongside historical data. That is, a recession forecast for the near-term would play a crucial role in policy decisions, all else equal. For example, most private sector forecasters were predicting a recession back in 2023, as shown in Table 1. Following the "technical recession" definition of two consecutive quarters of negative GDP growth, in April 2023, 40 out of 58 forecasters called for a recession to start some time in 2023. In May 2023, forecasts for a recession peaked, with 74.2% of forecasters expecting a recession.
The private sector forecasters were also calling for an accommodative monetary policy stance similar to that which occurred during the past four recessions in which the Fed reduced the fed funds rate. In May 2023, the Blue Chip Financial survey expected the upper bound of the fed funds rate to peak in Q3–2023 at 5.25%, followed by a rate cut of 25 bps in December 2023. Furthermore, the Blue Chip consensus predicted four more rate cuts in 2024, with the fed funds rate ending at 4.00% by Q4–2024. In other words, a recession prediction was associated with an accommodative policy stance where the FOMC would start reducing the fed funds rate in December 2023.
Why Has the Recent Monetary Policy Path Been Different From the Soft-Landing Projections?
While private sector forecasters expected a recession, most members of the FOMC were predicting a soft-landing. In 2023, the June Summary of Economic Projections (SEP) had a median estimate of 1.0% in 2023 and 1.1% in 2024 for real GDP growth and 5.6% in 2023 and 4.6% in 2024 for the fed funds rate. It is important to note that in June 2023, the fed funds rate was 5.25% and the FOMC expected two more 25 bps rate hikes. This is consistent with a soft-landing prediction—the FOMC expected policy normalization to start sometime in 2024, as the fed funds rate was 100 bps lower (at 4.60%) than the suggested 2023 year-end rate of 5.60%.
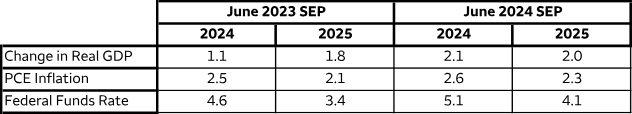
Therefore, two different forecasts—recession vs. soft-landing—were predicting somewhat different paths for the fed funds rate. The private sector's recession forecast was attached to an accommodative policy stance with rate cuts starting in 2023, while the FOMC's soft-landing projections were suggesting more rate hikes in the second half of 2023 along with four 25 bps rate cuts in 2024 (according to the June 2023 SEP).
However, the realized path of the fed funds rates has been different from both the recession and soft-landing calls of 2023. The dual mandate of the FOMC is to foster maximum employment and price stability. However, as stated above, the NBER heavily relies on measures of output, employment and consumption to determine the start and end dates of a recession. Essentially, both the NBER's approach and the theoretical definition of a soft-landing do not explicitly target inflation, even though inflation is part of the FOMC's dual mandate.
Our recent work relies heavily on measures of inflation and output to characterize stagflation into mild, moderate and severe episodes, complimenting the NBER's approach.4 It is important for our framework to capture major risks to the economic outlook in order to accurately predict policy stances.
The realized economic state turned out to be somewhat correlated with our framework of stagflation. Although FOMC members never explicitly acknowledged the risk of stagflation for the current cycle, their changing projections in the SEP are consistent with a stagflation risk. The June 2023 SEP projection of a soft-landing materialized into the actual economic state as of Q2–2024. However, the same SEP forecasted four rate cuts in 2024, and the FOMC has yet to cut this year. In fact, the most recent SEP in June 2024 suggested only one rate cut for the year.
The Upcoming Easing Cycle: Historians (Not History) May Repeat Themselves
In summary, recent years' recession and soft-landing calls were unable to accurately predict the fed funds path, so we should not be looking for a traditional easing cycle. A rate cut at the September meeting is a more likely–than–not scenario, and analysts are gauging the potential duration and magnitude of the easing cycle. As evident in the current cycle, we think concentrating on one risk is short-sighted and that approach would be ineffective to accurately capture the path of the fed funds rate. Instead of expecting a repeat in the last four recessionary experiences in which the FOMC enacted rapid rate cuts, our proposal quantifies the economic outlook into the three scenarios to effectively capture potential risks to the economic outlook. The next report quantifies historical episodes of soft-landings, stagflation and recessions for the post-1950 period. Stay tuned!
Endnotes
1 – Bernanke, Ben. "Forecasting for Monetary Policy Making and Communication at the Bank of England: A Review." Bank of England. April 12, 2024. (Return)
2 – Iqbal, Azhar and Nicole Cervi. "The Smoke Signal is Still Burning: Is Recession Coming?" Wells Fargo Economics. March 21, 2023. (Return)
3 – For more detail about the NBER recession dates, please see the NBER website. (Return).
4 – Iqbal, Azhar, Nicole Cervi and Delaney Conner. "Worst of Both Worlds: Are the Risks of Stagflation Elevated?" Wells Fargo Economics. April 17, 2024. (Return)
USD/CAD Consolidates at Support Ahead of Canadian Employment Data
- USD/CAD found support ahead of Canadian employment data release.
- Positive US jobless claims data boosted sentiment and USD.
- Bank of Canada hopes for moderation in unemployment rate following 50 basis points of cuts.
USD/CAD seems to have found support ahead of crucial employment data set for release tomorrow.
The Canadian economy, particularly its job market, has struggled more than its counterparts, prompting the Bank of Canada (BoC) to lead in the rate cut cycle.
This week, the Canadian Dollar has benefited from a weaker US Dollar and a rebound in oil prices. Additionally, a surprisingly positive trade balance report, which comfortably beat estimates, has provided a further boost.
The Bank of Canada is facing more challenges than many of its peers. The economy’s performance has been lackluster, and with increasing discussions about a global recession, the Central Bank’s task becomes even more complex.
There was a positive today in terms of recessionary fears as US jobless claims came in better than expected. The number of unemployment benefit claims in the US dropped by 17,000 to 230,000 for the period ending August 3rd, falling short of market expectations of 240,000. Despite this decrease, the claim count remains significantly above this year’s average, suggesting that while the US labor market is still historically tight, it has softened from its post-pandemic peak.
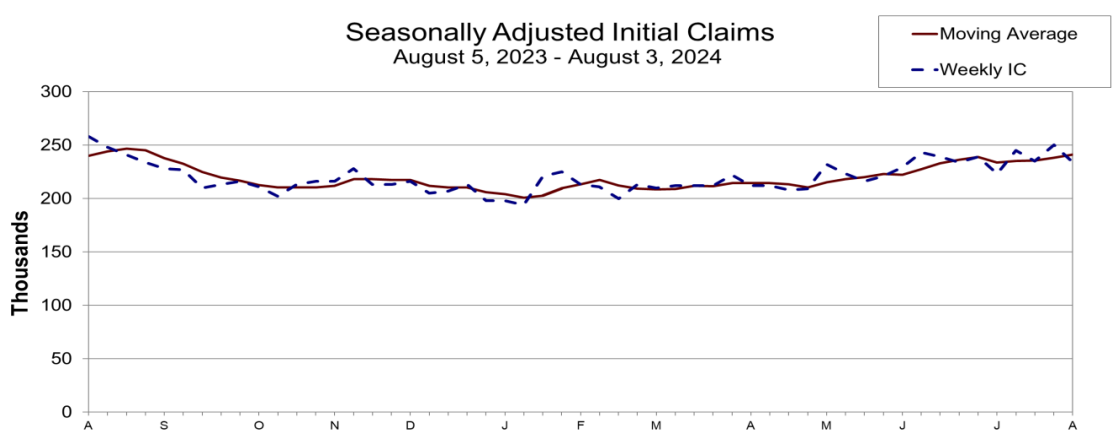
Source: US Department of Labor
The data boosted sentiment, leading to a rise in US equities and an overall improvement in market outlook. The US Dollar index also gained traction and continues its upward trend following the selloff driven by recession fears on Friday and Monday.
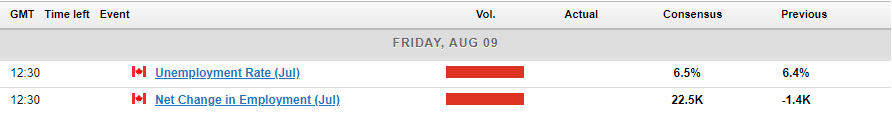
Canadian Employment Data Ahead
Tomorrow will see the release of Canadian unemployment and employment change statistics. Since January, the unemployment rate has been declining, with a brief pause at 6.1% in March and April, before rising to 6.4% in June.
The Bank of Canada will be hoping for a moderation in the unemployment rate following the 50 basis points of cuts already implemented. A positive outcome might be what USD/CAD needs to break the key support level at 1.3736.
Technical Analysis
From a technical perspective, USD/CAD is positioned just above a critical support level at the 1.3736 mark. After failing to sustain levels above 1.3900, my earlier article this week mentioned the 1.3740-30 range as a potential area of interest for a retest.
Analyzing price action and today’s daily candle close could be pivotal. The positive jobs data print helped lift USD/CAD from its support, with the daily candle oscillating between a doji and a hammer pattern. Nevertheless, this could change by the end of the day.
Immediate support is at 1.3736, and a drop below this could lead to a retest of the 1.3690 area, which is also aligned with the 100-day moving average. On the upside, immediate resistance is at 1.3800, followed by levels at 1.3850 and 1.3900.
USD/CAD Chart, August 8, 2024
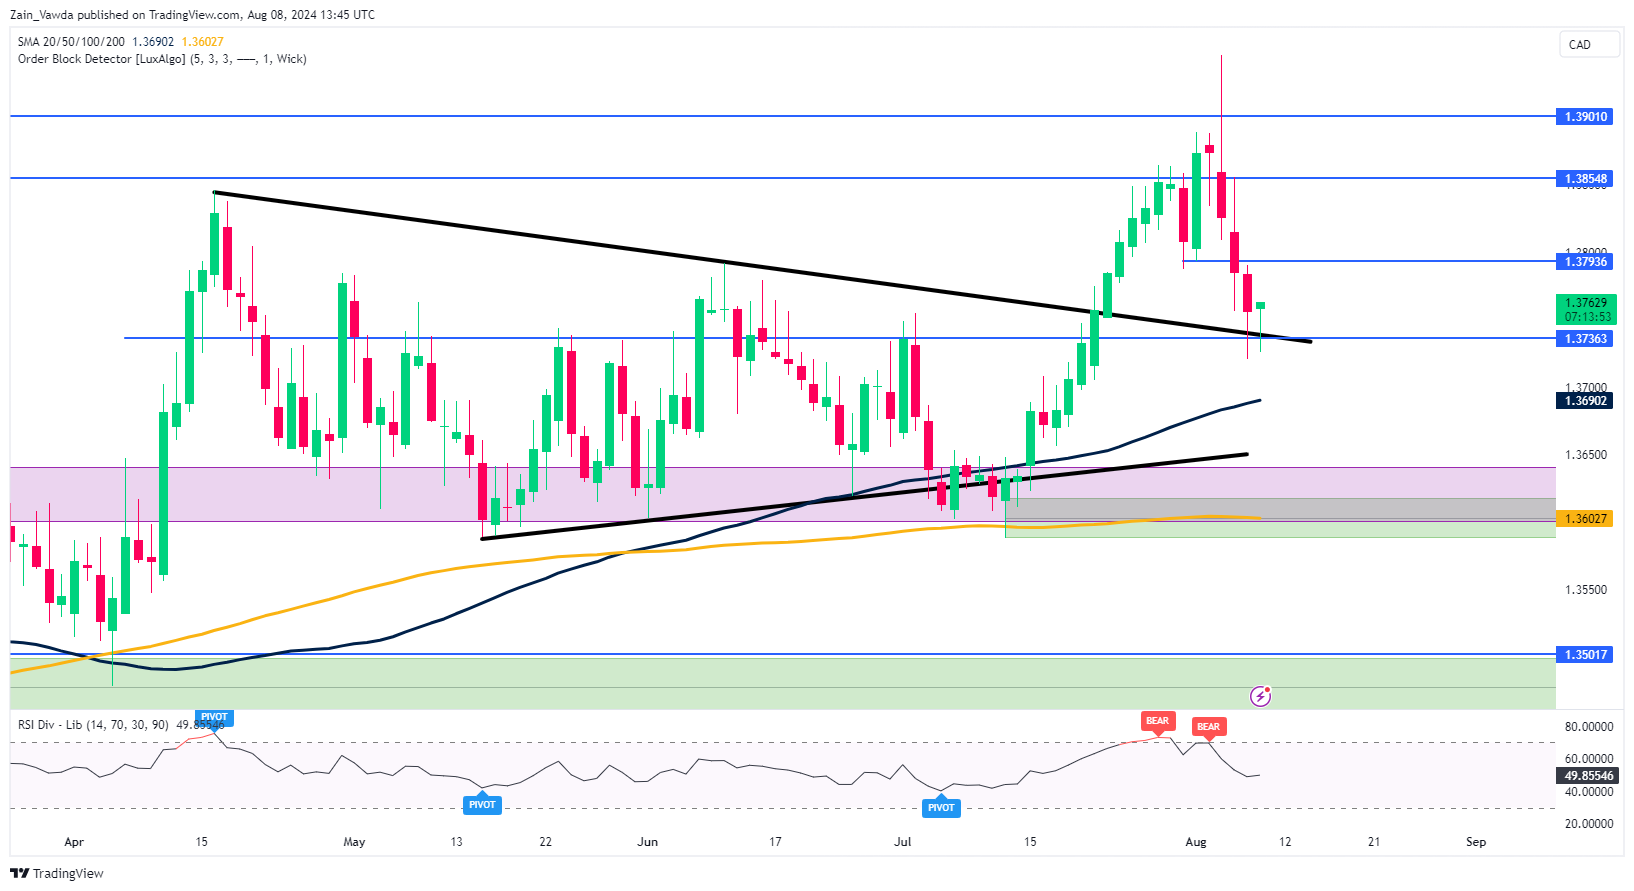
Source: TradingView (click to enlarge)
Support
- 1.3736
- 1.3690
- 1.3650
Resistance
- 1.3800
- 1.3855
- 1.3900
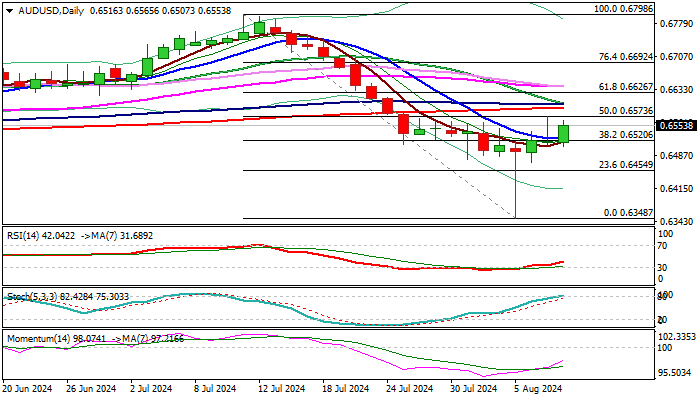
AUD/USD Outlook: Initial Reversal Signal Developing on Daily Chart
AUDUSD regained strength and advanced on Thursday, offsetting negative impact from Wednesday’s strong upside rejection under the base of rising daily cloud.
Several signals point to basing attempts and formation of reversal pattern on daily chart, such as Monday’s Hammer candle with long tail and a bear-trap.
Hammer is also forming on weekly chart, while long-tailed monthly Doji adds to signals that bears are losing traction.
Daily studies are mixed (momentum indicator is in negative territory and MA’s in bearish setup), but thinning and rising daily cloud attracts.
Break of 0.6573 (50% retracement of 0.6796/0.6348/daily Kijun-sen) is needed to boost positive signal for retest of cloud base (0.6599) and attack at Fibo 61.8% (0.66626).
Holding above broken 10DMA (0.6526) is minimum requirement to keep near-term bulls in play.
Res: 0.6573; 0.6592; 0.6601; 0.6626.
Sup: 0.6526; 0.6507; 0.6472; 0.6455.