
Sample Category Title
Aussie Jumps as RBA Says Rates Could Rise
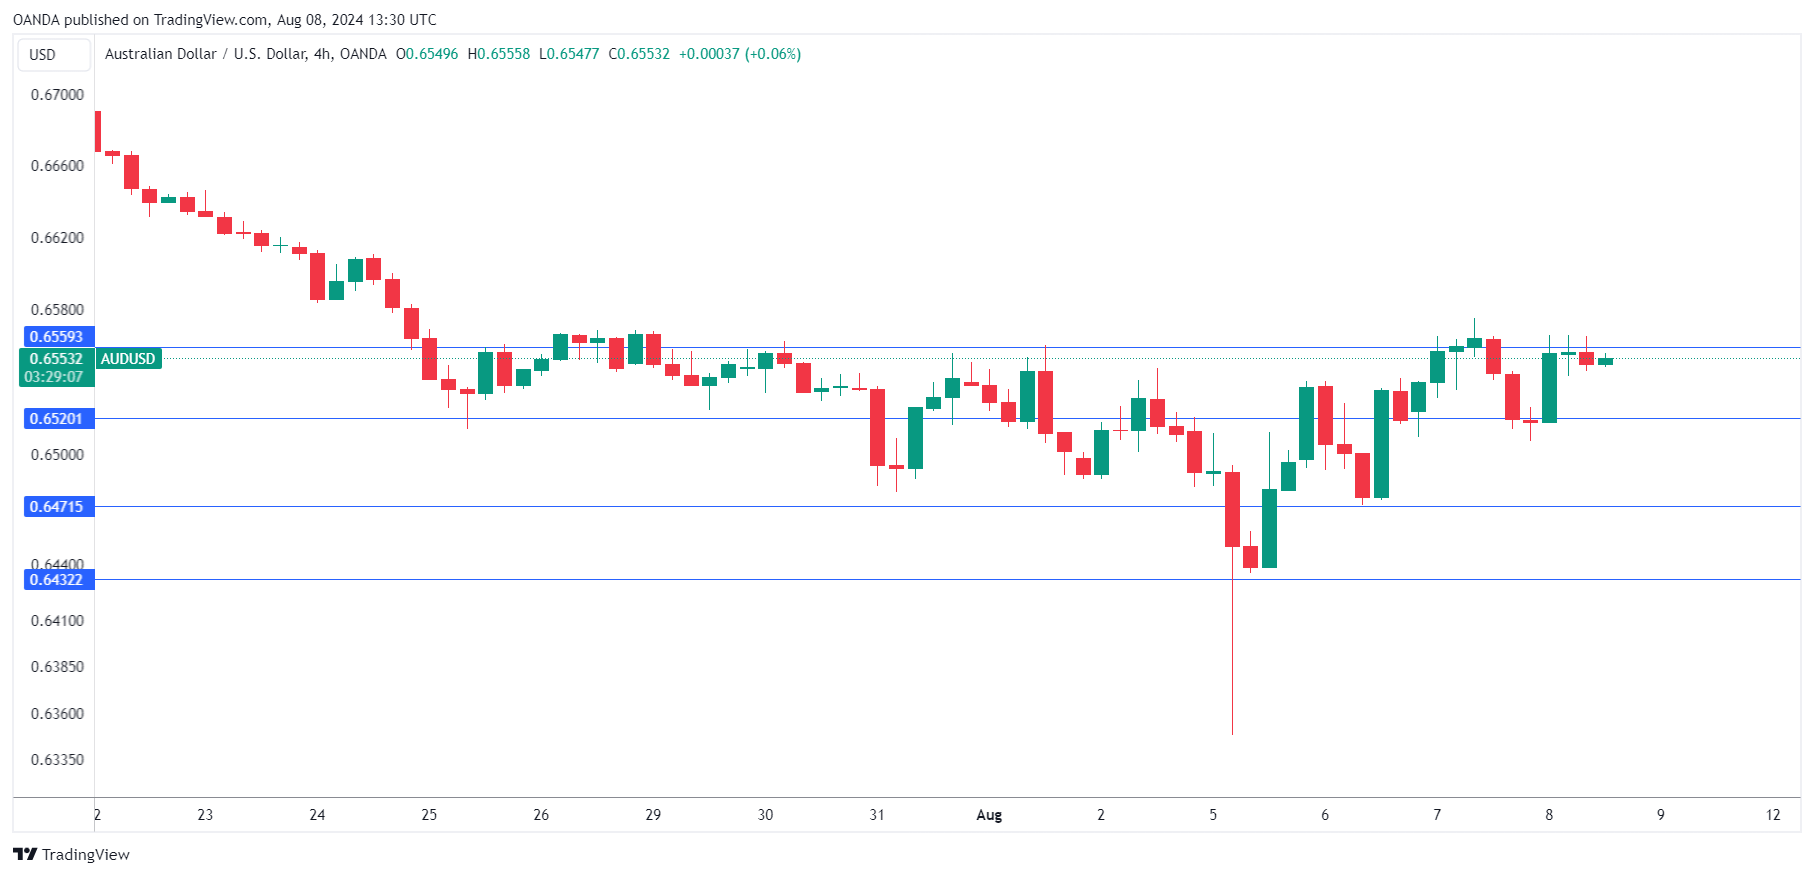
The Australian dollar has had a busy week and is showing strong gains on Thursday. In the European session, AUD/USD is trading at 0.6550, up 0.50% at the time of writing.
RBA’s Bullock says rate hikes still on table
Two days after the Reserve Bank of Australia held the cash rate, Governor Bullock reinforced her hawkish stance on monetary policy. At the meeting, Bullock dropped a bombshell, saying she didn’t expect a rate cut for at least the next six months.
Bullock said earlier today that the central bank wouldn’t hesitate to raise rates if needed, arguing that “the alternative of persistently high inflation is worse”. The RBA discussed the possibility of a rate hike at recent meetings and today Bullock said the RBA board had “explicitly considered” a rate hike at Tuesday’s meeting. The Australian dollar has responded with strong gains to Bullock’s hawkish remarks.
At the Tuesday meeting, the central bank opted to maintain rates at the 12-year high of 4.35% for a seventh straight time. At a time when other major central banks have lowered rates and the mighty Federal Reserve is poised to make an initial cut in September, the RBA could well move in the opposite direction.
The blame can be squarely put on inflation, which remains sticky, especially services prices. The RBA is projecting that CPI, which rose to 3.9% in the second quarter, won’t recede to 2-3% target until late 2025. The labor market continues to remain tight to the large-scale immigration, which will also make it difficult for the RBA to reduce rates.
The financial markets are not marching to Bullock’s hawkish tune and widely expect a rate cut in December. The RBA has a poor track record with its forward guidance, particularly when it pledged in 2020 not to raise rates until 2023 and then hiked in May 2022. As well, the trend among central banks has been to lower rates and the RBA risks becoming an outlier if its raises rates.
AUD/USD Technical
- AUD/USD pushed above resistance at 0.6520 and tested resistance at 0.6559 earlier
- 0.6471 and 0.6432 are the next support levels
Nikkei 225: Potential Bullish Key Reversal Week Aafter 4 Weeks of Decline
- Monday, 5 August significant sell-off in the Nikkei 225 has triggered a potential bullish key reversal inflection week.
- Citigroup Economic Surprise Index for Japan staged a positive turnaround on Monday, 5 August which suggests an improvement in macro data.
- The percentage of Nikkei 225 component stocks trading above their respective 200-day moving averages has reached an extremely low level; a potential capitulation of bearish pressure.
- Watch the 30,460 major key support on the Nikkei 225
Since our last publication, the price actions of Japan’s Nikkei 225 have managed to stage the expected rally and hit a fresh all-time of 42,427 on 11 July 2024, just below the lower limit of 42,600/43,400 medium-term resistance zone.
In the recent two weeks, the Nikkei 225 has succumbed to significant waves of bearish pressure due to a concoction of adverse events; especially via systemic funds flow positioning that led to a disruptive unwinding of risk-on-carry trade strategies.
On Monday, 5 August, the Nikkei 225 plummeted by 12.40%; its worst daily performance since October 1987 “Black Monday” crash. Also, its current 4-week max drawdown (highest to lowest) from the week of 8 July to 13 August stands at -26.60%, its worst 4-week drawdown since the outburst of the Covid-19 pandemic where it shed -31.30% from the week of 17 February 2020 to 16 March 2020.
Interestingly, 3 factors suggest that the climatic sell-off seen on Monday may have triggered a key bullish reversal inflection point for the Nikkei 225.
Fundamentals have improved in Japan
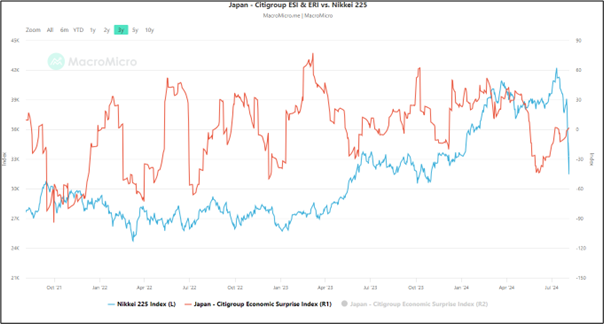
Fig 1: Japan Citigroup Economic Surprise Index as of 5 Aug 2024 (Source: MacroMicro, click to enlarge chart)
The Citigroup Economic Surprise Index (ESI) for Japan has rebounded back to a positive level of 1.60 as of Monday, 5 August after it dipped and remained in negative territory since 16 July (see Fig 1).
The ESI is the sum of the difference between the actual value of various economic data and their consensus forecasts. If the Index is greater than zero, it means that the actual values of these economic data on the aggregate are generally better than expected.
Hence a turnaround of the ESI from negative to positive is considered a potential catalyst to support a strengthening of the Nikkei 225.
Nikkei 225 component stocks above 200-day moving averages hit an extremely low condition

Fig 2: Percent of Nikkei 225 component stocks above 200-day MA as of 8 Aug 2024 (Source: MacroMicro, click to enlarge chart)
Monday, 5 August bloodbath impacted almost all sectors and stocks in the Nikkei 225 as the percentage of its component stocks above their respective 200-day moving averages torpedoed to a low level of 8.44% (see Fig 2).
The current reading of 8.44% is its 8th-lowest level in the past 24 years; prior extreme low levels were recorded in March 2020 (1.33%), March 2009 (2.22%), October 2008 (1.71%), March 2008 (4.46%), January 2008 (3.14%), February 2002 (5.36%), and December 2001 (7.69%).
Also, such extremely low levels have coincided with prior bullish reversal inflection zones for the Nikkei 225.
Therefore, the current 8.44% level of Nikkei 225 component stocks that are trading above 200-day moving averages can be considered as an extreme bearish sentiment outlier, and from a contrary opinion perspective such behaviour may indicate a capitulation of the bearish pressure.
JGB yield curves are still in steepening mode

Fig 3: JGB yield curves major trends as of 8 Aug 2024 (Source: TradingView, click to enlarge chart)
Since June 2022, the steepening of the Japanese Government Bond (JGB) yield curves, both the 10-year minus 2-year and 30-year minus 2-year have moved in direct tandem with the major uptrend phase of the Nikkei 225 (see Fig 3).
The past four weeks of push-down in the JGB yield spreads have started to stage bounces at their respective key medium-term support levels; 0.53% (10-year minus 2-year), and 1.66% (30-year minus 2-year).
Therefore, this set of intermarket dynamics from the potential continuation of the steepening of the JGB yield curves may lead to a positive movement in the Nikkei 225.
Watch the 30,460 major key support on the Nikkei 225

Fig 4: Nikkei 225 major trend as of 8 Aug 2024 (Source: TradingView, click to enlarge chart)
The current price actions of the Nikkei 225 have started to shape an impending weekly bullish reversal “Hammer” candlestick pattern; considered a bullish key reversal week in the lens of technical analysis.
A clearance above 37,070 medium-term resistance (also the 200-day moving average) increases the odds of a medium-term recovery for the next medium-term resistance zone to come in at 42,600/43,400 (see Fig 4).
However, a weekly close below 30,460 long-term pivotal support invalidates the recovery scenario to kick start a potential multi-month corrective decline phase to expose the next major support at 25,770 in the first step.
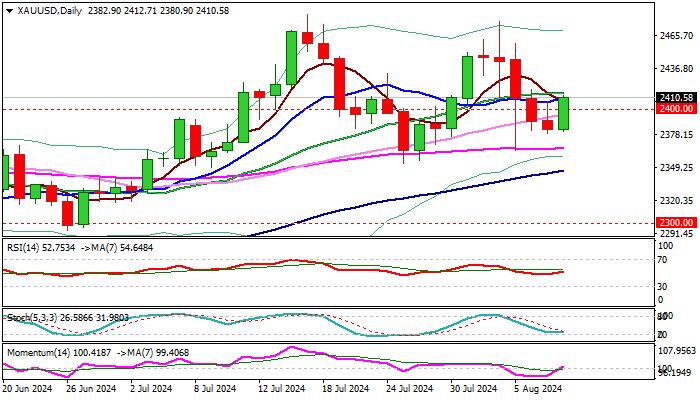
Gold Outlook: Bounces as Bulls Regain Traction After Recent Fall
Gold regained traction and bounced on Thursday, following a sharp fall in past few days.
Fresh strength signals that the situation is stabilizing after a turbulent period and broader bulls are about to re-take control.
The yellow metal benefited from growing signals that the Fed will start cutting interest rates as from September, with US policy easing cycle about to start and deteriorating conditions of the US economy, fueling speculations about stronger than expected initial rate cut (0.5% vs 0.25%).
Economic slowdown and growing US debt concerns are likely to continue to boost gold price, contributing to overall bullish picture.
Technical picture on daily chart is firming, as momentum emerges into positive territory and RSI turns north above neutrality zone, with close above pivots at $2407/14 (Fibo 38.2% of $2477/$2364 / 20DMA) to boost positive signals and open way for further recovery.
Near-term action is expected to remain biased higher while holding above psychological $2400 level.
Res: 2414; 2420; 2434; 2450.
Sup: 2400; 2391; 2379; 2364.
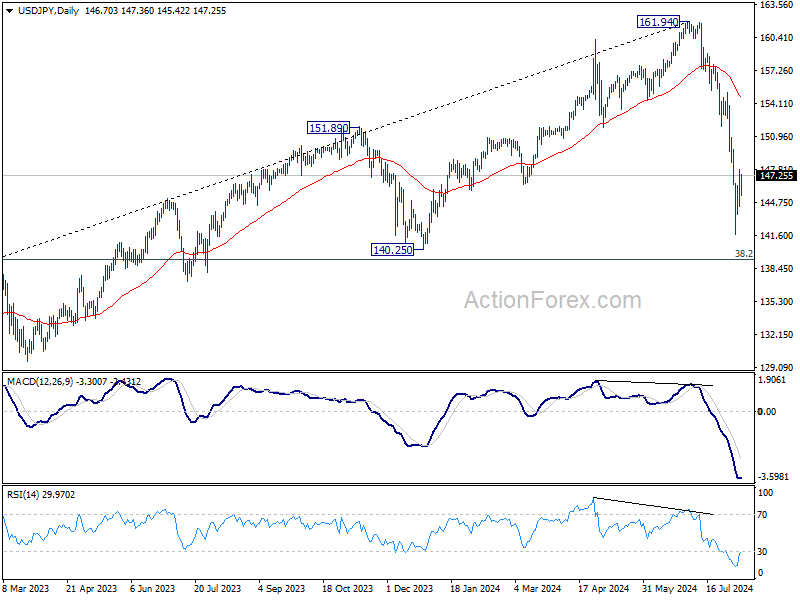
USD/JPY Mid-Day Outlook
Daily Pivots: (S1) 144.69; (P) 146.30; (R1) 148.31; More...
Intraday bias in USD/JPY remains neutral for the moment. While further rise cannot be ruled out, outlook will stay bearish as long as 150.88 resistance holds. On the downside, below 144.04 minor support will bring retest of 141.67 first. Break there will resume the fall from 161.94 to 140.25 support next.
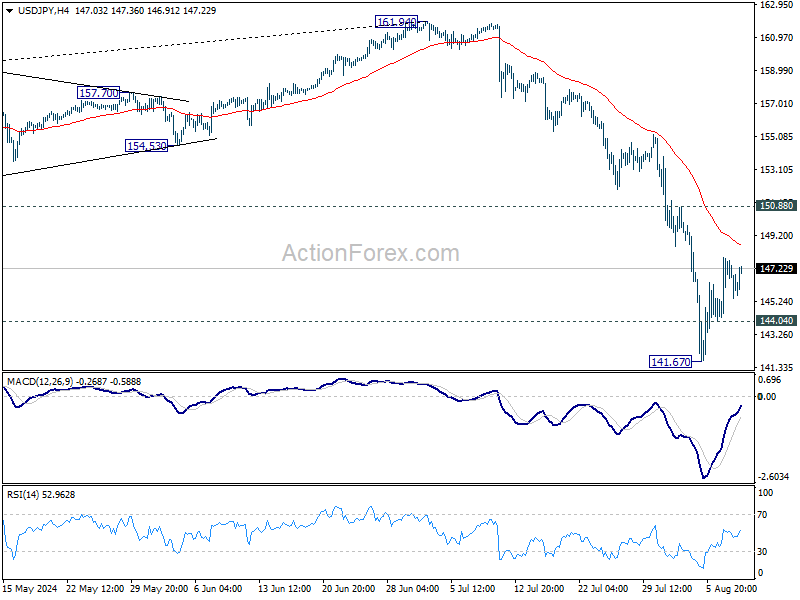
In the bigger picture, the strong break of 55 W EMA (now at 149.98) argue that fall from 161.94 medium term is correcting whole up trend from 102.58 (2021 low). Deeper decline could be seen to 38.2% retracement of 102.58 to 161.94 at 139.26, which is close to 140.25 support. In any case, risk will stay on the downside as long as 55 W EMA (now at 149.83) holds. Nevertheless, firm break of 55 W EMA will suggest that the range for medium term corrective pattern is already set.
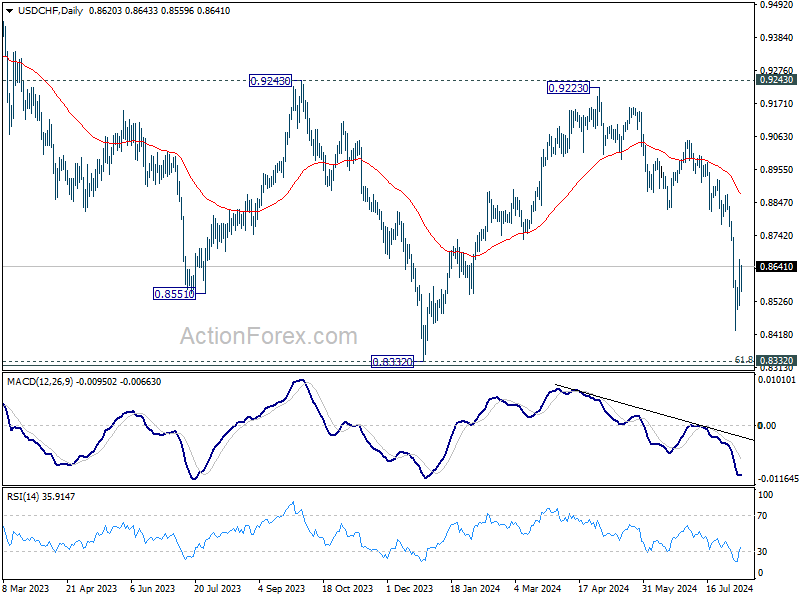
USD/CHF Mid-Day Outlook
Daily Pivots: (S1) 0.8530; (P) 0.8596; (R1) 0.8683; More…
Intraday bias in USD/CHF remains neutral and outlook is unchanged. While recovery from 0.8431 might extend, further decline is expected with 0.8711 resistance intact. On the downside, below 0.8500 will bring retest of 0.8431 first. Break there will resume the fall from 0.9223 to retest 0.8332 low.
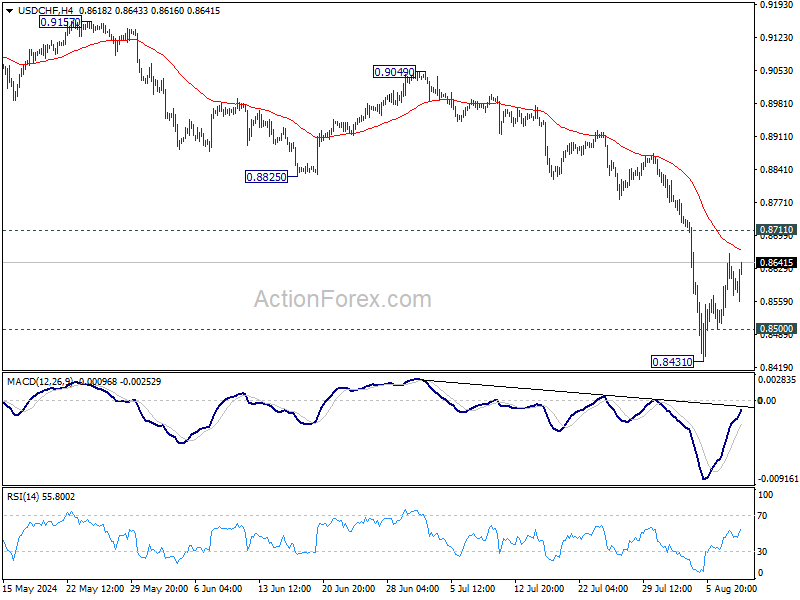
In the bigger picture, price actions from 0.8332 (2023 low) are currently seen as a medium term corrective pattern, with fall from 0.9223 as the second leg. Strong support could be seen from 0.8332 to bring rebound. Yet, overall outlook will continue to stay bearish as long as 0.9243 resistance holds. Firm break of 0.8332, however, will resume larger down trend from 1.0146 (2022 high).
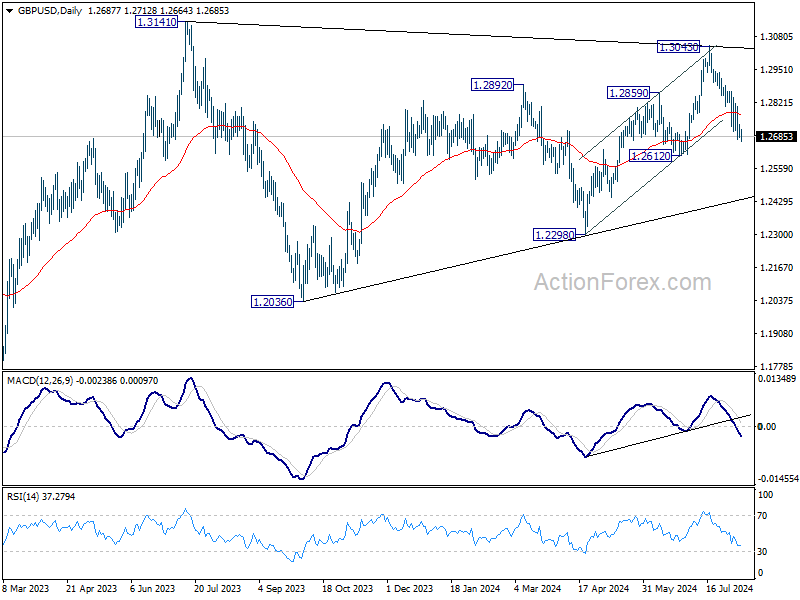
GBP/USD Mid-Day Outlook
Daily Pivots: (S1) 1.2669; (P) 1.2703; (R1) 1.2726; More...
Intraday bias in GBP/USD remains on the downside at this point. Fall from 1.3043 should continue to 1.2612 support. Decisive break there should confirm that rise from 1.2298 has completed, and target this support next. However, break of 1.2839 resistance will argue that the pull back from 1.3043 has completed and turn bias back to the upside.
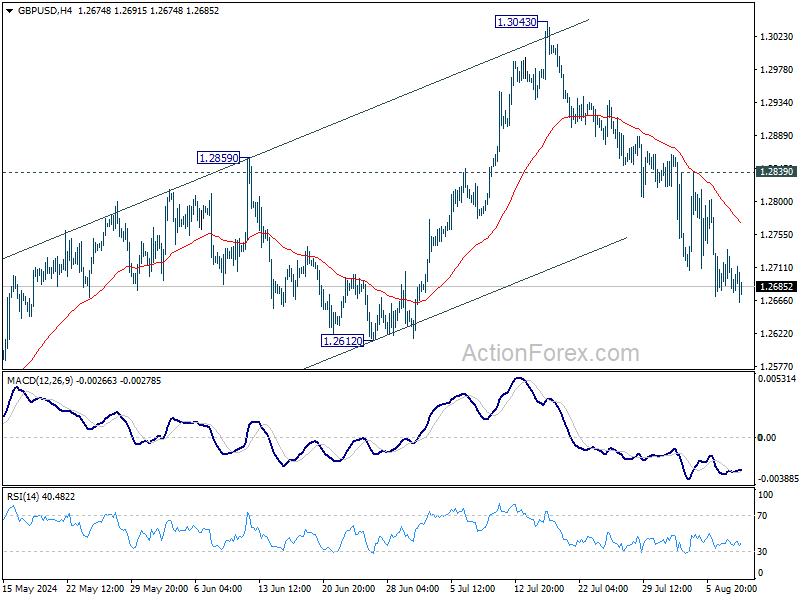
In the bigger picture, current development suggests that corrective pattern from 1.3141 is extending with fall from 1.3043 as another leg. Break of 1.2612 support would strengthen this case. But still, downside should be contained by 1.2036/2298 support zone even in case of deep decline. Rise from 1.0351 (2022 low) remains in favor to resume at a later stage.
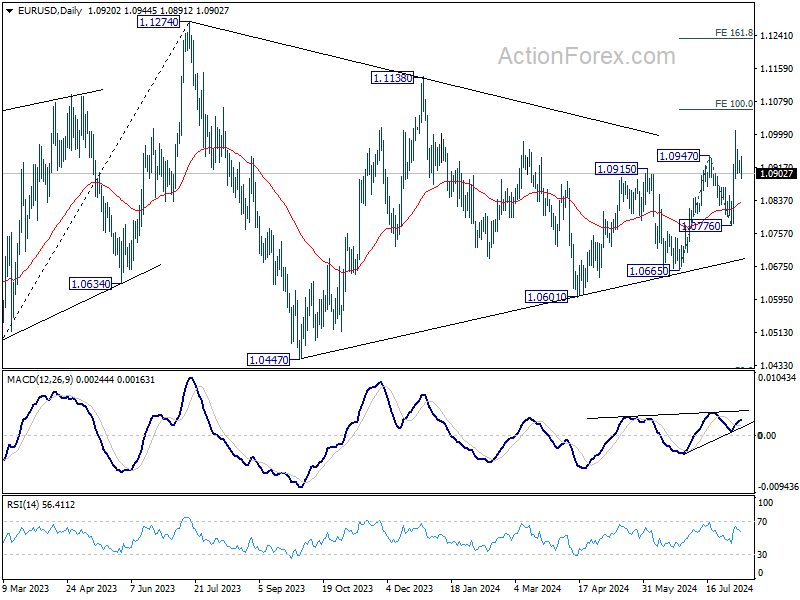
EUR/USD Mid-Day Outlook
Daily Pivots: (S1) 1.0907; (P) 1.0922; (R1) 1.0938; More.....
EUR/USD dips mildly in early US session as consolidation from 1.1007 extends. Intraday bias remains neutral first. While deeper retreat cannot be ruled out, downside should be contained well above 1.0776 support. On the upside, above 1.0944 minor resistance will bring retest of 1.1007 first. Further break there will resume recent rally from 1.0665 to 100% projection of 1.0665 to 1.0947 from 1.0776 at 1.1056 next.
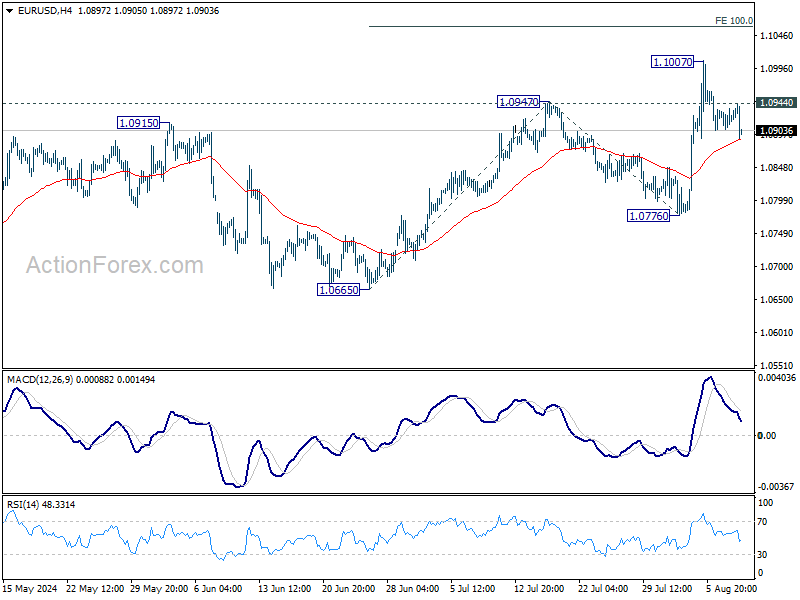
In the bigger picture, price actions from 1.1274 are viewed as a corrective pattern that's still be in progress. Break of 1.1138 resistance will be the first signal that rise from 0.9534 (2022 low) is ready to resume through 1.1274 (2023 high). However, break of 1.0776 support will extend the correction with another falling leg back towards 1.0447 support.
Dollar Gains Slightly after Jobless Claims, Calm Forex Trading Continue
Forex trading continues to be subdued today, with Dollar gaining slightly in the early US session after better-than-expected jobless claims data. This data is particularly crucial as market participants are closely monitoring employment figures following the triggering of the Sahm Rule, which signals potential rapid employment deterioration leading to a recession. However, so far, there are no signs of such a downturn in materializing.
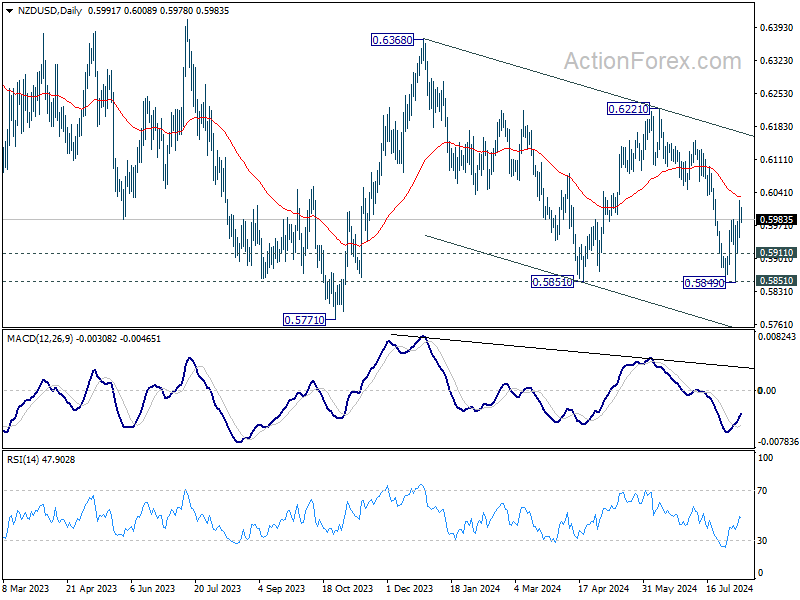
In the broader currency market, the dynamics remain largely unchanged. Canadian Dollar is leading among commodity currencies, maintaining its position as the strongest performer this week. Conversely, British Pound is the worst performer, followed by Swiss Franc and Japanese Yen. Dollar and Euro are holding their positions in the middle of the pack. Notably, the strength of the commodity currency rebound is relatively weak, as is the pullback in Yen and Franc, indicating that the market is in a consolidation phase, likely awaiting a resurgence of risk-off sentiment.
Technically, while NZD/USD rebounded strongly this week, it struggled to break through falling 55 D EMA (now at 0.6030). Break of 0.5911 minor support would indicate rejection by the EMA and bring retest of 0.5849/51 support zone. Firm break there will resume the whole fall from 0.6368 to 0.5771 low. Nevertheless, firm break of the EMA would bring stronger rebound towards channel resistance (now at 0.6170).
In Europe, at the time of writing, FTSE is down -1.21%. DAX is down -0.67%. CAC is own -1.12%. UK 10-year yield is up 0.0230 at 3.977. Germany 10-year yield is down -0.006 at 2.265. Earlier in Asia, Nikkei fell -0.74%. Hong Kong HSI rose 0.08%. China Shanghai SSE rose 0.00%. Singapore Strait Times rose 0.37%. Japan 10-year JGB yield fell -0.0477 to 0.833.
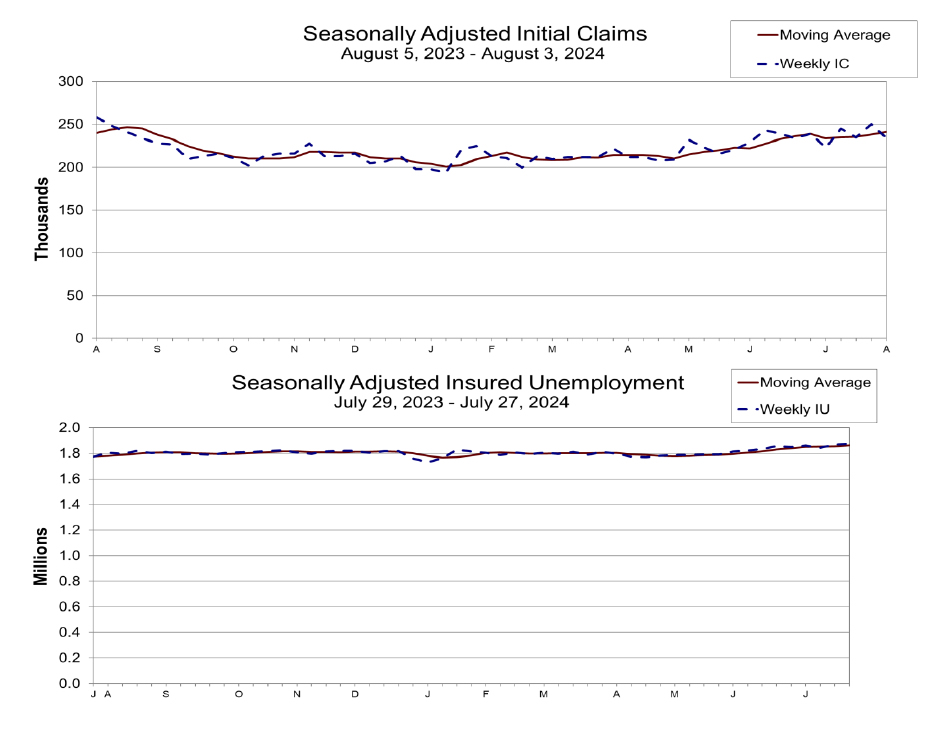
US initial jobless claims fall to 233k, below exp 245k
US initial jobless claims fell -17k to 233k in the week ending August 3, lower than expectation of 245k. Four-week moving average of initial claims rose 2.5k to 241k.
Continuing claims rose 6k to 1875k in the week ending July 27, highest since November 21, 2021. Four-week moving average of continuing claims rose 7k to 1869k, highest since November 27, 2021 too.
One BoJ member suggests gradual rate hike to above 1% neutral rate
BoJ's Summary of Opinions from the July 30-31 meeting reveals that board members discussed further rate hikes after implementing the second interest rate increase this year at the meeting.
One member's opinion stood out, suggesting that, assuming the price stability target is achieved in the second half of fiscal 2025, BoJ should raise the policy interest rate to the level of the "neutral interest rate." This neutral rate is estimated to be "at least around 1 percent." To avoid rapid hikes, BoJ should increase the policy interest rate in a "timely and gradual manner."
The consensus among members is that economic activity and prices have been developing generally "in line with the Bank's outlook." Consequently, it is deemed appropriate for to raise the policy interest rate and adjust the degree of monetary accommodation.
One opinion highlighted that raising interest rates at a "moderate pace" aligns the adjustment in monetary accommodation with underlying inflation. Such moves "will not have monetary tightening effects."
RBA's Bullock: Rate hikes still possible as inflation timeline extends
RBA Governor Michele Bullock revealed in a speech today that the board "explicitly considered" another rate hike during Tuesday's meeting. Although they decided to hold rates steady, Bullock stressed that RBA "will not hesitate" to hike if necessary.
Bullock highlighted two main points from the meeting. First, despite weak economic growth, the gap between aggregate demand and supply is "larger than previously thought," leading to "persistent inflation." Second, demand growth is expected to "pick up over the next year," though there is significant uncertainty about this outlook.
Due to these factors, the Board's inflation target timeline has been "pushed out". "We don't expect to be back in the 2–3 percent target range until the end of 2025 – over a year away," Bullock stated. This delay prompted the board to consider another rate hike to ensure inflation continues to decline.
Ultimately, RBA decided to keep interest rates unchanged, believing this would balance their inflation and employment objectives. However, Bullock emphasized that the Board remains vigilant regarding upside inflation risks and "will not hesitate to raise rates if it needs to."
RBNZ inflation expectations drop across all horizons
RBNZ latest Survey of Expectations showed a notable decline in inflation expectations across all time horizons. One-year-ahead annual inflation expectations fell by 33 basis points, dropping from 2.73% to 2.40%. This marks the sixth consecutive quarterly decline since June 2023.
The two-year-ahead inflation expectations, a closely monitored indicator, also saw a decrease from 2.33% to 2.03%. These expectations are now below the average level observed since 2002, indicating a substantial shift in business outlook regarding future inflation.
Long-term expectations followed a similar trend. Five-year-ahead inflation expectations decreased to 2.07%, while ten-year-ahead expectations dropped to 2.03%.
Survey respondents also provided their outlook on the OCR. On average, they expect OCR to be 5.40% by the end of the September 2024 quarter, with a projected decrease to 4.24% by the end of June 2025. The current OCR stands at 5.50%.
EUR/USD Mid-Day Outlook
Daily Pivots: (S1) 1.0907; (P) 1.0922; (R1) 1.0938; More.....
EUR/USD dips mildly in early US session as consolidation from 1.1007 extends. Intraday bias remains neutral first. While deeper retreat cannot be ruled out, downside should be contained well above 1.0776 support. On the upside, above 1.0944 minor resistance will bring retest of 1.1007 first. Further break there will resume recent rally from 1.0665 to 100% projection of 1.0665 to 1.0947 from 1.0776 at 1.1056 next.
In the bigger picture, price actions from 1.1274 are viewed as a corrective pattern that's still be in progress. Break of 1.1138 resistance will be the first signal that rise from 0.9534 (2022 low) is ready to resume through 1.1274 (2023 high). However, break of 1.0776 support will extend the correction with another falling leg back towards 1.0447 support.
Economic Indicators Update
| GMT | Ccy | Events | Actual | Forecast | Previous | Revised |
|---|---|---|---|---|---|---|
| 23:50 | JPY | BoJ Summary of Opinions | ||||
| 23:50 | JPY | Bank Lending Y/Y Jul | 3.20% | 3.20% | 3.20% | |
| 23:50 | JPY | Current Account (JPY) Jun | 1.78T | 2.29T | 2.41T | |
| 03:00 | NZD | RBNZ Inflation Expectations Q/Q Q3 | 2.03% | 2.33% | ||
| 05:00 | JPY | Eco Watchers Survey: Current Jul | 47.5 | 47.8 | 47 | |
| 12:30 | USD | Initial Jobless Claims (Aug 2) | 233K | 245K | 249K | 250K |
| 14:00 | USD | Wholesale Inventories Jun F | 0.20% | 0.20% | ||
| 14:30 | USD | Natural Gas Storage | 22B | 18B |
US initial jobless claims fall to 233k, below exp 245k
US initial jobless claims fell -17k to 233k in the week ending August 3, lower than expectation of 245k. Four-week moving average of initial claims rose 2.5k to 241k.
Continuing claims rose 6k to 1875k in the week ending July 27, highest since November 21, 2021. Four-week moving average of continuing claims rose 7k to 1869k, highest since November 27, 2021 too.
Japanese Yen (JPY) Price Action: Following Dovish BoJ Comments, What Does Price Action Tell Us?
- The Bank of Japan (BoJ) released their summary of opinions, accompanied by bearish comments from BoJ policymakers.
- Geopolitical concerns could bolster the Yen, but the safe haven appeal might be divided among the US Dollar, Yen, and Swiss Franc.
The Bank of Japan (BoJ) has released their summary of opinions, accompanied by some bearish comments from BoJ policymakers. BoJ Deputy Governor Shinichi Uchida softened some of Governor Ueda’s more aggressive remarks, aiding in market stabilization.
The BoJ noted that the probability of reaching the inflation target has risen, but the Central Bank also anticipates some upward pressure. The BoJ projects that inflation will hit the target by the second half of 2025. This scenario presents an intriguing question for market participants and could position the Yen strongly next year.
While central banks worldwide are cutting rates, the BoJ plans to tighten and raise rates. This could propel the Yen to the forefront of gains in 2025. Although there is a considerable journey ahead, it is something to keep in mind.
In the short term, Yen pairs remain interesting yet face downside pressure. Geopolitical concerns could bolster the Yen. However, the safe haven appeal might be divided among the US Dollar, Yen, and Swiss Franc, potentially negating Yen gains against the Dollar but benefiting it against the Euro and GBP.
Technical Analysis
USD/JPY
From a technical perspective, USD/JPY has rebounded strongly and formed an imperfect morning star candlestick pattern. Typically, such a pattern signals a bullish move, but various factors need to be considered.
From a price action viewpoint, the H4 chart has shown higher highs and higher lows since bottoming out at 141.67 on Monday, suggesting a potential return to the 150.00 level in the coming days.
What could invalidate the bullish move? An H4 candle closing below the recent lower swing high around 144.25 would invalidate the bullish outlook. This would break the current structure and could drive the Yen to retest the psychological 140.00 level.
A move higher from here faces immediate resistance at 148.00 before the 150.00 psychological level comes into focus.
USD/JPY Daily Chart, August 8, 2024
Source: TradingView (click to enlarge)
Support
- 145.00
- 144.00
- 141.65
Resistance
- 148.00
- 150.00 (psychological level)
- 150.87
GBP/JPY
GBP/JPY is mirroring the USD/JPY chart, currently trading just above the important support level at 185.00. The H4 chart shows a similar pattern to USD/JPY, with higher highs and higher lows since Monday’s dip just below the 180.00 mark.
Bulls are in control for the moment, but a break and H4 candle close below 183.30 would invalidate the bullish structure. This could lead to a retest of recent lows and possibly a move towards the 175.00 level.
On the upside, resistance is found at 187.65, followed by the 190.00 mark. Beyond 190.00, there’s a resistance zone around 192.00 before the descending trendline becomes relevant.
GBP/JPY Four-Hour (H4) Chart, August 8, 2024
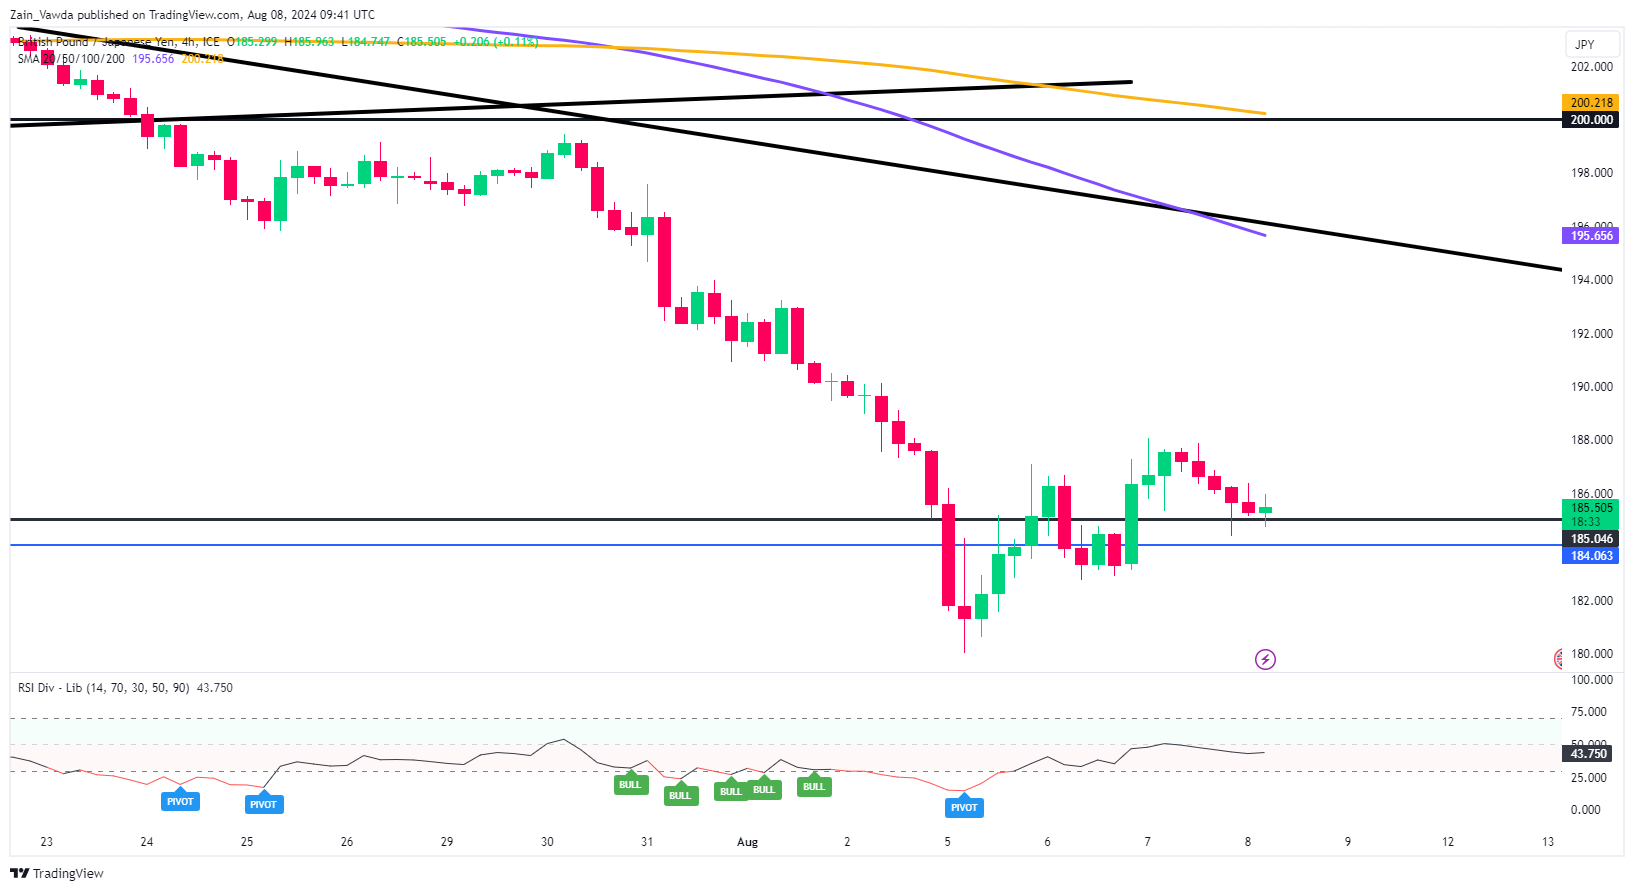
Source: TradingView (click to enlarge)
Support
- 185.00
- 183.30
- 180.00
Resistance
- 187.65
- 190.00
- 192.00
EUR/JPY
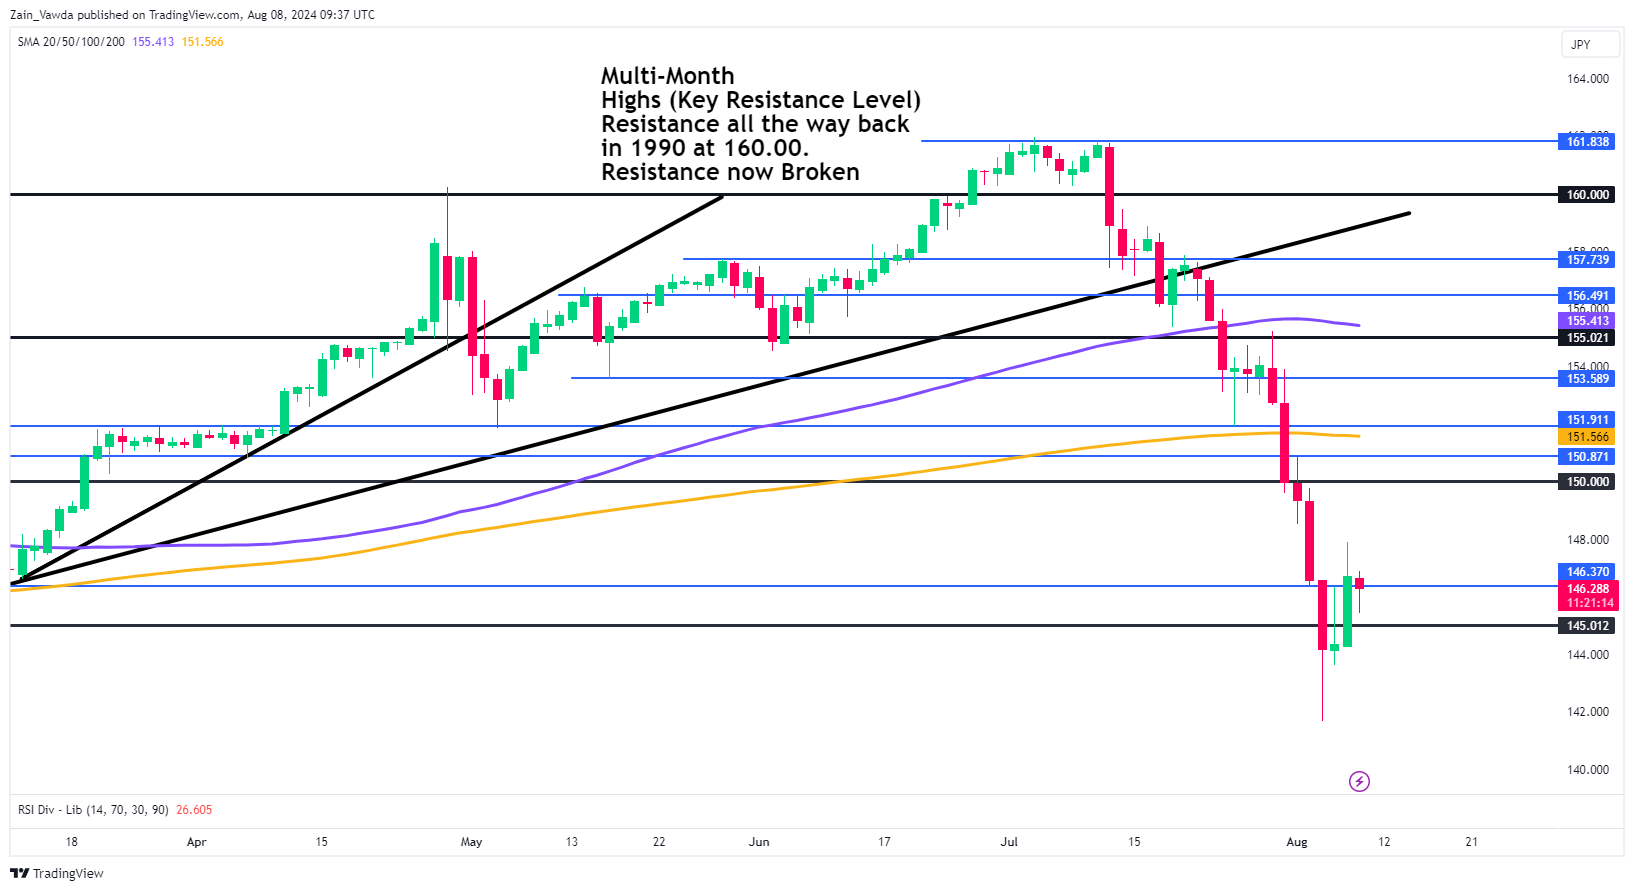
Once again, the chart nearly mirrors USD/JPY and GBP/JPY, with the daily chart displaying an imperfect morning star candlestick pattern. This morning, EUR/JPY retested the support area around the 159.00 level before bouncing back to trade at 159.66 at the time of writing.
On the H4 timeframe, a candle close below the recent lower swing high at 157.50 would invalidate the current bullish trend, potentially leading to a retest of the recent lows around the 154.40 level. There is some support at 156.72 that would need to be breached for a retest of the recent lows to occur.
On the upside, immediate resistance lies at 160.00, followed by the 161.86 level. Beyond this, the 163.51 zone could be crucial, as it also aligns with the 200-day moving average just above.
EUR/JPY Daily Chart, August 8, 2024

Source: TradingView (click to enlarge)
Support
- 159.00
- 156.72
- 154.40
Resistance
- 160.00
- 161.85
- 163.50