Sample Category Title
NZ First Impressions: RBNZ Survey of Expectations, Q3 2024
Inflation expectations have continued to fall, reinforcing indications that inflation is set to drop back within the RBNZ target band in very near future.
Inflation expectations
- One year ahead: 2.40% (Prev: 2.73%, down 33 points)
- Two years ahead: 2.03% (Prev: 2.33%, down 30 points)
- Five years ahead: 2.07% (Prev: 2.25%, down 18 points)
- Ten years ahead: 2.03% (Prev: 2.19%%, down 16 points)
Expectations for inflation over the next few years have continued to drop back in the RBNZ’s latest Survey of Expectations. That follows the fall in actual inflation in recent months.
Inflation expectations have fallen at all of the horizons the RBNZ monitors. Most notably, the closely watched measure of expected inflation in two-years’ time has dropped to 2% (down from 2.3% last quarter). Expectations for inflation two-years ahead are now below the average seen since 2002 (when we shifted to a 1 to 3% target range for inflation). Notably, this measure has not typically fallen to these sorts of lows except at times when actual inflation has fallen below 2%.
The importance of this survey in the RBNZ’s policy deliberations has fallen over time, with the RBNZ instead preferring to look at a range of different measures of inflation pressures.
Even so, today’s result will still be welcome news for the RBNZ, reinforcing other indications that inflation is set to drop back within the RBNZ’s target band in the very near future (we’re picking inflation will fall to 2.6% in the September quarter).
This reinforces our expectation the RBNZ will signal earlier rate cuts than previously assumed at their policy meeting next week – we’re forecasting OCR cuts will begin in October. Our full preview of the RBNZ’s August policy meeting is available here.
One BoJ member suggests gradual rate hike to above 1% neutral rate
BoJ's Summary of Opinions from the July 30-31 meeting reveals that board members discussed further rate hikes after implementing the second interest rate increase this year at the meeting.
One member's opinion stood out, suggesting that, assuming the price stability target is achieved in the second half of fiscal 2025, BoJ should raise the policy interest rate to the level of the "neutral interest rate." This neutral rate is estimated to be "at least around 1 percent." To avoid rapid hikes, BoJ should increase the policy interest rate in a "timely and gradual manner."
The consensus among members is that economic activity and prices have been developing generally "in line with the Bank's outlook." Consequently, it is deemed appropriate for to raise the policy interest rate and adjust the degree of monetary accommodation.
One opinion highlighted that raising interest rates at a "moderate pace" aligns the adjustment in monetary accommodation with underlying inflation. Such moves "will not have monetary tightening effects."
BoC minutes reveal clear consensus for further rate cuts
BoC's Summary of Deliberations from its July meeting indicates a "clear consensus" on the need for more rate cuts if inflation continues to ease. With inflation "closer to target" and "downside risks" becoming "more prominent," members agreed that it would be appropriate to "lower the policy rate further" if inflation follows the projected path.
During the meeting, members discussed various risks to the inflation outlook. The focus was on "downside risks" more than in previous meetings. Members acknowledged that weak consumer sentiment is likely to persist, posing a risk that consumer spending could be "significantly weaker" than expected in 2025 and 2026. Additionally, further labor market weakness could "delay the rebound" in consumption, exerting "downward pressure on growth and inflation."
Conversely, some members highlighted the "stickiness of services price inflation," which could keep inflation elevated. They noted that price pressures in services, which are "more closely affected by wages," are unlikely to be offset by the disinflation seen in goods and other services in recent months.
It Will Take More for RBA to Move: First Rate Cut Later, a Faster Decline a Risk
We have revised our view to an expectation that the RBA will first start cutting rates at the February 2025 meeting, and end at 3.35%. There are risks on both sides of this forecast.
As we noted yesterday, the RBA Governor all but ruled out cutting rates this year. This runs counter to our earlier thinking, that the process of reducing the restrictive stance of policy could start from November.
We have now revised our view to an expectation that the RBA will first start cutting rates at the February 2025 meeting. Consistent with our earlier forecast, the trajectory of rate cuts is expected to be tentative and conservative, at one 25 basis point cut per quarter.
As always, our view on rates is predicated on economic developments turning out broadly in line with our own forecasts. These can differ from the RBA’s view, sometimes materially. Our forecasts for underlying inflation are the same as the RBA’s August forecasts, but we are more pessimistic about consumption growth and less concerned over productivity.
We have also revised the end-point of the cutting phase to 3.35%, from 3.10% previously. For some time, our view has been that the global structure of interest rates will be higher than it was between the Global Financial Crisis and the pandemic. We have now also incorporated the fact that the RBA seems to be putting more weight on its own models of neutral than they did previously. The average of these models is a bit above 3.10%. We think this assessment will shape the Board’s behaviour.
The underlying logic of our framework is that monetary policy works with a lag. If you wait until you are back at target before starting to cut rates from a restrictive point, you have waited too long. So the question is how much evidence policymakers need to see to be convinced that inflation is on track to return to target on the desired timetable.
While our baseline forecast of trimmed mean inflation is essentially identical to the RBA’s, the RBA’s conviction levels around these forecasts are evidently not high enough to consider moving in the short term. The policy logic remains the same, but a data-dependent central bank means that one must also revise the rates view if the data turn out even slightly different from earlier expectations. A similar consideration informed our shift in view back in April.
Another consideration that is specific to the RBA and to the current juncture is that the RBA Review mandated that the RBA adopt and emphasise analytical tools and approaches that it had previously not emphasised. The staff have undertaken a program of model and analytical development to address the Review recommendations, using resources not previously available, for example to assess full employment and the output gap. But these new tools and approaches are new and untested, and it is understandable that, in that situation, the Board would have a higher bar for accumulated evidence before acting.
In particular, we note that all but one of the indicators in the RBA’s full employment indicator checklist has eased between May and August. Yet the Statement on Monetary Policy noted that, “Our overall assessment is that the labour market and broader economy are tighter than previously thought.” Though wages growth has slowed, and undershot the RBA’s earlier forecasts, the RBA’s new framework seems to be relating full employment – and the feasible rate of unemployment – to the difference between wages growth and current productivity growth. This is a departure from traditional models that focus on wages growth itself, or real wages growth.
If not this year, the next realistic opportunity for the RBA Board to begin the process of cutting is at the February meeting. Compared with now, the Board will have access to two more quarterly CPI readings. Importantly, it will also have two new national accounts releases that will confirm that demand growth remains soft and – we believe – that the RBA’s pessimism around near-term productivity growth and unit labour costs is overblown.
It was always going to be the case that the RBA’s strategy to raise rates a bit less than its peers would result in it being among the last to cut, even though disinflation trajectories have not been that different. The RBA is now likely to be even more of an outlier while its peers cut past it. Ordinarily this would have implications for the exchange rate, especially against the United States dollar, given the shift in the rates outlook there. At this stage, though, we think geopolitical and global factors are likely to swamp these small shifts in the rate differential outlook, at least until the end of the year.
We cannot rule out that the RBA ends up keeping the cash rate at current levels for even longer than our revised view. That would occur if inflation surprised on the upside relative to our own forecasts in the lead-up to the February meeting. If that scenario did occur, it is likely that the RBA would end up having to cut a little quicker than we currently assume. In wanting to be sure, the RBA Board is risking getting too far behind the curve, with inflation undershooting the target and unemployment rising further than strictly necessary.
Likewise, we cannot completely rule out that the RBA ends up having to cut this year after all, but only if the economy weakens materially relative to the RBA’s forecasts, and our own. The RBA’s assessment of the real economy and aggregate demand are quite sanguine. Given the weaker US labour market news was released after the RBA’s forecasts were finalised, there would appear to be some downside risks that were not accounted for in those forecasts.
Crude Oil Prices Path to Recovery: Major Challenges Ahead
Key Highlights
- Crude oil prices found support near the $72.00 zone.
- A connecting bearish trend line is forming with resistance at $76.60 on the 4-hour chart.
- EUR/USD is consolidating near the 1.0900 pivot zone.
- Bitcoin could struggle to recover above $58,000 and $58,800.
Crude Oil Price Technical Analysis
After a close below the $80.00 level, Crude oil prices gained bearish momentum. It broke the $78.00 and $76.50 support levels to enter a bearish zone.
Looking at the 4-hour chart of XTI/USD, the price settled below the $76.50 level, the 200 simple moving average (green, 4-hour), and the 100 simple moving average (red, 4-hour). Finally, the bulls appeared near the $72.00 zone.
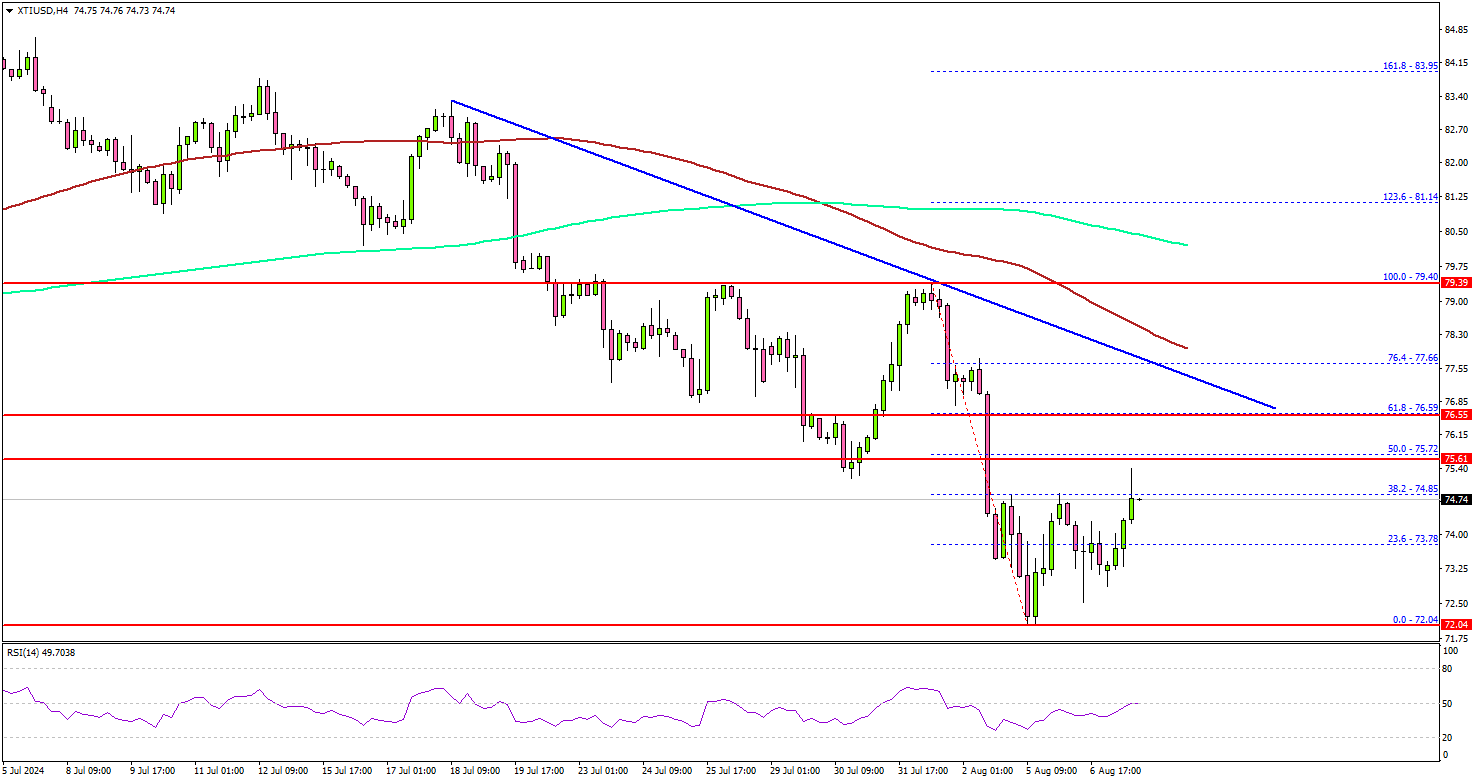
A low was formed at $72.04 and the price recently started a recovery wave. There was a minor increase above the $73.80 level. It cleared the 38.2% Fib retracement level of the downward move from the $79.40 swing high to the $72.04 low.
Immediate resistance on the upside is near the $75.75 level. The next major resistance is near the $76.50 zone. There is also a connecting bearish trend line forming with resistance at $76.60 on the same chart.
The trend line is close to the 61.8% Fib retracement level of the downward move from the $79.40 swing high to the $72.04 low, above which the price may perhaps accelerate higher. In the stated case, it could even visit the $78.00 resistance.
If not, the price might start another decline. The first major support on the downside is near the $73.20 level. The next major support is $72.00. Any more losses might send oil prices toward $70.00 in the coming sessions.
Looking at Bitcoin, the price started a recovery wave above the $55,000 level but the bears might defend gains above the $58,000 zone.
Economic Releases to Watch Today
- US Initial Jobless Claims - Forecast 240K, versus 249K previous.
- US Wholesale Inventories for June 2024 (preliminary) – Forecast +0.2%, versus +0.2% previous.
AUDCAD Selling the Rallies at the Blue Box Area
Hello fellow traders. In this technical article we’re going to take a quick look at the Elliott Wave charts of AUDCAD published in members area of the website. As our members know the pair has been showing incomplete sequences in the cycle from the February 2021 peak. Recently AUDCAD has given us the recovery that reached our selling zone. The pair found sellers right at the Blue Box area and made the decline toward new lows as expected. In the further text we are going to explain the Elliott Wave Forecast and trading strategy.
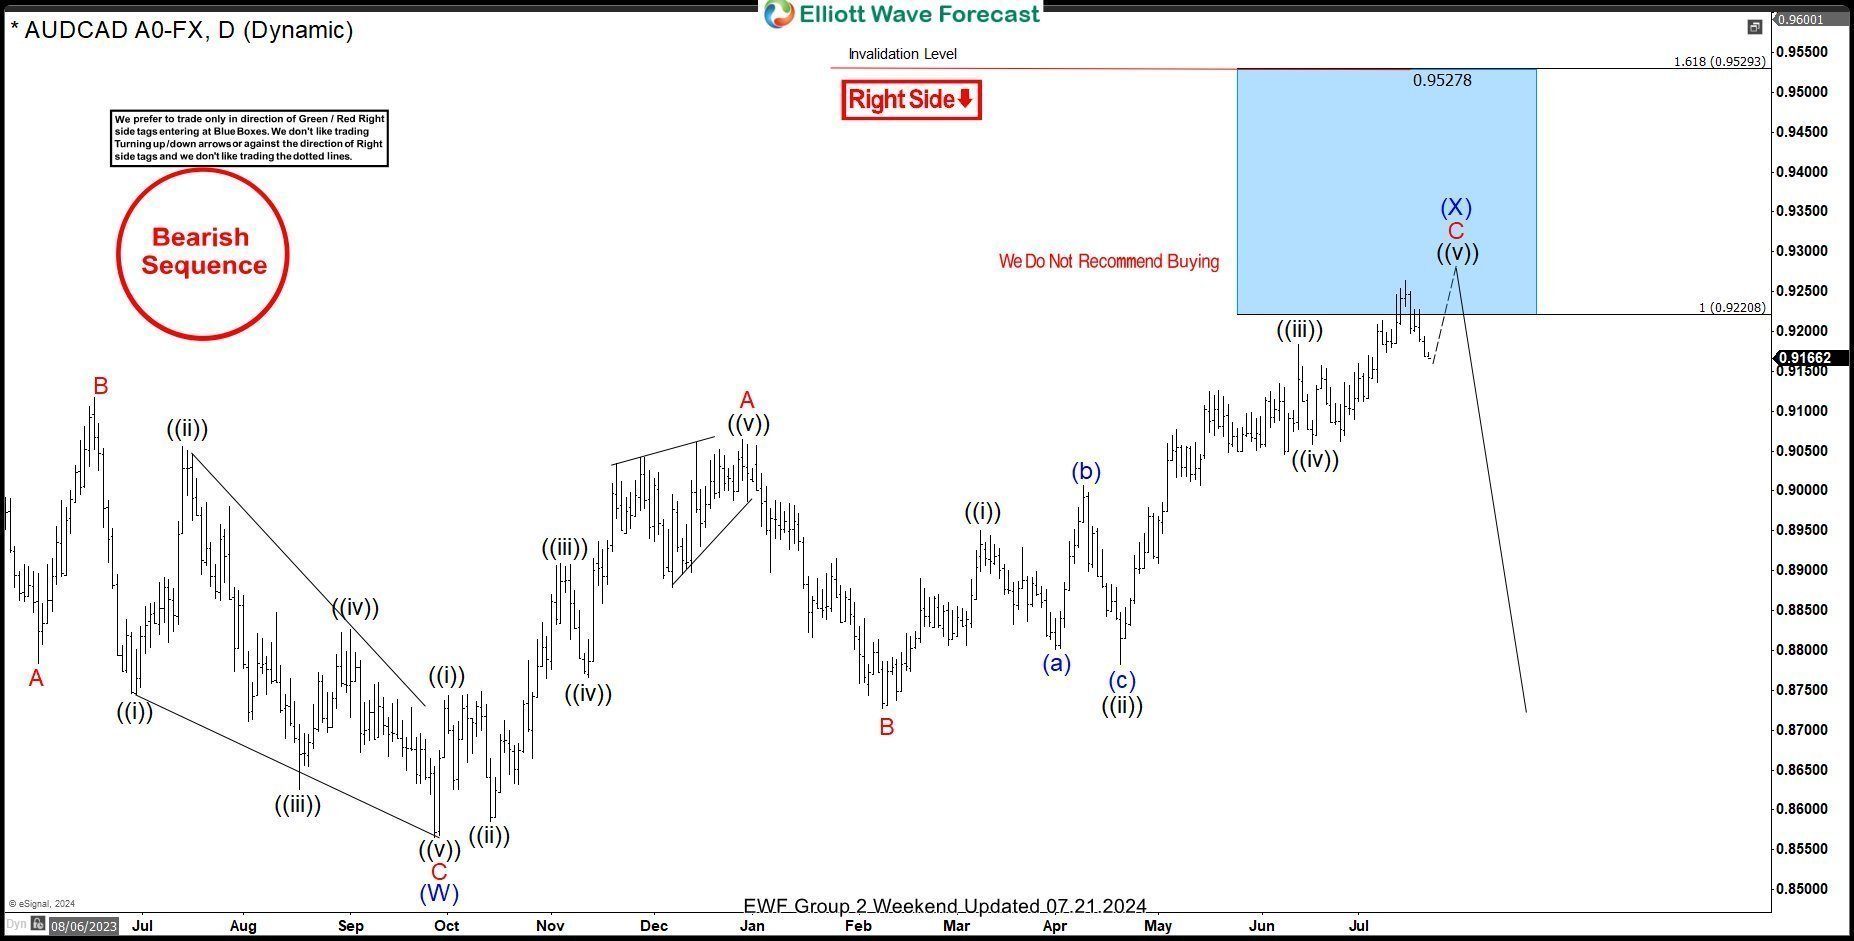
AUDCAD Elliott Wave Daily Chart 07.21.2024
The pair is correcting the cycle from the 25th January peak , giving us (X) blue recovery. The price has already reached the extreme zone at 0.92208-0.9529 (Blue Box – sellers zone). We don’t recommend buying the stock and prefer the short side from the blue box zone. As the main trend is bearish, we expect to see at least 3 waves pullback from our selling zone. Once the decline reaches 50 Fibs against the B red low, we will make the short position risk-free (put SL at BE) and take partial profits.
Quick reminder:
Our charts are easy to trade and understand:
Red bearish stamp+ blue box = Selling Setup
Green bullish stamp+ blue box = Buying Setup
Charts with Black stamps are not tradable. 🚫
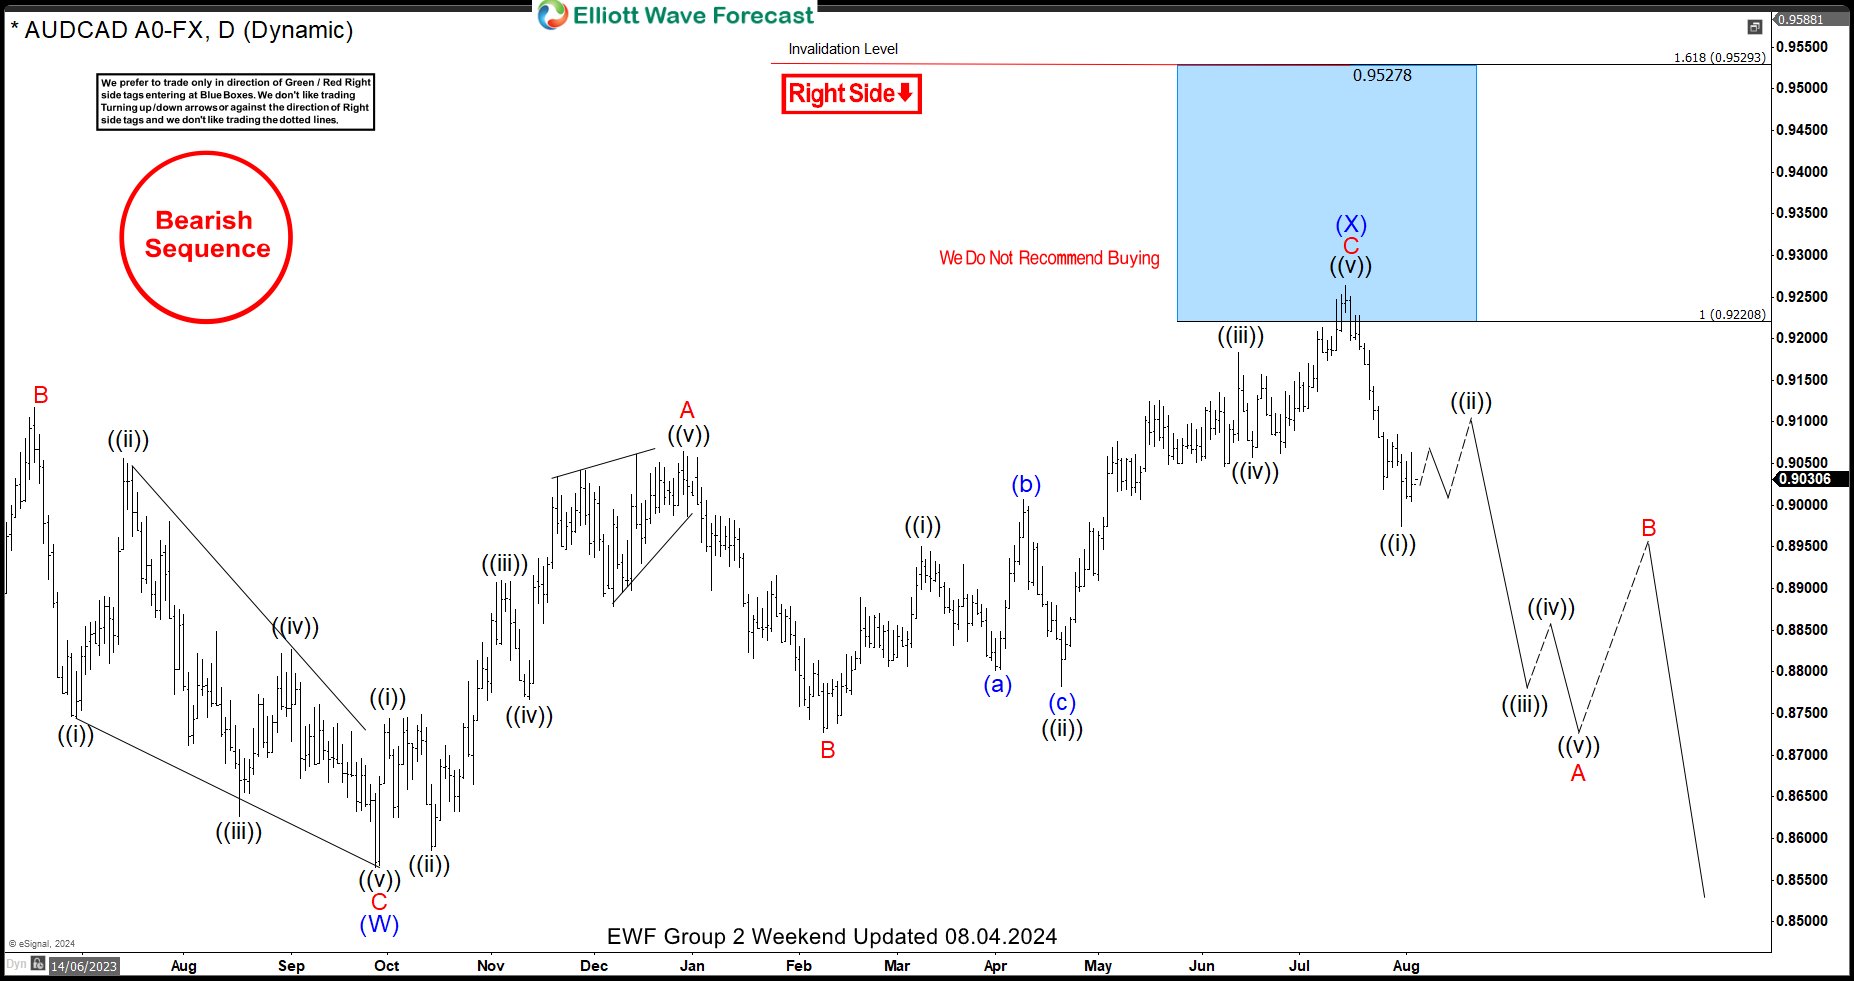
AUDCAD Elliott Wave Daily Chart 08.04.2024
AUDCAD found sellers at the Blue Box area: 0.92208-0.952728. We are receiving a good reaction from the selling zone. The decline made has reached and exceeded 50 Fibs against the B red low. So, members who took the short trade are currently enjoying profits in risk-free positions.
FTSE Bounces From the Blue Box; Full Recovery in Sight?
Hello, traders! Welcome to a new blog post where we discuss how our Blue Box strategy helps ElliottWave-Forecast members identify high-confidence trade opportunities across 78 instruments. In this post, we’ll focus on the FTSE. The $FTSE is an index that tracks the top 100 companies listed on the London Stock Exchange by market capitalization.
The FTSE ended a decline that lasted over 22 months in March 2020. Since bottoming out in March 2020, the index has recovered in an impulsive wave structure for most of the last four years. To assist our members in tracking this 4-year bullish cycle, we update the weekly FTSE chart every weekend to prepare them for the week ahead. We also update daily, H4, and H1 charts for all 78 instruments over the weekend. Below is the most recent weekly chart, which we shared on 08.03.2024
FTSE Weekly Chart, 08/03/2024
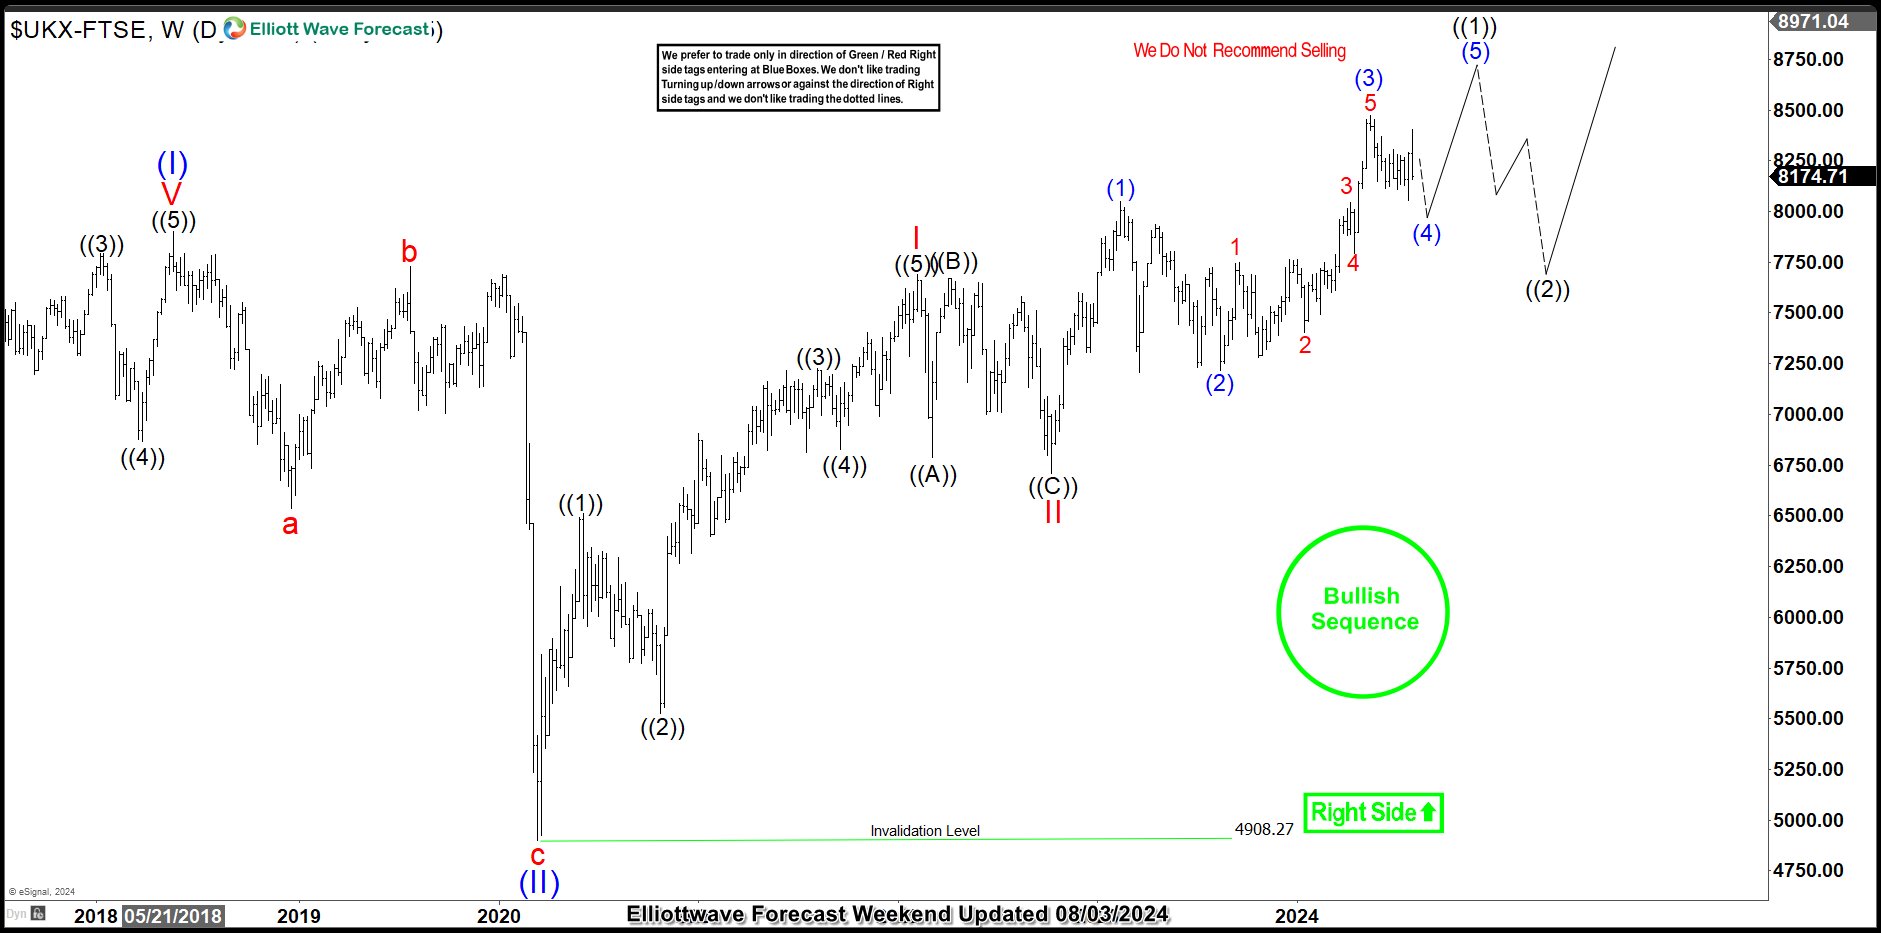
In the weekly chart above, the impulse cycle from March 2020 represents wave (III) of the Supercycle degree. Price has completed waves I and II of (III) and is now in wave III of (III). Within wave III, the price was in wave (4) of ((1)) of III. Based on this, we anticipated one more swing high to complete wave (5) of ((1)) of III. Once the impulse cycle for ((1)) is complete, we expect a larger pullback in ((2)) before the broader bullish impulse cycle for III of (III) continues. This chart helps us understand the current price position within the larger framework of price action.
Naturally, we focused on buying opportunities and avoided selling, when in a bullish sequence. Therefore, we recommended that members buy the wave 4 pullback when it completes a 3, 7, or 11 swing pullback at the extreme of the corrective sequence
FTSE 4-Hour Chart, 08/03/2024
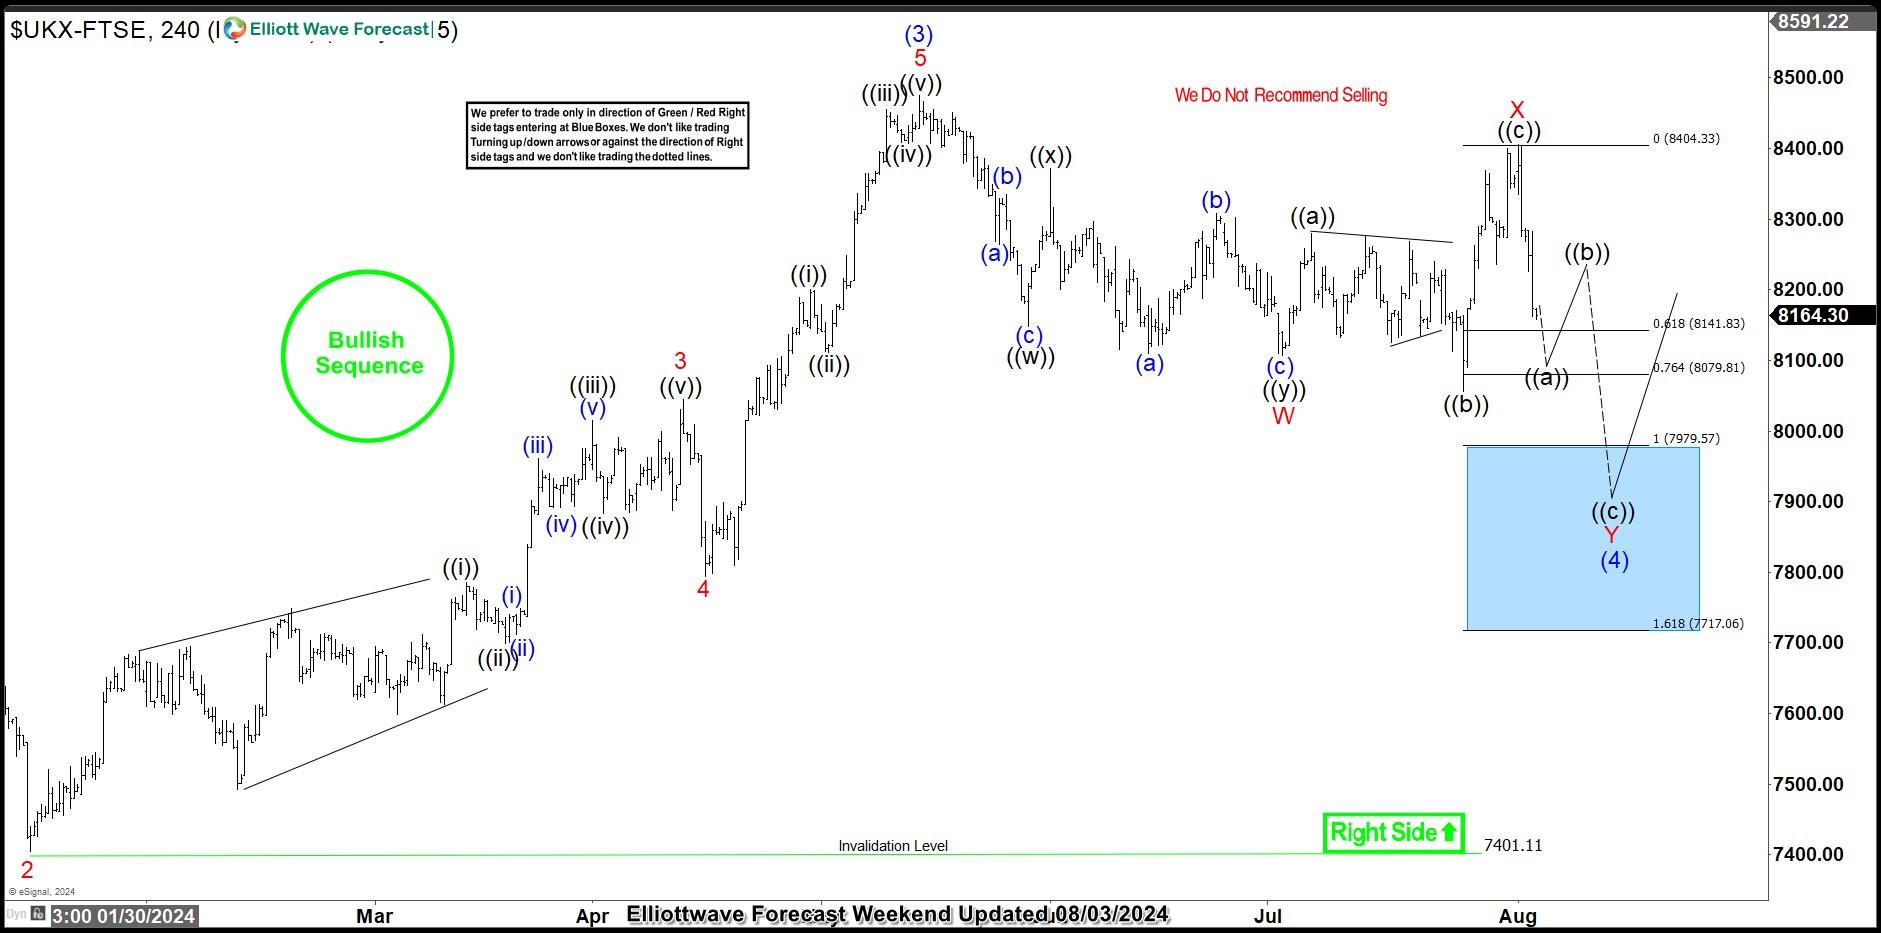
On the same weekend, 08.03.2024, we shared the H4 chart above with our members. This chart illustrates the sub-waves of wave (4). From this chart, we identified that the index was close to completing a double zigzag (7-swing) structure within the 7979.57 to 7717.06 range. Therefore, the trade plan was to buy at 7979.57 or below, with a stop placed below 7717.06, as this would indicate that the corrective structure had become overstretched and thus unreliable.
FTSE 4-Hour Chart, 08/07/2024
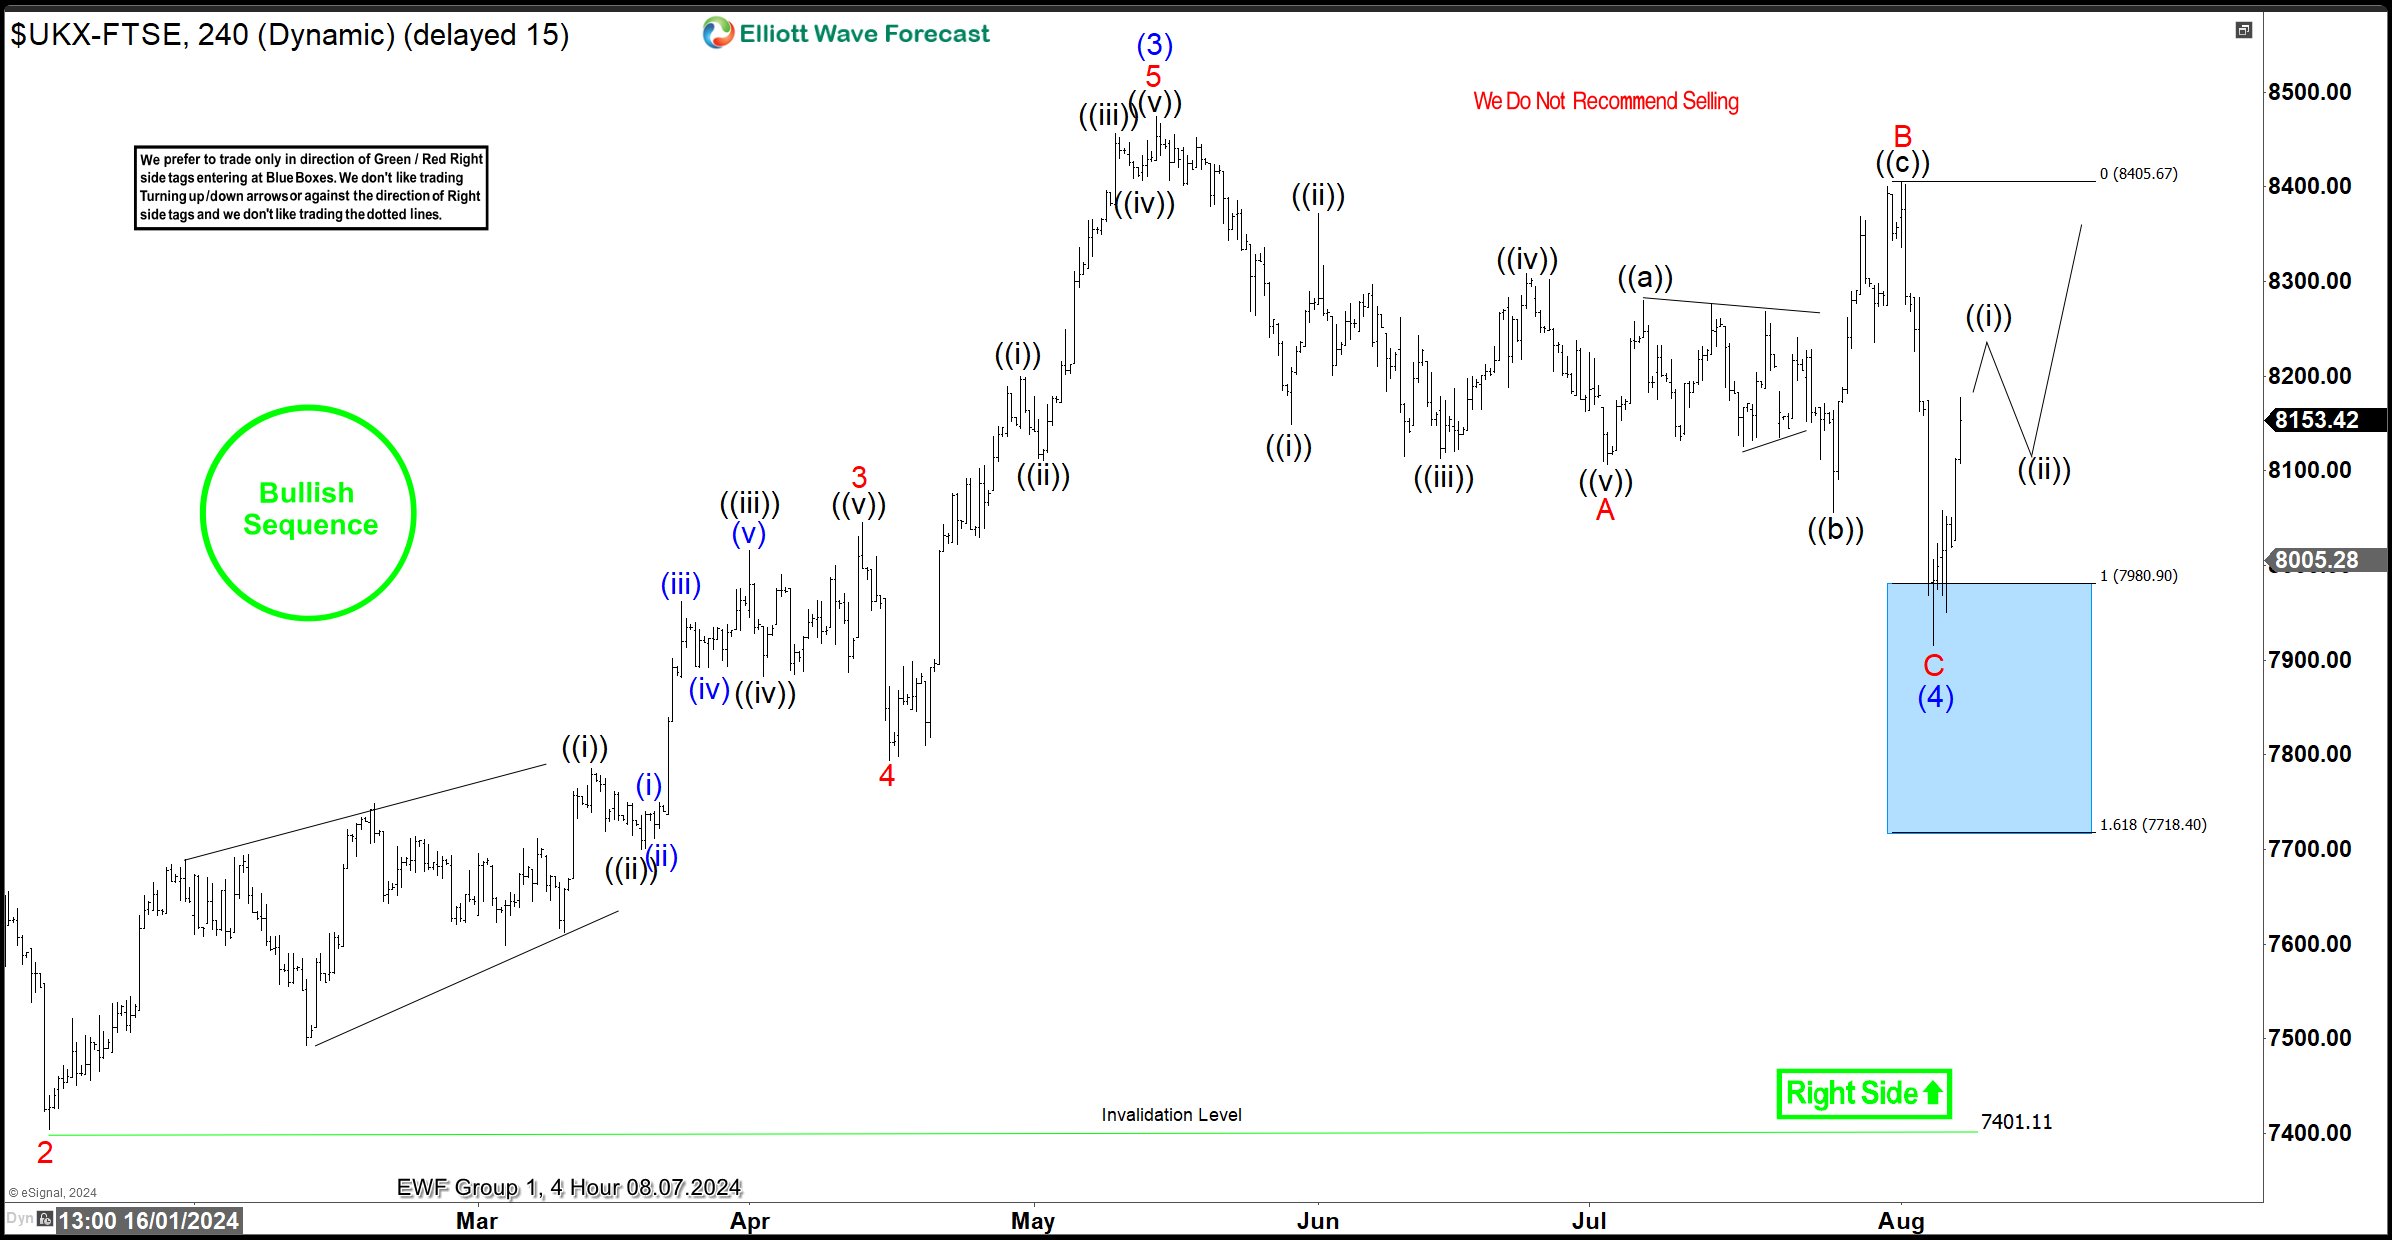
The chart above shows FTSE’s reaction at the time of writing this post. The index dropped into the Blue Box to complete wave C of (4). As expected, it quickly bounced off the box and moved away from it. Meanwhile, after reaching 8159, the trade plan was to close half of the position and adjust the stop for the remainder to break even. This approach allowed members to secure some profits while cutting risk to zero. Moving forward, we anticipate an impulsive recovery for wave (5). Currently, the price is in wave ((i)) of 1 of (5). We expect either a full recovery above the wave (3) top or at least a 3-swing bounce.
Two outcomes are possible. Firstly, the price could recover above the wave (3) top, allowing members to hold for further gains. Secondly, it could complete a 3-swing bounce and drop back below the box, reaching a new extreme. In the latter scenario, members have already secured profits and face no risk. Meanwhile, our analysts will continue working around the clock to provide updates on FTSE and 77 other instruments, from weekly down to the 30-minute/1-hour time frame.
USDCAD Wave Analysis
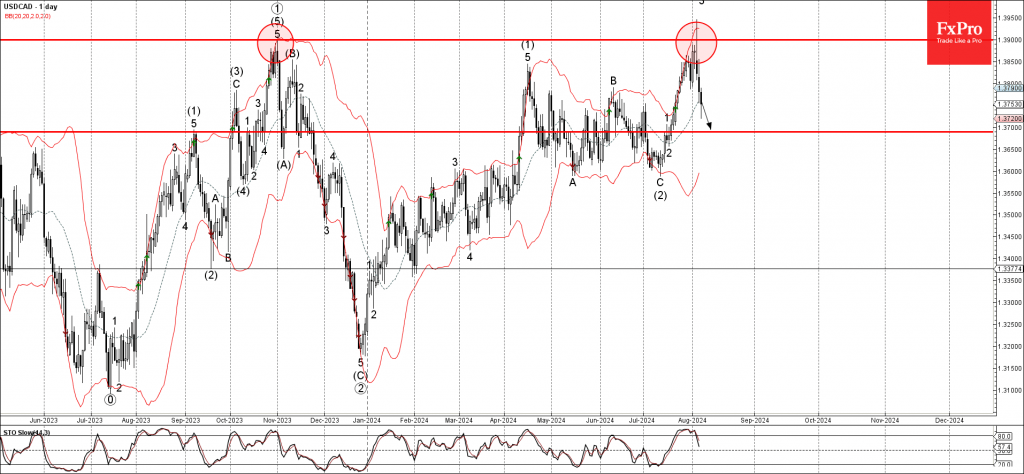
- USDCAD reversed from long-term resistance level 0.8430
- Likely to fall to support level 1.3700
USDCAD currency pair recently reversed down from the resistance zone located between the long-term resistance level 0.8430 (which stopped the weekly uptrend at the end of 2023) and the upper weekly Bollinger Band.
The downward reversal from the resistance zone created the weekly candlesticks reversal pattern Shooting Star Doji.
Given the strength of the resistance level 0.8430, USDCAD currency pair can be expected to fall further toward the next support level 1.3700.
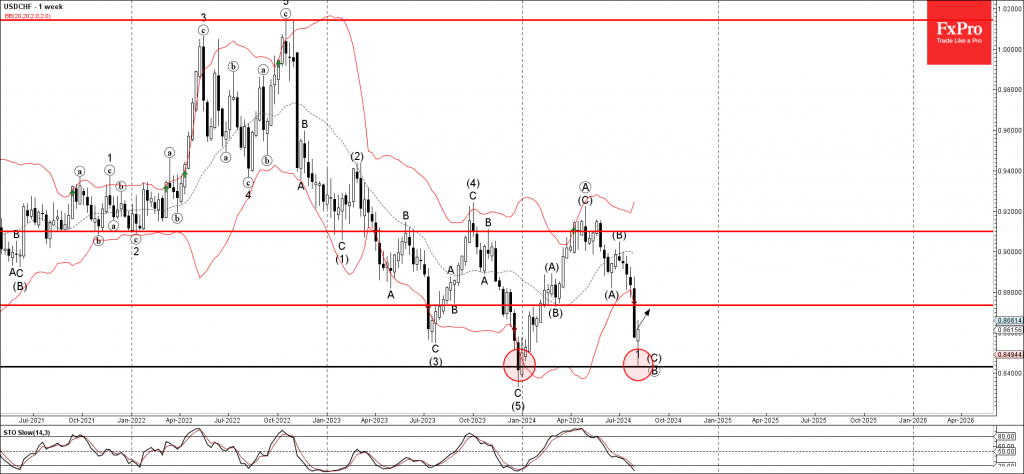
USDCHF Wave Analysis
- USDCHF reversed from support zone
- Likely to rise to resistance level 0.8735
USDCHF currency pair recently reversed up from support zone located between the support level 0.8430 (which stopped the weekly downtrend at the end of 2023) and the lower weekly Bollinger Band.
The upward reversal from this support zone stopped the previous weekly impulse wave (C) from the end of June.
Given the strength of the support level 0.8430 and the oversold weekly Stochastic, USDCHF currency pair can be expected to rise further toward the next resistance level 0.8735.