
Sample Category Title
AUD/USD: Hawkish RBA and Dovish BoJ Underpin Recovery
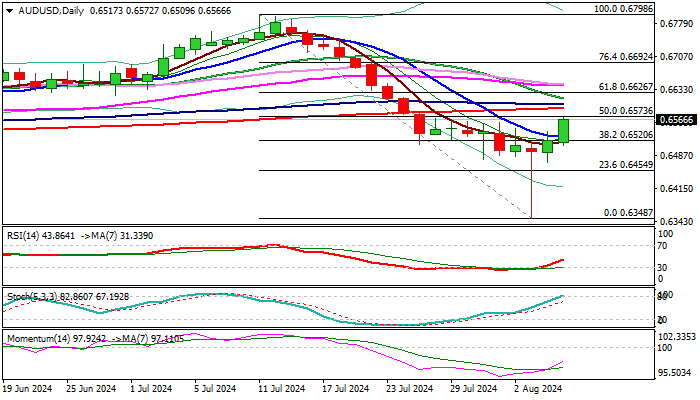
AUDUSD recovery from Monday’s spike low (0.6348, the lowest since early Nov 2023) picks up on Wednesday.
Hawkish RBA on Tuesday, with policy diverging from other major central banks, fading fears about US recession and the latest dovish shift from BOJ, were the key positive factors for Aussie dollar.
Fresh acceleration higher (the pair was up 0.85% during Asian / early European trading on Wednesday) cracked pivotal barriers at 0.6560/70 zone (daily Kijun-sen / 50% retracement of 0.6798/0.6348 descent / the base of rising thick daily cloud).
Firm break here to add to bullish signals and expose next strong obstacles at 0.6590/0.6600 (converging 200/100DMA’s), close above which to further strengthen near-term structure and open way for stronger recovery
However, caution is still required as thick daily cloud weighs, north-heading 14-d momentum is still deeply in negative zone and stochastic penetrating overbought territory.
Daily close above 0.6520/10 zone to main term bias.
Res: 0.6573; 0.6590; 0.6601; 0.6626.
Sup: 0.6530; 0.6510; 0.6472; 0.6455.
GBP/USD Outlook: Recovery Above Daily Cloud Likely to Be Limited
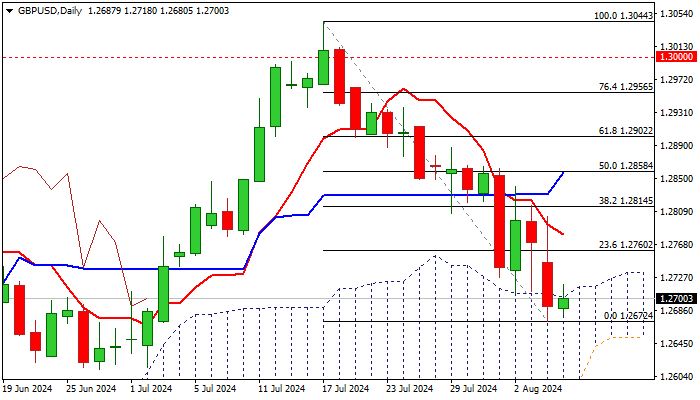
Cable started to gain traction and edged higher on Wednesday morning, after the latest drop penetrated rising daily cloud (cloud top at 1.2702) but found firm ground at 1.2682 (100DMA) where dips were repeatedly rejected.
Subsequent rise may generate initial bullish signal on return and close above daily cloud, though more work at the upside (violation of daily Tenkan-sen at 1.2780 and lift above Fibo 38.2% of 1.3044/1.2672 at 1.2814) will be required to validate signal.
On the other hand, bearish daily studies (daily Tenkan/Kijun-sen bear cross/strong negative momentum) warn of limited correction which would provide better selling levels for renewed attack at 100DMA and nearby 200DMA (1.2651).
Res: 1.2739; 1.2760; 1.2780; 1.2815.
Sup: 1.2682; 1.2651; 1.2612; 1.2584.
BoJ Comments Ease USDJPY Oversold But Unlikely to Be a Game-Changer
USDJPY jumped more than 2% after comments from the Bank of Japan’s deputy governor reduced the chances of further policy tightening soon. Uchida said that the central bank will not raise interest rates when markets are unstable. These words brought buyers back into the Japanese markets and helped USDJPY to extend its 4% rebound from Monday’s lows.
It is interesting to note that yen speculators did not initially appreciate the Bank of Japan’s rate hike from 0.1% to 0.25%, as the yen lost around 0.6% in the first hour after the decision. But this change in fundamentals triggered an unwinding of the carry trade and was an important factor in the pressure on markets at the start of the week.
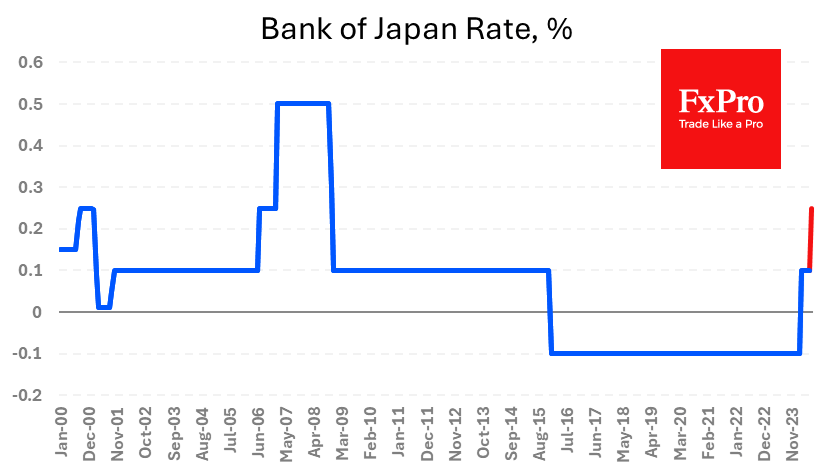
At the same time, these words were meant to calm the markets but not reverse the course of monetary policy, especially as both Japan and the US are normalising interest rates. In Japan, inflation has been close to the 2% target for almost two years, allowing the central bank to end a period of zero interest rates. Meanwhile, the Fed is grappling with slowing price growth and a cooling labour market, forcing a move to a long-term average rate of 2.8% (as estimated by the FOMC) from the current 5.25-5.50%.
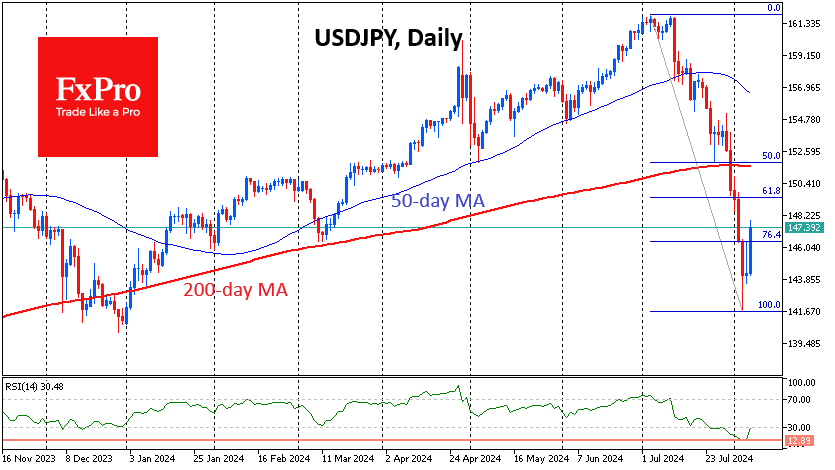
Technically, the USDJPY’s current rise looks like a necessary bounce from extreme oversold conditions. In the daily timeframe, the RSI dropped to 13, a low previously seen in 1997 and 1995. In both cases, the bounce was followed by fresh bearish momentum and the lows were updated before the pair made a long-term reversal.
The USDJPY could potentially bounce back to the 149.50 area, which is near the 61.8% Fibonacci retracement level – a classic retracement. However, in these earlier instances, the markets were content with less severe pullbacks to 76.4% (in our case, near 146.5), so we do not rule out the possibility that the pair’s recovery momentum could fade quickly later today.
The 146.0-146.5 area acted as support in February and March, and now it has every chance of becoming resistance, which could keep the pair from moving higher for a long time.
However, this bearish view on the USDJPY’s prospects should be corrected if the pair manage to break above 149.50 in the coming days. A break above the 200-day average of 151.60, below which the pair fell following the Bank of Japan’s decision to raise interest rates, would confirm this.
USD/JPY Analysis: Rate Stabilizes After Tsunami
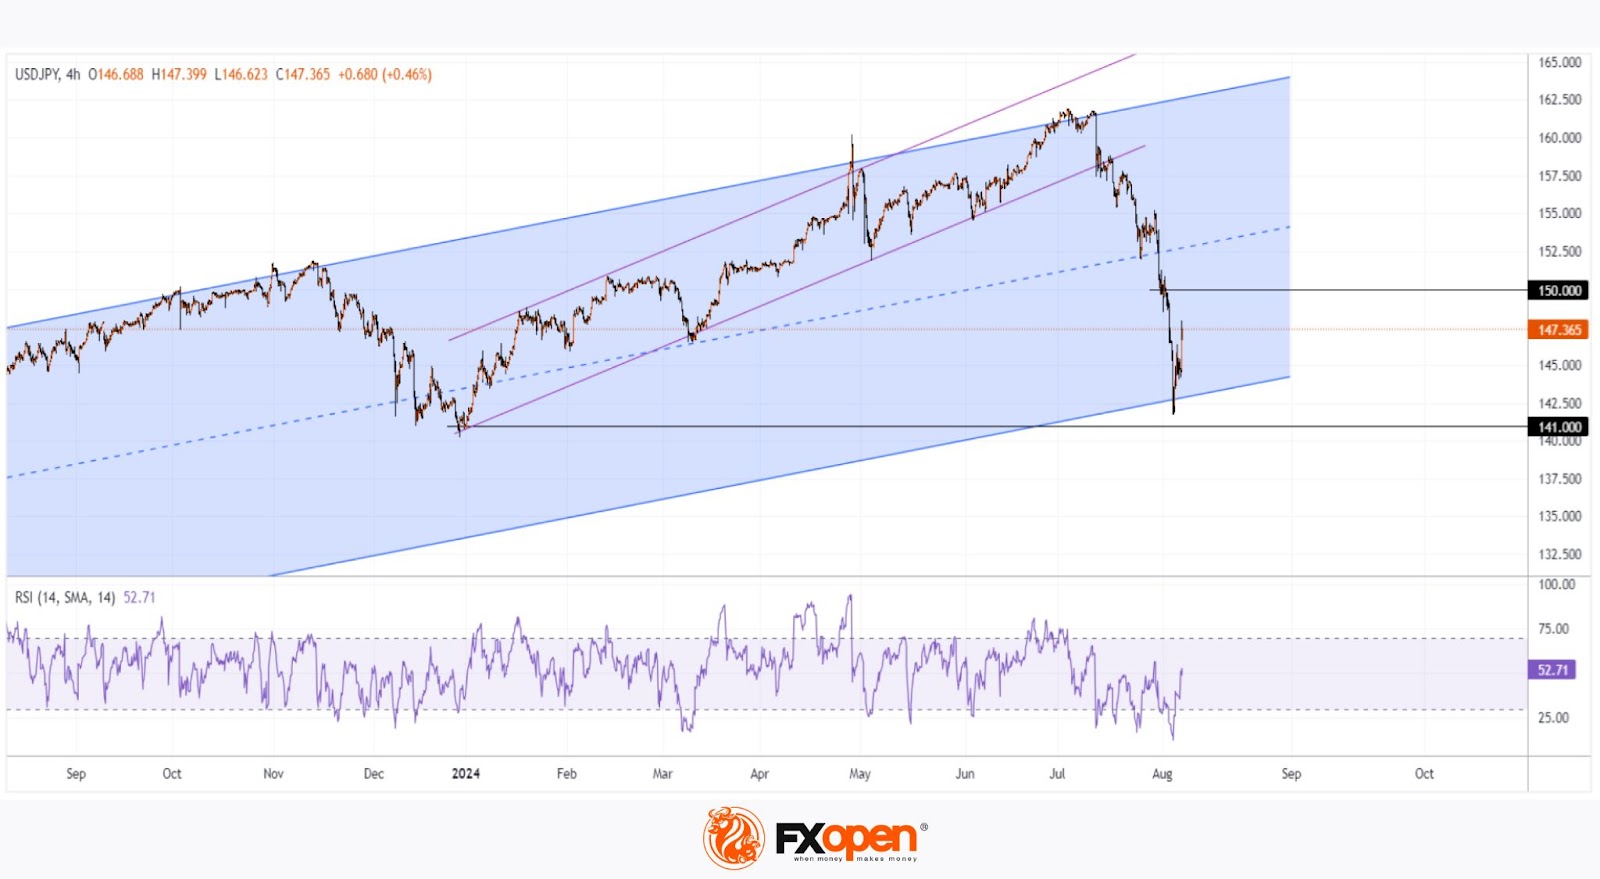
Less than a month ago, the rate was above 161 yen per US dollar. This week, it dropped below 142.5 yen (approximately -12%).
The strengthening of the Japanese yen was driven by actions from the Bank of Japan and financial authorities:
→ Intervention to support the yen in mid-July;
→ An interest rate hike last week.
On its downward trajectory, the USD/JPY rate broke through:
→ The ascending trendline (shown in purple);
→ The median line of a large ascending channel (shown in blue) that began in 2023;
→ The psychological levels of 160 and 150 yen per dollar.
The bears' aggression seems to have exhausted near the lower boundary of the blue channel. This was aided by statements from authorities aimed at stabilising financial markets, including the Japanese stock market.
Specifically, Bank of Japan Deputy Governor Shinichi Uchida said: “I believe that the bank needs to maintain monetary easing with the current policy interest rate for the time being, with developments in financial and capital markets at home and abroad being extremely volatile.” He also noted that concerns about the US economy, combined with actions from the Bank of Japan, triggered the volatility.
Technical analysis of the USD/JPY chart shows that:
→ Following the "dovish" comments from authorities, the price returned within the blue channel, and the RSI is recovering after falling below the 15 level.
→ If the bears resume pressure, support may come from both the lower boundary of the channel and the December 2023 lows around 141 yen per dollar.
→ Resistance can be expected at the psychological level of 150 yen per dollar, where the bears proved their strength after brief fluctuations around this level at the start of the week.
It is possible that, following the volatility "tsunami," the market's turbulence will subside, and the forces of supply and demand will more accurately indicate the fair value of the yen relative to the US dollar in light of the latest news.
Trade over 50 forex markets 24 hours a day with FXOpen. Take advantage of low commissions, deep liquidity, and spreads from 0.0 pips. Open your FXOpen account now or learn more about trading forex with FXOpen.
This article represents the opinion of the Companies operating under the FXOpen brand only. It is not to be construed as an offer, solicitation, or recommendation with respect to products and services provided by the Companies operating under the FXOpen brand, nor is it to be considered financial advice.
Oil Prices Near Recent Lows: Demand Concerns Keep Bulls at Bay
- Oil prices remain subdued due to recession fears and demand concerns.
- US stockpiles unexpectedly increased, adding to the bearish sentiment, EIA data out later today.
- Geopolitical tensions in the Middle East and China’s economic outlook are also contributing factors.
Oil prices continued to struggle yesterday as increasing recession fears kept bullish investors at bay. The prospect of a recession is exacerbating global demand concerns, putting additional downward pressure on oil prices.
Overnight, oil prices made a brief attempt to push higher as market sentiment temporarily improved. Market participants are closely monitoring geopolitical tensions, as any significant conflict in the Middle East could drastically impact supply and support oil prices.
China’s economic outlook remains another factor weighing on oil prices. Recent data revealed that Chinese oil imports fell to their lowest levels since September 2022.
Adding to the bearish sentiment, US stockpiles posted an unexpected increase. According to PI data, crude stocks rose by 176,000 barrels for the week ending August 2, while analysts polled by Reuters had anticipated a decrease of 700,000 barrels.
Later today, further insights into US stockpiles will be available when the Energy Information Administration (EIA) releases its weekly inventory data at 14:30 GMT.
As it stands, the upcoming EIA data is unlikely to alter the overall outlook on its own. Geopolitical risks continue to be the main concern, keeping market participants on edge. Additional worries about a recession or global economic slowdown could further depress oil prices.
Technical Analysis Oil
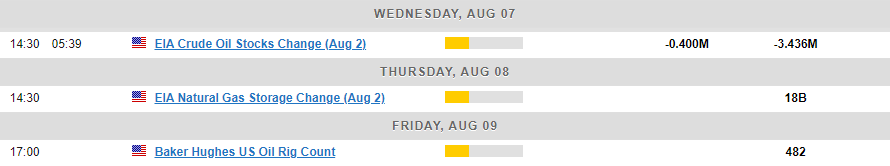
From a technical perspective, Brent has been making its way lower since July 5 highs around 88.55 handle. This has brought the price to within a whisker of the lower band of the channel that has been in play since March 2023.
The low of this pattern rests around the 75.00 psychological level and this could prove a tough nut to crack for oil bears.
Brent Oil Chart Weekly, August 7, 2024
Source: TradingView (click to enlarge)
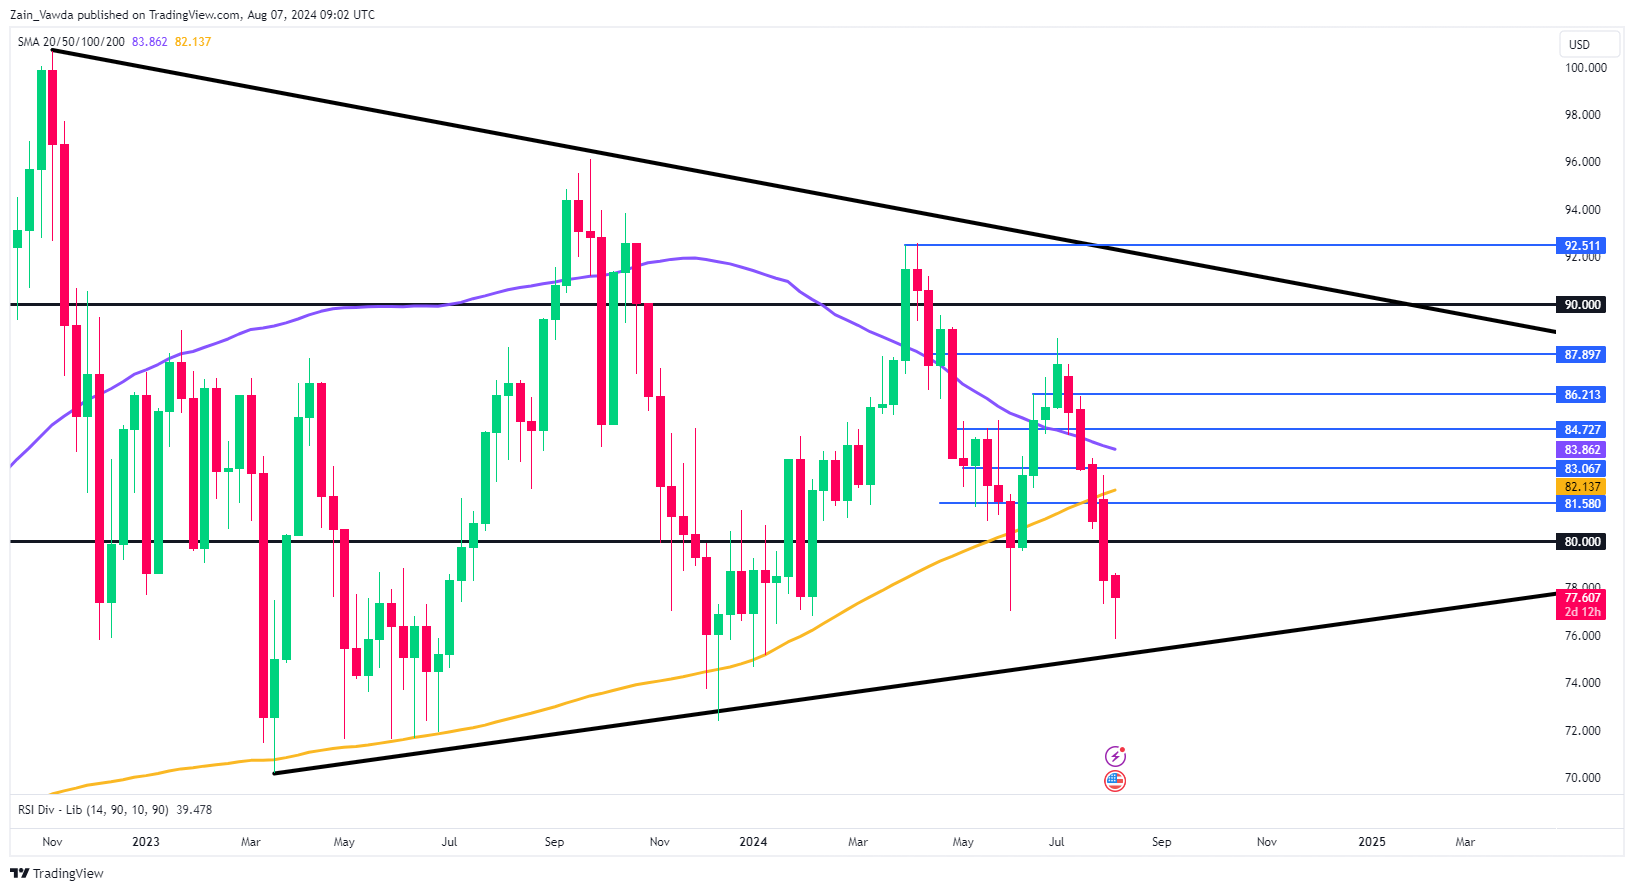
Dropping down to a H4 chart and price does appear to be attempting a recovery. Whether or not oil will be able to gain bullish traction remains to be seen but the H4 technical picture gives a sense of hope.
Having broken the descending trendline there is a possibility that a recovery may materialize, this is to say barring any new developments around a peace deal in the Middle East and an improving sentiment. A H4 candle close above 78.500 will result in a change in structure and may attract more buying pressure.
Brent Oil Chart H4, August 7, 2024
Source: TradingView (click to enlarge)
Support
- 76.50
- 76.00
- 75.00 (psychological level)
Resistance
- 78.50
- 79.315
- 80.00
Bitcoin: From Shock to the Death Cross
Market picture
Crypto market capitalisation is back above $2 trillion, up 1.3% over 24 hours. On Wednesday, the Crypto Fear and Greed Index retreated from extreme fear territory at 17 (the lowest in over two years) to 29.
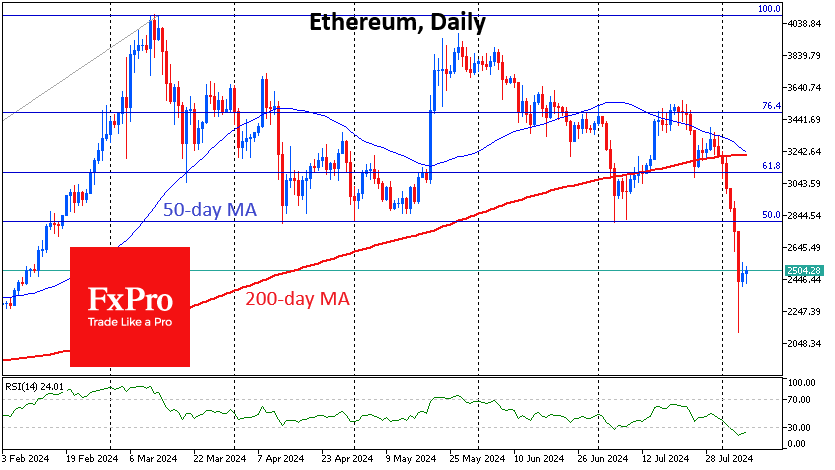
The sharp declines in Bitcoin and Ethereum, sustained by the rumblings of falling stock indices since late July, accelerated the formation of a powerful bearish signal—the death cross—as the downward sloping 50-day MA accelerated its decline in recent days, promising to cross the 200-day MA in the next few days. Often, this signal triggers a new wave of declines, but now both coins look locally oversold as the financial markets lick their wounds after the recent sell-off.
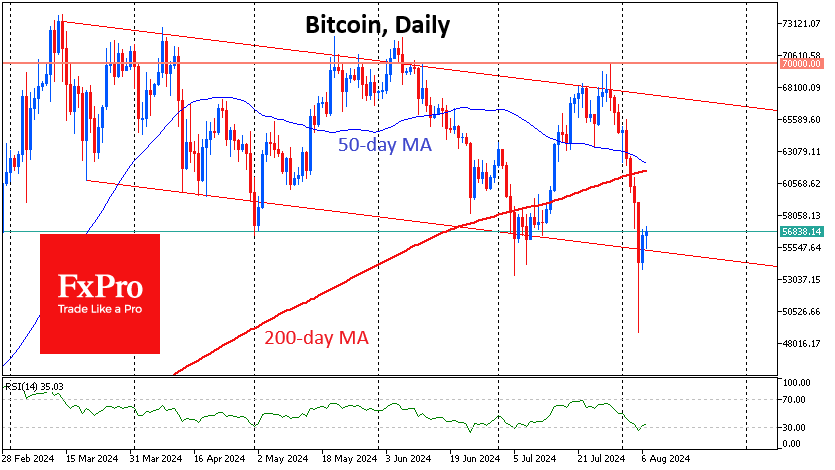
However, even in case of a technical rebound, a return above the 200-day MA would be needed to prove that the bull market has returned. For Bitcoin, that level now stands at $61.5K, and for Ethereum, it is at $3200.
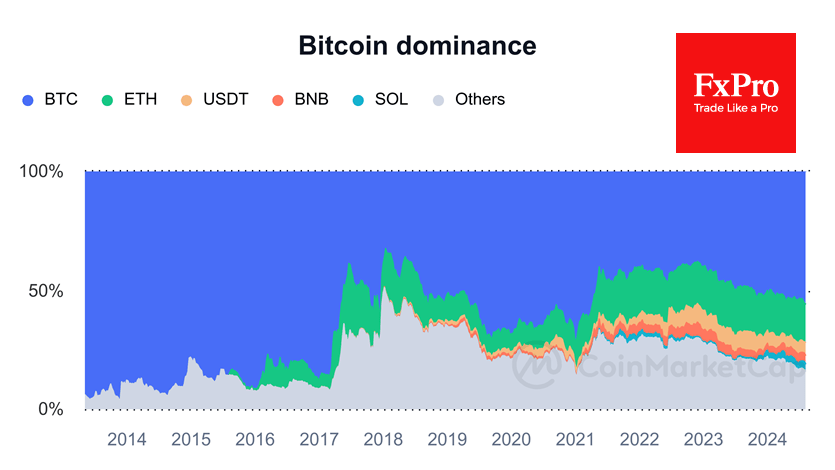
Meanwhile, bitcoin’s share of all cryptocurrencies continues to rise, standing at 55.8%, up from 53.7% a month ago and 48.7% a year ago. This is normal, as altcoins are obviously in weaker hands at this stage of the market.
News background
Abra warned of the risks of increased volatility in the cryptocurrency market, noting that the VIX fear index has risen to its highest level since the 2020 market collapse. Implied volatility (IV) will remain high until the macroeconomic situation calms down.
An analyst at Rekt Capital said that based on Bitcoin’s historical fluctuations, the bearish trend could continue for another two months. In his opinion, BTC’s bullish trend will resume as early as October, but don’t expect a renewal of the historic high anytime soon.
Factor founder Peter Brandt drew parallels between BTC’s recent collapse and the 2016 crash, which was followed by a bullish rally. If BTC follows the trajectory of past post-halving bull cycles, it will reach $130K-$150K by the end of August 2025.
UK hedge fund Capula Investment Management reported owning $464 million worth of bitcoin ETF shares. Capula is the fourth largest hedge fund in Europe, with $30 billion in assets under management.
Japanese Metaplanet will spend $59 million to buy Bitcoin. The decision was made amid volatility in the local stock market and a significant strengthening of the local currency.
EUR/CHF Outlook: Bounces from Multi-Year Low on Fresh Risk Appetite/SNB Intervention Talks
EURCHF edged higher in early trading on Wednesday on s=initial signals that risk appetite is gaining traction.
The pair from new multi-year low after being hit by surge in risk aversion in past few days, sparked by worsening economic and geopolitical conditions, which provided strong tailwinds to safe-haven Swiss franc.
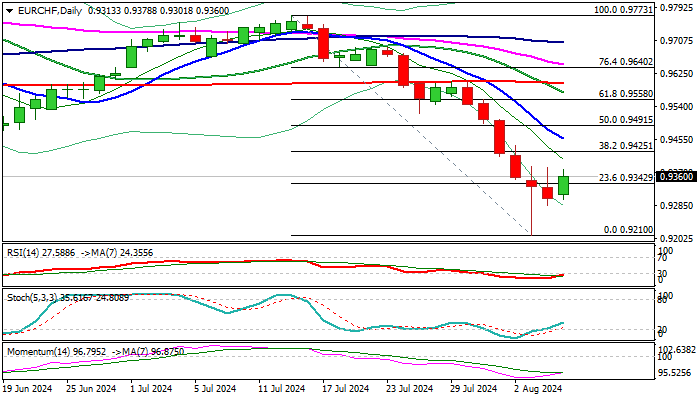
Strong bounce from new low at 0.9210 came on likely intervention by Swiss National Bank, aiming to curb strong gains of national currency.
However, recovery still needs to gain pace to generate initial reversal signal, with minimum requirement for close above broken Fibo barrier at 0.9342 (23.6% of 0.9731/0.9210).
The picture on daily chart is negative (double death-cross of 10/200 and 20/200DMA’s / 14-d momentum deeply in negative territory, suggesting that correction may be limited.
Falling 10 DMA (0.9456) and June low (0.9477) mark significant barriers, followed by 0.9490 (50% retracement), with extended upticks to stay below upper pivot at 0.9600 (200DMA) to keep in play prospects for fresh push lower.
Res: 0.9425; 0.9456; 0.9477; 0.9490.
Sup: 0.9342; 0.9301; 0.9285; 0.9210.
USD/CHF: Can The Dollar Rebound from Its Plunge?
Key Highlights
- USD/CHF declined heavily below the 0.8700 support and tested 0.8430.
- A major bearish trend line is forming with resistance at 0.8600 on the 4-hour chart.
- Bitcoin started a recovery wave from the $48,500 zone.
- Gold corrected gains and might revisit the $2,350 support.
USD/CHF Technical Analysis
The US Dollar started a major decline from well above 0.8850 against the Swiss Franc. USD/CHF traded below 0.8700 and 0.8650 to enter a bearish zone.
Looking at the 4-hour chart, the pair settled below the 0.8600 level, the 200 simple moving average (green, 4-hour), and the 100 simple moving average (red, 4-hour). It even crashed below the 0.8500 level.
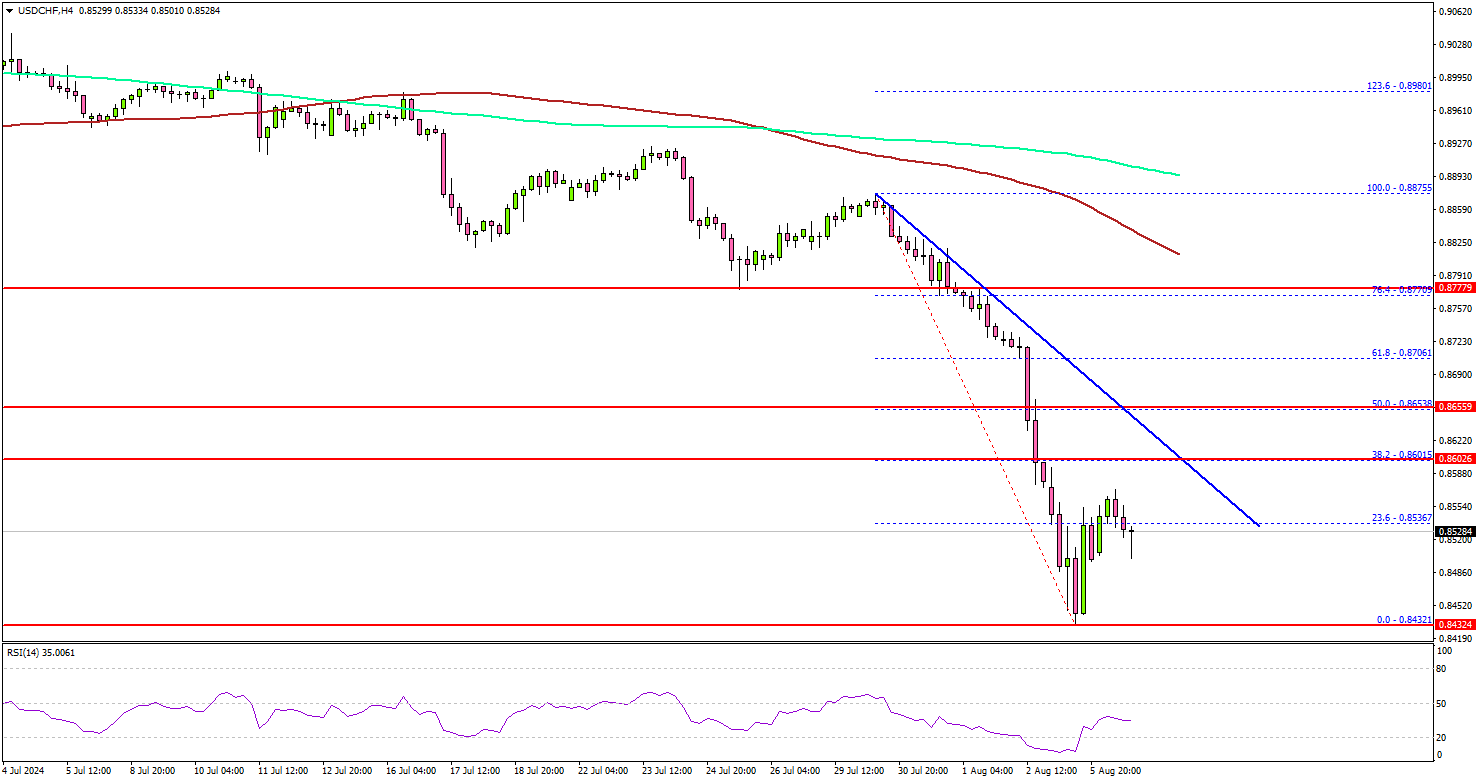
A low was formed near 0.8432 before the pair started a recovery wave. There was a move above the 0.8500 level. The pair tested the 23.6% Fib retracement of the downward move from the 0.8875 swing high to the 0.8432 low.
Immediate resistance sits near the 0.8585 level. The next resistance sits at 0.8600. There is also a major bearish trend line forming with resistance at 0.8600 on the same chart.
A clear move above 0.8600 could open the door to more gains. In the stated case, the pair could rise and test 0.8650, and the 50% Fib retracement of the downward move from the 0.8875 swing high to the 0.8432 low.
Immediate support is near the 0.8480 level. The next major support is near the 0.8440 level. A downside break and close below the 0.8440 support zone could open the doors for more losses. In the stated case, USD/CHF might decline toward the 0.8400 level.
Looking at Bitcoin, the price started a recovery wave above the $53,500 level but faces many hurdles near $56,500 and $58,000.
Economic Releases
- EIA Crude Oil Stocks Change – Forecast 0.85M, versus -3.436M previous.
USDJPY Begins a Healing Process
- USDJPY gears up after 7-month low
- Recent sharp sell-off looks overdone
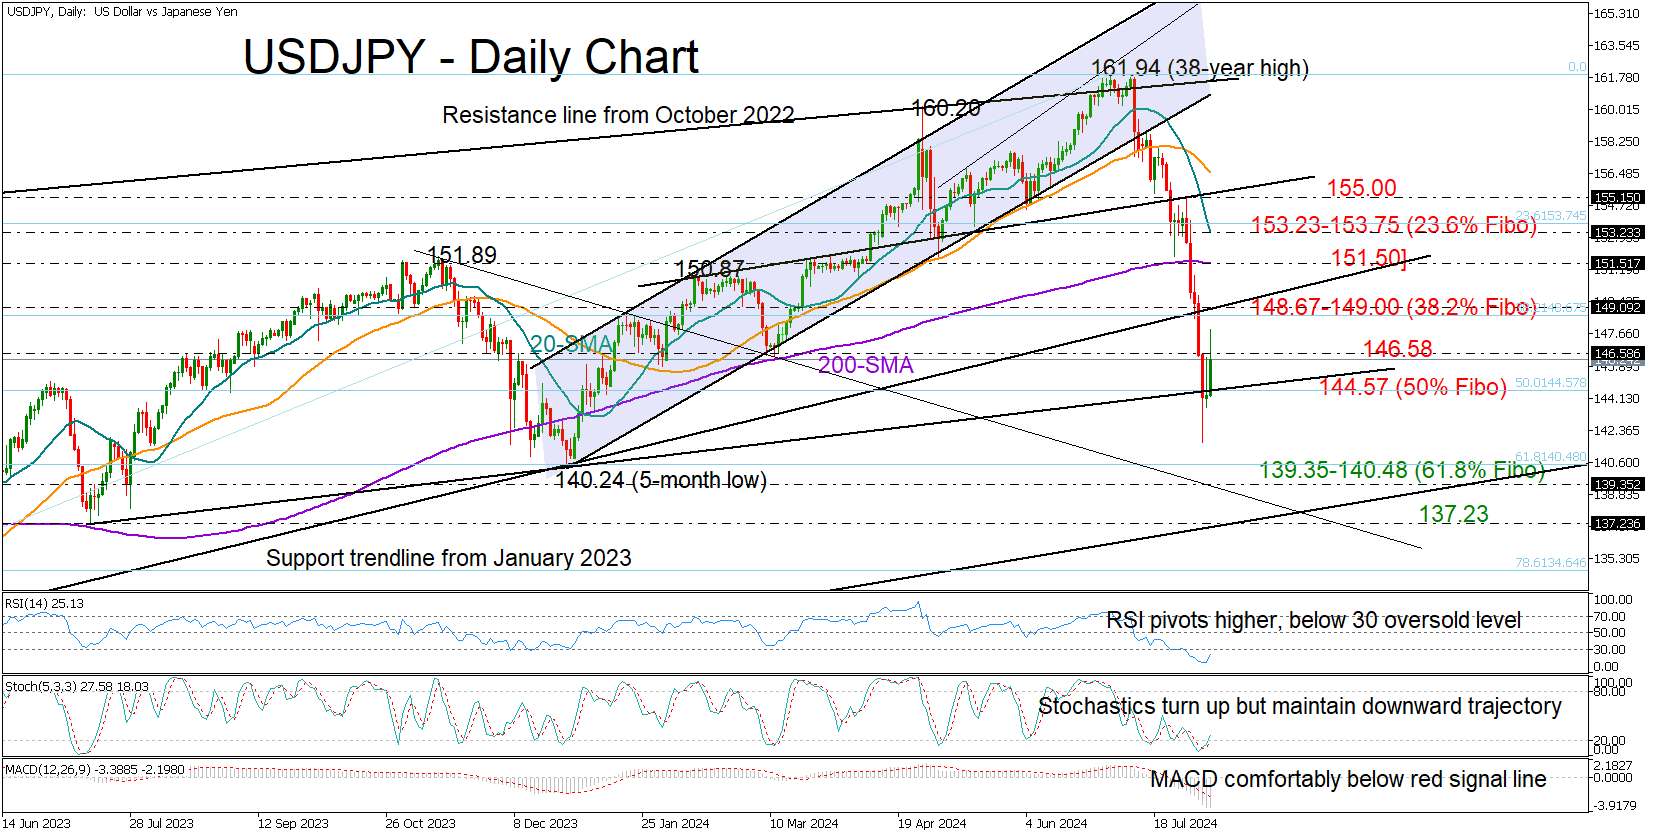
- Bulls hope for a close above 146.58 to continue higher
USDJPY showed signs of life on Wednesday, forcefully bouncing above the 144.57 bar that had limited Tuesday’s gains following the flash spike to 146.35.
There is still a chance for sellers to reverse today’s bull run since the RSI and stochastic oscillator have not moved out of the bearish area. However, with the indicators hovering within the oversold region, downward pressures might soon subside.
More importantly, if the pair manages to complete a bullish doji candlestick pattern by recouping Monday’s freefall above 146.58, the pair might receive fresh buying interest likely towards the 149.00 constraining zone. Even higher, the spotlight will fall on the 200-day simple moving average (SMA) at 151.50, a break of which could navigate the price straight to the 20-day SMA at 153.20.
On the downside, the key support trendline drawn from July 2023 will be closely watched along with the 50% Fibonacci retracement of the 2023-2024 uptrend at 144.57. If that base collapses, the price is expected to fall rapidly into the 139.35-140.48 zone formed by the descending constraining line from November 2023 and the 61.8% Fibonacci level. Another step lower could target the 2021 ascending trendline at 137.23.
Overall, it appears that the recent aggressive sell-off in USDJPY has reached a bottom. The bulls face a challenging task for a full recovery, but closing above 146.58 could give their recovery attempt a boost.
Market Analysis: GBP/USD Dives While EUR/GBP Gains Strength
GBP/USD started a fresh decline from the 1.2860 resistance zone. EUR/GBP is rising and might climb above the 0.8620 resistance.
Important Takeaways for GBP/USD and EUR/GBP Analysis Today
- The British Pound is showing bearish signs below the 1.2800 support.
- There is a key bearish trend line forming with resistance near 1.2750 on the hourly chart of GBP/USD at FXOpen.
- EUR/GBP is gaining pace and trading above the 0.8500 zone.
- There is a short-term contracting triangle forming with support near 0.8570 on the hourly chart at FXOpen.
GBP/USD Technical Analysis
On the hourly chart of GBP/USD at FXOpen, the pair failed to stay above the 1.2860 pivot level. As a result, the British Pound started a fresh decline below 1.2820 against the US Dollar.
There was a clear move below 1.2800 and the 50-hour simple moving average. The bears pushed the pair below 1.2750. Finally, there was a spike below the 1.2680 support zone. A low was formed near 1.2673 and the pair is now consolidating losses.
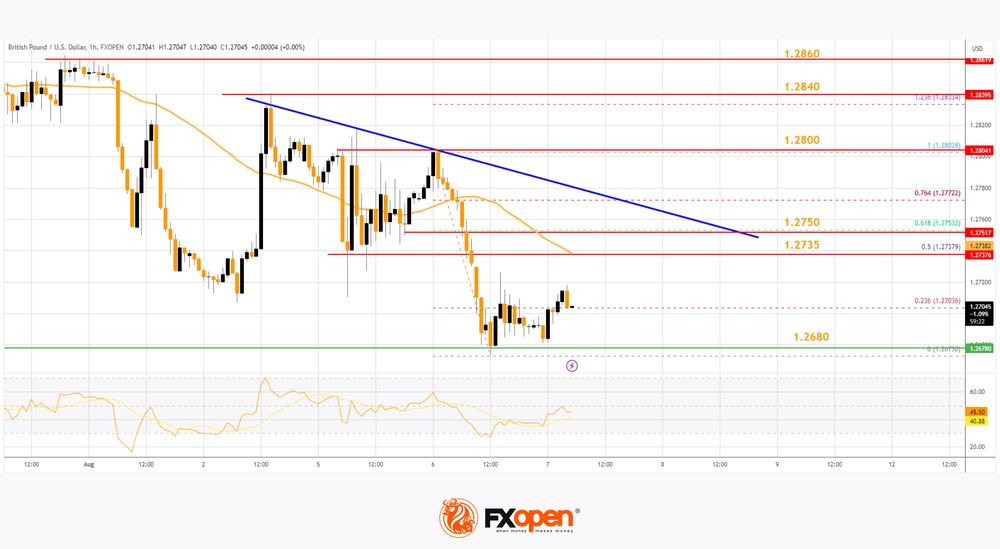
There was a minor move above toward the 23.6% Fib retracement level of the downward move from the 1.2802 swing high to the 1.2673 low.
On the upside, the GBP/USD chart indicates that the pair is facing resistance near the 50-hour simple moving average at 1.2735 and the 50% Fib retracement level of the downward move from the 1.2802 swing high to the 1.2673 low.
The next major resistance is near a bearish trend line at 1.2750 on the same chart. A close above the 1.2750 resistance zone could open the doors for a move toward 1.2800. Any more gains might send GBP/USD toward 1.2840.
On the downside, there is a key support forming near 1.2680. If there is a downside break below the 1.2680 support, the pair could accelerate lower. The next major support is near the 1.2620 zone, below which the pair could test 1.2585. Any more losses could lead the pair toward the 1.2540 support.
EUR/GBP Technical Analysis
On the hourly chart of EUR/GBP at FXOpen, the pair started a decent increase from the 0.8415 zone. The Euro traded above the 0.8465 resistance level to enter a positive zone against the British Pound.
The pair settled above the 50-hour simple moving average and 0.8515. The pair traded as high as 0.8618 before there was a downside correction. There was a move below the 23.6% Fib retracement level of the upward move from the 0.8416 swing low to the 0.8618 high.
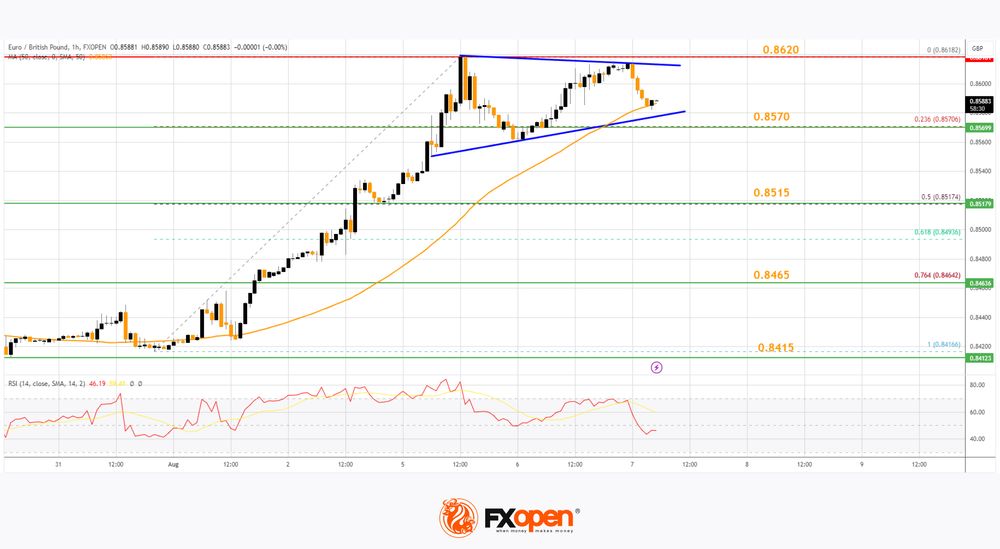
However, the pair is stable above 0.8550. There is also a short-term contracting triangle forming with support near 0.8570.
The next major support is near the 50% Fib retracement level of the upward move from the 0.8416 swing low to the 0.8618 high at 0.8515. A downside break below the 0.8515 support might call for more downsides. In the stated case, the pair could drop toward the 0.8465 support level. Any more losses might call for an extended drop toward the 0.8415 pivot zone.
The EUR/GBP chart suggests that the pair is facing resistance near the 0.8620 zone. A close above the 0.8620 level might accelerate gains. In the stated case, the bulls may perhaps aim for a test of 0.8650. Any more gains might send the pair toward the 0.8685 level.
Trade over 50 forex markets 24 hours a day with FXOpen. Take advantage of low commissions, deep liquidity, and spreads from 0.0 pips. Open your FXOpen account now or learn more about trading forex with FXOpen.
This article represents the opinion of the Companies operating under the FXOpen brand only. It is not to be construed as an offer, solicitation, or recommendation with respect to products and services provided by the Companies operating under the FXOpen brand, nor is it to be considered financial advice.