
Sample Category Title
Remember Inflation? July CPI Preview
Summary
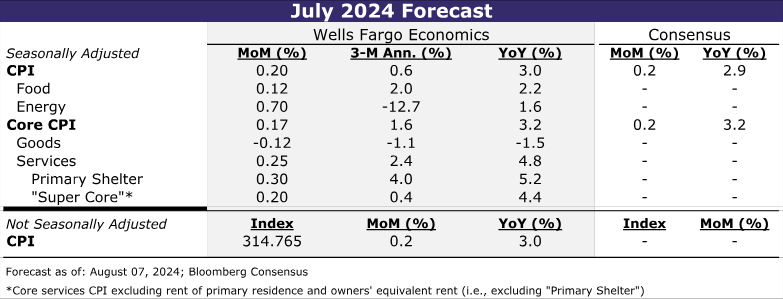
The July CPI report is likely to further the case that inflation is quieting down even if it has not yet returned all the way back to the Fed's target. We look for headline CPI to have advanced 0.2% in July, which would keep the year-over-year rate steady at more than a three-year low of 3.0%. The core CPI also looks set to advance 0.2% in July amid a rebound in some of the more volatile "super core" components. However, we expect the step-down in shelter inflation from the first five months of the year to be sustained and for prices among core goods to continue to decline outright. If realized, the 12-month change in the core CPI would fall to a fresh cycle low of 3.2%.
Looking beyond July, we expect inflation to continue to subside. Labor costs are no longer a meaningful threat to the Fed's 2% inflation target, as growth in the labor force has coincided with fading demand for workers. Meantime, downward pressure on price growth from weakening consumer demand is mounting and driving inflation for discretionary items back to its 2019 pace. While the year-over-year rate of core PCE inflation is likely to remain stuck around its current rate through the end of the year, the annualized pace of inflation looks set to ease back in-line with the FOMC's target. Amid increasingly worrisome conditions in the labor market, we expect the Fed to consider inflation is close enough to its target and embark on a rate cutting cycle at its next meeting.
July CPI Poised for Another Tame Increase
Weakening in the jobs market may have finally stolen the spotlight from inflation, but the extent to which the FOMC reacts to the dimming labor picture depends in part on how price data unfold from here. The past two months of inflation prints have shown that the downward trend in price growth is back on track after the first quarter's derailment. The July CPI report is likely to further the case that inflation is quieting down even if it has not yet returned to the Fed's target.
We estimate headline CPI rose 0.2% in July, which would keep the 12-month change steady at a more than a three-year low of 3.0%. Although gasoline prices rose a little over 1% during the month, grocery store prices were likely little changed amid more stable input prices and rising promotional activity.
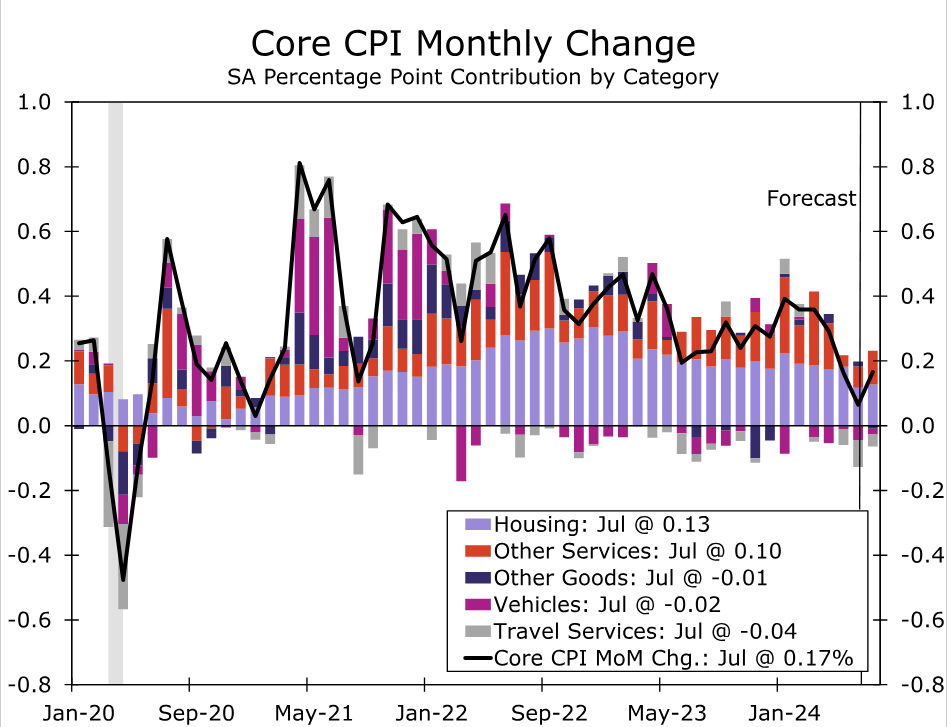
Excluding food and energy, we also look for a tame 0.2% increase, even as that would mark a slight pickup relative to June (Figure 1). If realized, the year-over-year rate of core inflation would edge down to 3.2%, with the three-month annualized rate of 1.6% pointing to a further moderation in the 12-month change ahead. Goods prices are likely to decline another 0.1% in July. However, there are tentative signs that outside of autos, goods deflation is losing steam, with the year-over-year rate of "other" core goods starting to turn higher.
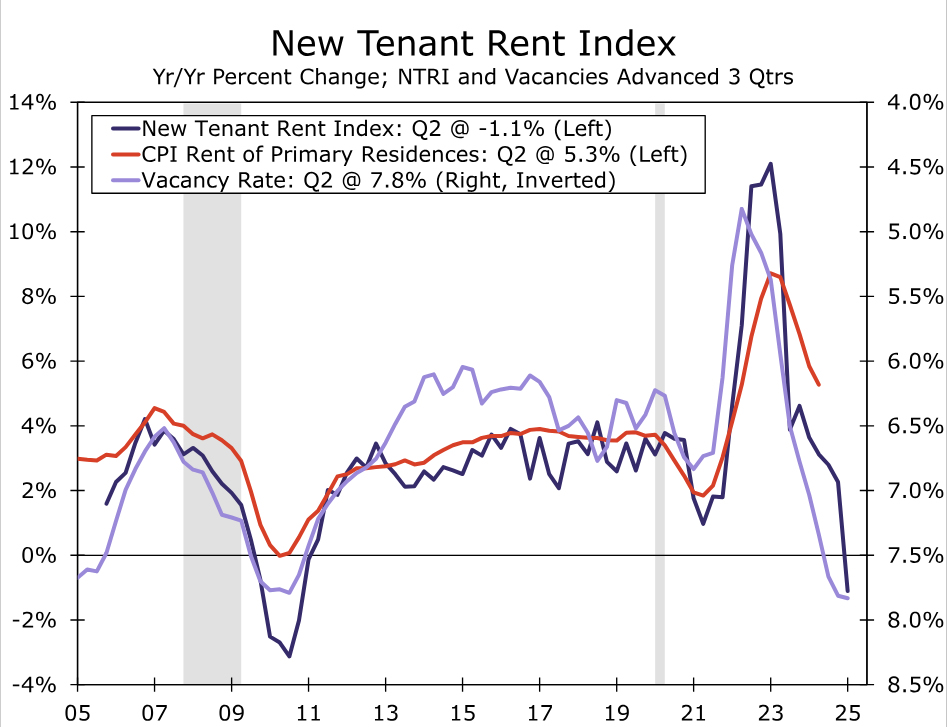
With core goods inflation already running below its pre-pandemic pace, more material cooling in services is needed to continue to drive core inflation lower. Core services prices look to have advanced more quickly in July relative to June, but the 0.25% increase we have penciled in would still be noticeably below the 0.40% average monthly increase over the first six months of the year. We anticipate July's monthly pickup to be driven by the “super core” after June's sharp drop in the volatile travel services category and a below-trend rise in medical care services. However, June's downshift in primary shelter looks to be sustainable based on the BLS's New Tenant Rent Index and private sector vacancies (Figure 2). We look for another 0.3% rise in July and for primary shelter to increase 0.25%–0.30% per month through the end of the year.
Seasonal factors also look be supportive of keeping core CPI in check for July, although to a smaller extent than was the case in June. Prices during the month of July the past five years have risen nearly in line with the full calendar year average change in prices, whereas in the years preceding the pandemic, the month of July tended to see below-average price increases. If the calendar-year timings of price adjustments are moving back to their pre-pandemic patterns, the moderating trend in inflation could be flattered by the seasonal factor “expecting” a larger increase. While this dynamic may make for a more favorable monthly print in July, the reverse of this dynamic looks set to occur in September and push up the monthly reading somewhat.
Diminished Pricing Power to Push Inflation Down
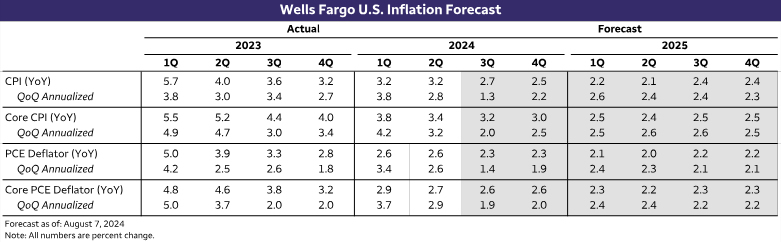
Looking further ahead, inflation should continue to subside on trend in the coming quarters, even as it remains modestly above the Fed's target (Figure 3). The supply-side of the economy may not be healing as quickly as in 2022 or 2023, but the disinflationary impact of earlier improvement is still working its way to consumer prices. Goods and services providers alike are experiencing slower growth in employment costs. Unit labor costs are running below 2%, highlighting how the state of the labor market is no longer a threat to the Fed's inflation target. And while services inflation has been slower than goods inflation to cool, just as it was slower to take off, it should benefit from more subdued cost growth in physical inputs, as goods inflation is now running below its pre-pandemic pace.
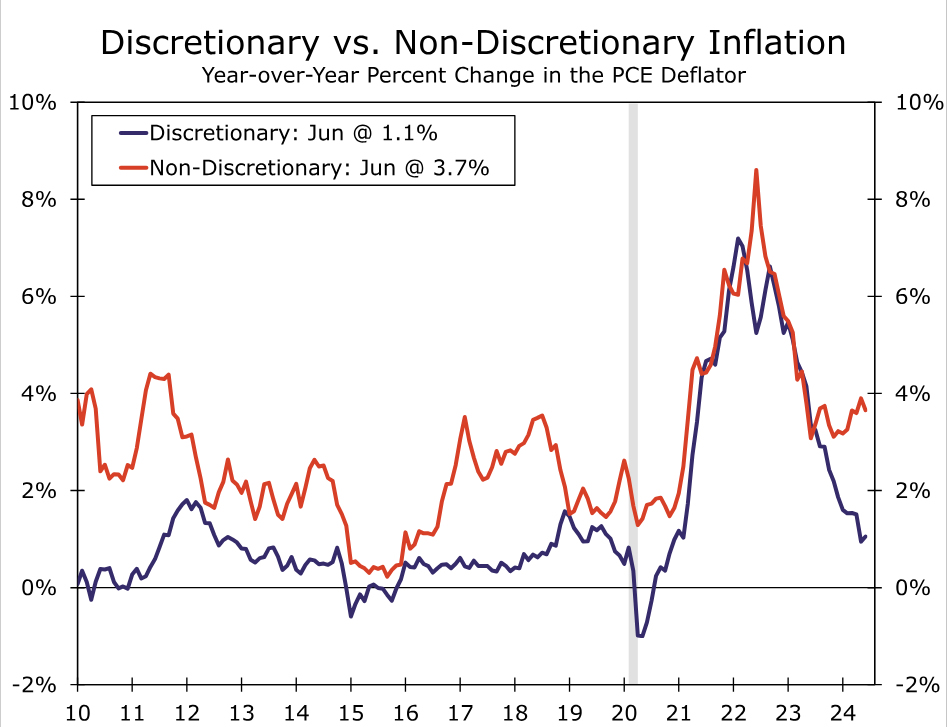
Meantime, downward pressure on price growth from softer demand is mounting. Consumers are not the price-takers they were earlier in the post-pandemic recovery. Anecdotal evidence from the Fed's Beige Book underscores diminished pricing power of firms; the national summary in the July report points out that “almost every District mentioned retailers discounting items or price-sensitive consumers only purchasing essentials, trading down in quality, buying fewer items, or shopping around for the best deals.” The growing reluctance to shell out for discretionary purchases is showing up in price growth. Over the past year, inflation related to discretionary goods and services has fallen back into line with its 2019 average (Figure 4).1 Non-discretionary inflation should ease somewhat further as slower rent growth over the past two years is finally captured by the official data.
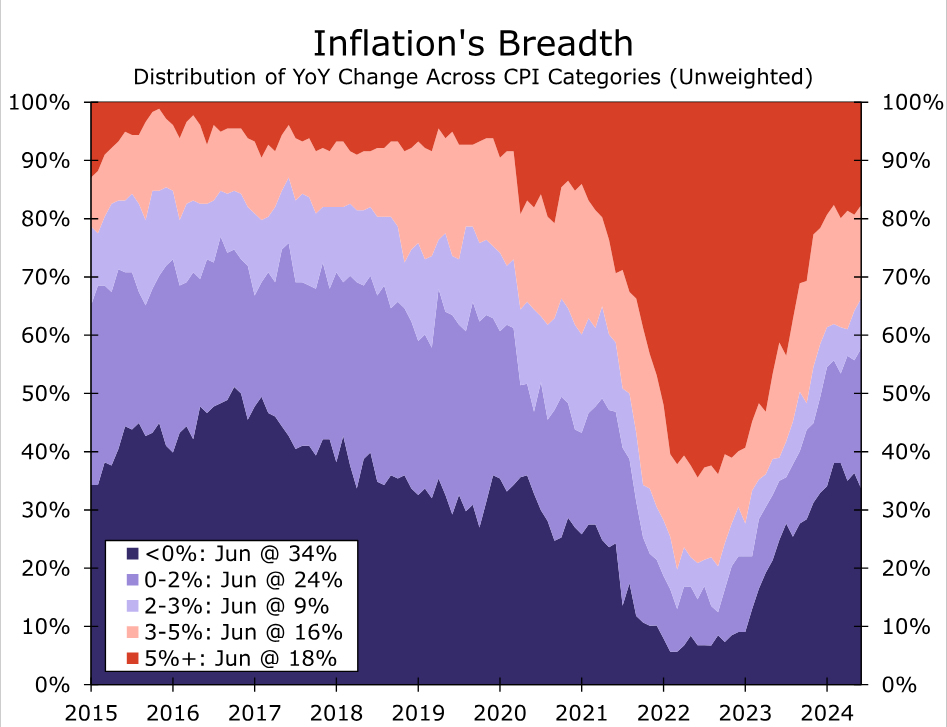
Amid supply-side improvements and growing price-sensitivity among consumers, disinflation has become more broad-based. Price growth in 58% of CPI categories has slowed below 2% year-over-year compared to 35% a year ago (Figure 5), while the Median CPI is up at a three-month annualized rate of 3.2%—its slowest pace since inflation took off in the spring of 2021. Broadening disinflation is also evident within the Fed's preferred PCE deflator. The Trimmed Mean PCE index continued to moderate on a year-over-year basis in June even as the traditional core index was unchanged at 2.6%.
We look for inflation to trudge lower in the months ahead. Improvement is likely to be more evident in the Consumer Price Index than the PCE deflator due to the CPI's larger weighting of shelter inflation and motor vehicle insurance.2 However, while the year-over-year rate of core PCE inflation is likely to remain stuck around its current rate through the end of the year, the annualized pace of inflation looks set to ease back in-line with the FOMC's target (refer back to Figure 3). Amid increasingly worrisome conditions in the labor market, we expect the Fed to consider inflation is close enough to its target and embark on a rate cutting cycle at its next meeting.
Endnotes
1 – Our definition of non-discretionary spending categories includes food & non-alcoholic beverages for off-premises consumption; gasoline & other energy goods; pharmaceutical & other medical products; therapeutic appliances & equipment; housing & utilities; health care services; financial services & insurance; and communication services. These categories of spending represent about 55% of all personal consumption, with the remaining 45% of all other goods and services spending making up discretionary spending.
2 – In addition to a larger weighting of motor vehicle insurance in the CPI relative to the PCE deflator, the pricing differences in the two indices mean a sustained step down in price growth of motor vehicle premiums will show up more prominently in the CPI. In the CPI, insurance costs reflect the premiums paid by consumers, but not claims paid out by insurers on behalf of motorists. The PCE's net-revenue approach has contributed to motor vehicle insurance prices rising less dramatically since insurers' costs to cover claims have risen rapidly alongside higher vehicle repair and replacement costs.
Preview of RBNZ: Nearing the Finish Line – But Not Quite There Yet
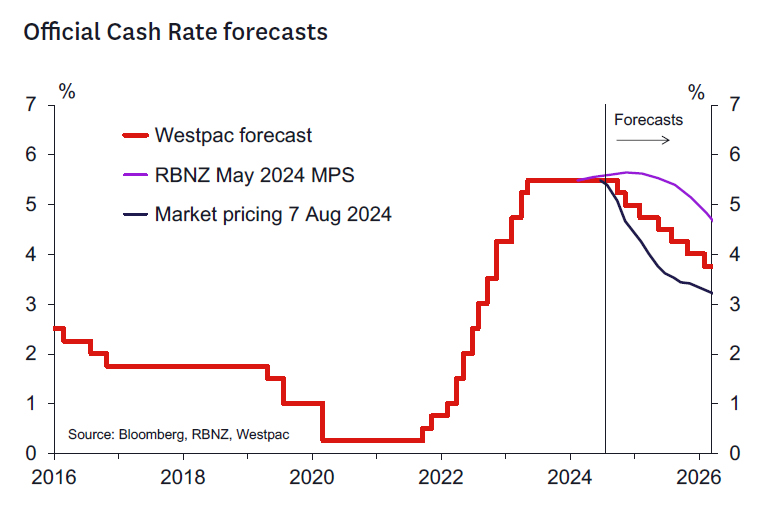
- We expect the RBNZ will leave the OCR at 5.5% at the August Monetary Policy Statement.
- We expect a significant revision in the forward view for the OCR consistent with potential easing in October and November, leaving the year end OCR at 5%.
- We also expect significant downward revisions to the 2025 and 2026 OCR profiles.
- We expect significant downward revisions to the RBNZ's growth projections for 2024.
- The RBNZ's short term CPI forecasts will likely be reduced, consistent with the downside surprise seen in the June quarter CPI.
- Further out, inflation will continue to fall more slowly – although the CPI may now be forecast at 2% somewhat earlier than in the May Statement.
Key developments since the May Monetary Policy Statement.
Overall, a broad range of activity and pricing indicators have pointed to a more favourable inflation outlook compared to what the RBNZ had contemplated at the time of the May meeting. We think the following are the key developments.
- Inflation (↓): The CPI rose a less than expected 0.4%q/q in Q2, lowering annual inflation to 3.3% and making it likely that inflation will move back inside the target band in Q3. The RBNZ will likely welcome the lower outcome, as the more favourable narrative will feed back into inflation expectations. However, the RBNZ will be concerned that all the downside surprise was attributable to lower-than-expected prices for tradables (mostly goods), whereas non-tradables (mostly services) prices continued to inflate at a pace that is inconsistent with inflation returning to the midpoint of the target band.
- Inflation expectations/pricing indicators (↓): Survey measures of firms' intentions to raise prices (such as those in the QSBO and ANZ business surveys) have moved markedly lower in recent months to levels that are now just a little above their historical ranges. Direct measures of business and consumer inflation expectations have also continued to move lower.
- Activity (↓↓): While GDP grew 0.2% in Q1, in line with the RBNZ's expectations, high frequency top-down indicators (such as the Business NZ PMIs) suggest that the economy has likely contracted significantly in Q2. Westpac estimates a 0.6% decline in GDP, in sharp contrast to the RBNZ's forecast of modest growth. And at this stage there is little sign that the economy is going to rebound in Q3. This means that the "output gap" – a key variable in the RBNZ's inflation forecast framework – is likely to be tracking more negatively than was forecast, implying weaker medium-term term pressures on domestic inflation.
- Labour market (↓): The Q2 surveys provided no surprises for the RBNZ, at least as far as the key headline numbers are concerned. The unemployment rate increased to 4.6% and private labour costs increased 0.9%q/q in Q2 – exactly in line with the RBNZ's May projections. A 1.2% q/q decline in hours worked may have been a downside surprise (the RBNZ does not forecast this series) and may add to the RBNZ's sense that GDP likely contracted in Q2 (especially as the employer-based QES survey also reported a 0.9%q/q decline in hours paid).
- Housing market/population growth (↓): Reflecting the broader malaise in the economy, the housing market has remained weak in recent months with a surplus of listings causing house prices to nudge lower. Meanwhile, the migration cycle appears to be turning down more quickly than the RBNZ had forecast in May, suggesting less support for the housing market than had been suggested by earlier forecasts. Lower mortgage rates and interest rate expectations could be a significant offset, however.
- Global growth (→): We doubt the RBNZ's assumptions for the global growth outlook has changed much in recent months. They may discuss some downside risks to growth in China, especially as far as consumer activity has concerned, and given recent equity market volatility. There has been some softening of activity indicators in Europe of late. The US economy has continued to grow at a steady pace, albeit not sufficient to prevent a gradual uptrend in the unemployment rate. Lower official interest rates offshore could be seen as a supportive factor.
- Commodity prices (→): Commodity prices have been a mixed bag since May. Dairy prices are little changed, while meat prices have improved slightly (albeit remaining very low in the case of sheep meat). Log prices have remained low after falling sharply in April, while aluminium prices have fallen sharply.
- Financial conditions/exchange rate (↑↑): Financial conditions have eased markedly in recent months as wholesale interest rates have moved to anticipate significant policy easing in both New Zealand and the US. In addition, the trade weighted exchange rate (TWI) currently sits at 69.8, versus the RBNZ's medium-term assumption of 71.0.
The communications objective.
We think the RBNZ will be aiming to deliver a "hawkish cut" to their OCR outlook while NOT cutting the OCR, thus sanctioning some – but not all – of the easing of monetary conditions seen in recent months. They will be setting the scene for cuts in October and November of 50 bp in total and leaving open the option to scale easing either up or down should the data or financial conditions warrant. The RBNZ will be reluctant for the market to run any further ahead of it than it currently is. We suspect the RBNZ has no fixed view on the longer-term path for the OCR given the significant uncertainties ahead.
Scenarios.
We see three main scenarios and one outside scenario:
- Baseline case (50% probability): the RBNZ leaves the OCR unchanged but indicates at least one 25 bp cut and a 50% chance of a further 25 bp cut by year end (this would be represented by a Q4 OCR forecast in the 5.1-5.2% range). The forward profile will likely be revised down such that the OCR will be implied to be between 4.25 and 4.5% by end 2025.
- Hawkish case (30% probability): the RBNZ leaves the OCR unchanged, and the projection implies just one 25 bp cut in November 2024 (i.e., a Q4 OCR forecast in the 5.35-5.45% range). The forward profile would be consistent with 2-3 cuts in 2025 leaving the OCR in the 4.5-4.75% range by the end of 2025.
- Dovish case (15% probability): the RBNZ cuts the OCR by 25 bp and indicates two further 25 bp cuts in 2024 taking the OCR to 4.75% by year end (i.e., a Q4 OCR forecast in the 4.9-5 % range). The forward profile will be revised down to reach short run neutral of around 3.75-4% by end 2025.
- A super dovish case (5% probability): the RBNZ cuts the OCR by 25 bp and indicates a total of 100 bp by end 2024 including one 50-point cut – likely in November. This would see the Q4 OCR forecast in the 4.8-4.9% range. The RBNZ would indicate the possibility of cutting the OCR to their long run neutral level of 2.75- 3% by the end of 2025.
Review of the June 2024 labour market reports.
Today's survey results showed that the labour market is continuing to soften, but no faster or slower than the RBNZ was anticipating. The unemployment rate rose from 4.4% to 4.6% for the June quarter, in line with the RBNZ's forecast in its May Statement. The household survey showed a surprising lift in employment, though this was most likely payback from the surprisingly weak result in the March quarter. Employment has risen by just 0.6% over the last year, far less than what was needed to absorb the 2.6% growth in the working-age population.
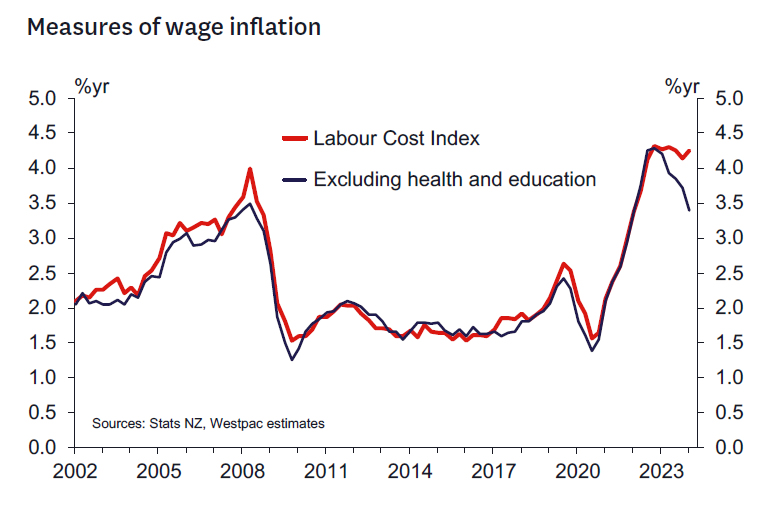
Despite the increasing slack in the labour market, wage inflation has been slow to reflect this. The Labour Cost Index rose by 1.1% for the June quarter, with the annual growth rate actually ticking up slightly to 4.2%. Private sector wages rose by 0.9% for the quarter, in line with the RBNZ's forecast.
The overall wage index continues to be boosted by pay increases in the health and education sectors, which were agreed by the previous government and implemented in stages. We estimate that excluding these sectors, labour costs rose by 3.4% in the year to June. That pace has slowed from its highs, but is still some way above what would be consistent with the RBNZ's 2% inflation target. Wage growth will be of interest to the RBNZ, given that much of the remaining 'stickiness' in inflation relates to domestic services where labour is a major input cost.
Brent Oil Price Analysis: Anticipating a Correction
Brent crude oil's price increased to 76.88 USD per barrel on Wednesday, continuing to rise for the second consecutive session. This rebound helps mitigate previous losses, which were part of a broader market risk aversion phase.
Current market dynamics
Investor concerns about energy supply disruptions are heightening due to political developments in Hamas and ongoing unrest affecting Libya's Sharara oil field. These factors contribute to apprehensions about potential threats to oil supply from the Middle East.
Additionally, the latest data from the American Petroleum Institute (API) indicated a modest rise in US oil inventories, less than market forecasts, which had anticipated a more considerable increase. This was the first inventory build in five weeks, adding a layer of complexity to market dynamics.
Broader economic concerns, including fears of a US recession and weak Chinese demand, continue to exert downward pressure on oil prices.
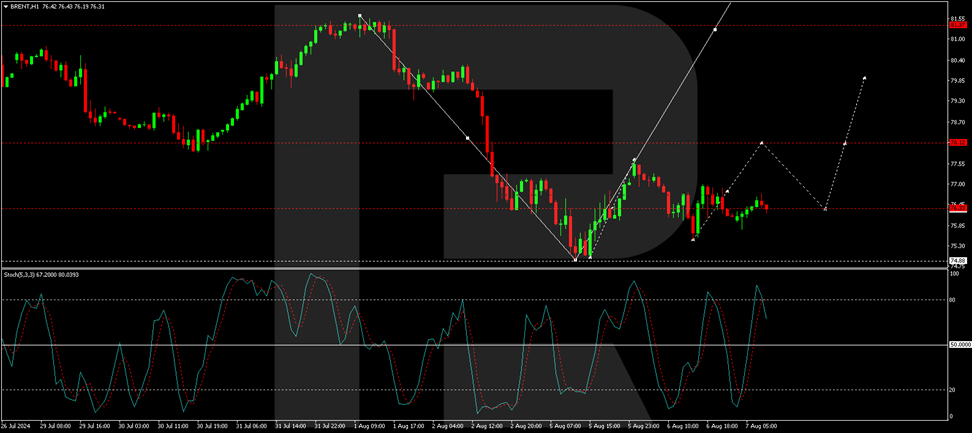
Technical analysis of Brent
The H4 chart suggests that Brent is progressing towards the 78.12 USD level. After reaching this target, a pullback to 76.33 USD could occur, potentially setting the stage for another upward movement towards 79.85 USD and extending to 81.37 USD. The MACD indicator supports this bullish scenario, with the signal line positioned for upward momentum from current lows.
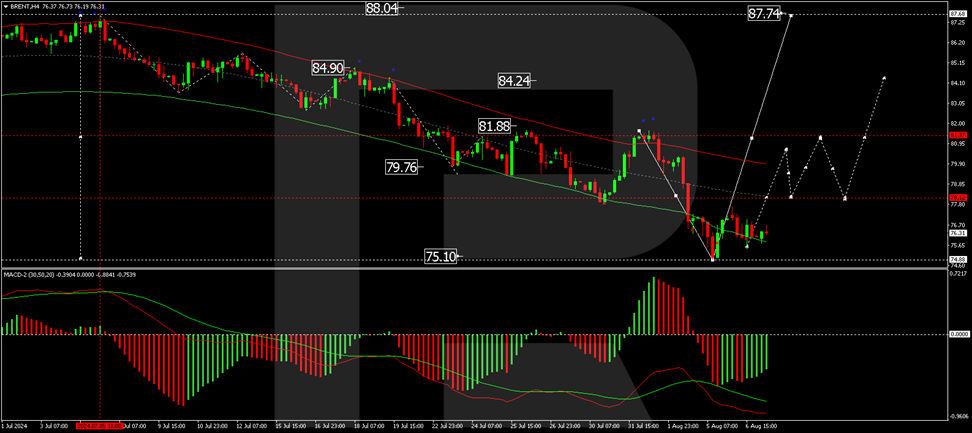
On the H1 chart, Brent has established a consolidation range of around 76.33 USD. An upward breakout towards 78.12 USD is anticipated. Once this target is achieved, a retracement to 76.33 USD might follow. The Stochastic oscillator is poised near the 80 level, suggesting an impending downturn, which aligns with the expected corrective phase following the initial rise.
Market outlook
Investors should monitor further geopolitical developments and additional inventory reports, which could significantly influence oil price movements. The upcoming Federal Reserve communications and economic indicators will also be crucial in shaping market sentiment, especially concerning the potential for economic slowdowns, which could impact oil demand.
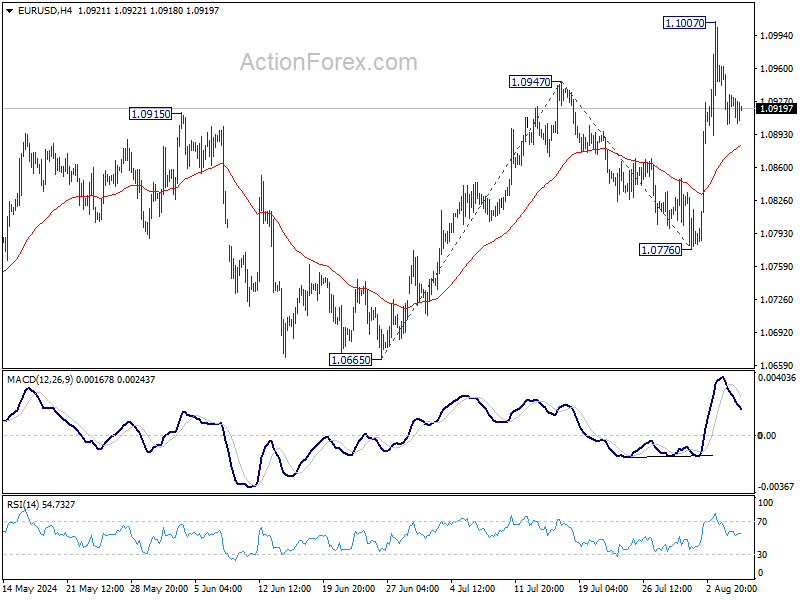
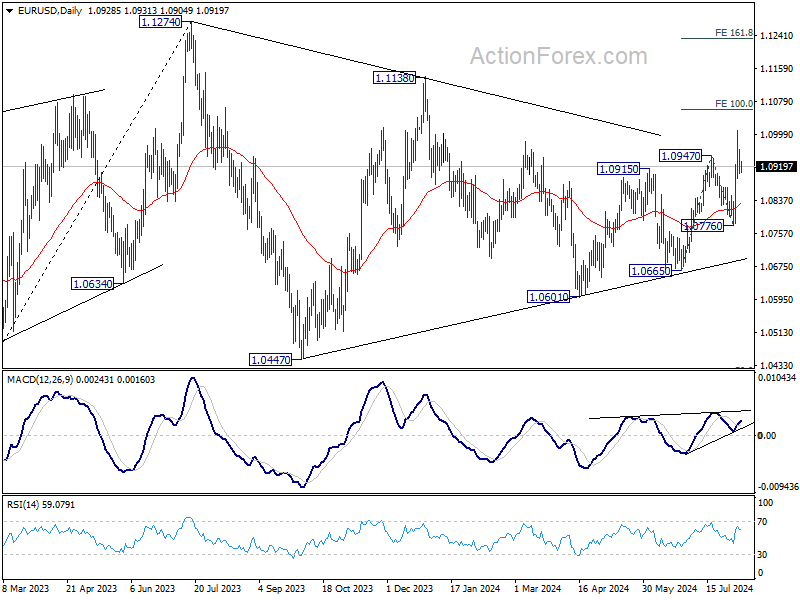
EUR/USD Mid-Day Outlook
Daily Pivots: (S1) 1.0903; (P) 1.0933; (R1) 1.0962; More.....
Intraday bias in EUR/USD stays neutral and more consolidations would be seen below 1.1007. While deeper retreat cannot be ruled out, downside should be contained well above 1.0776 support. On the upside, break of 1.1007 will resume recent rally from 1.0665 to 100% projection of 1.0665 to 1.0947 from 1.0776 at 1.1056 next.
In the bigger picture, price actions from 1.1274 are viewed as a corrective pattern that's still be in progress. Break of 1.1138 resistance will be the first signal that rise from 0.9534 (2022 low) is ready to resume through 1.1274 (2023 high). However, break of 1.0776 support will extend the correction with another falling leg back towards 1.0447 support.
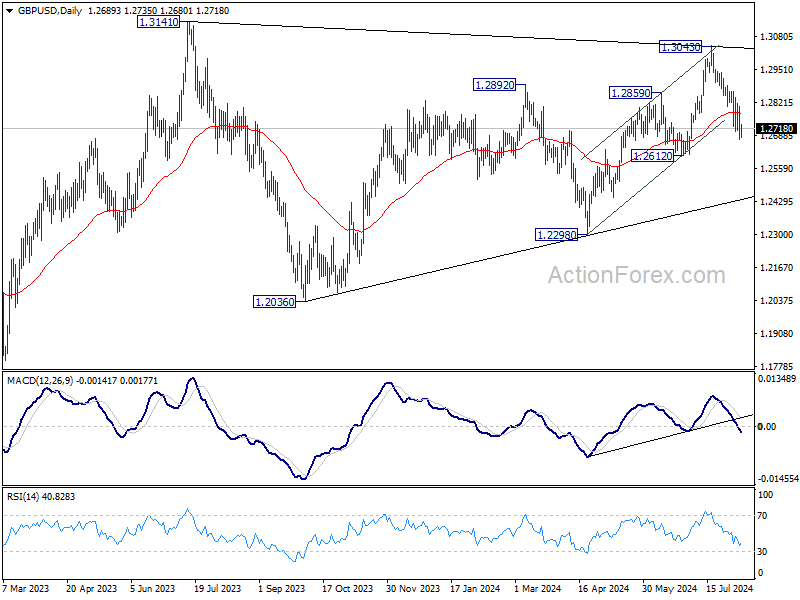
GBP/USD Mid-Day Outlook
Daily Pivots: (S1) 1.2642; (P) 1.2723; (R1) 1.2772; More...
Intraday bias in GBP/USD stays on the downside and fall from 1.3043 should continue to 1.2612 support. Decisive break there should confirm that rise from 1.2298 has completed, and target this support next. For now, risk will remain on the downside as long as 1.2839 resistance holds, in case of recovery.
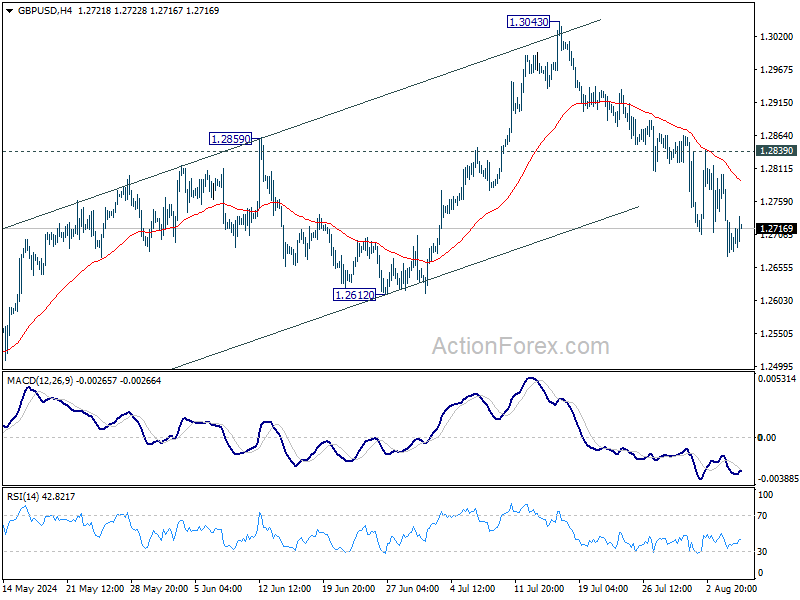
In the bigger picture, current development suggests that corrective pattern from 1.3141 is extending with fall from 1.3043 as another leg. Break of 1.2612 support would strengthen this case. But still, downside should be contained by 1.2036/2298 support zone even in case of deep decline. Rise from 1.0351 (2022 low) remains in favor to resume at a later stage.
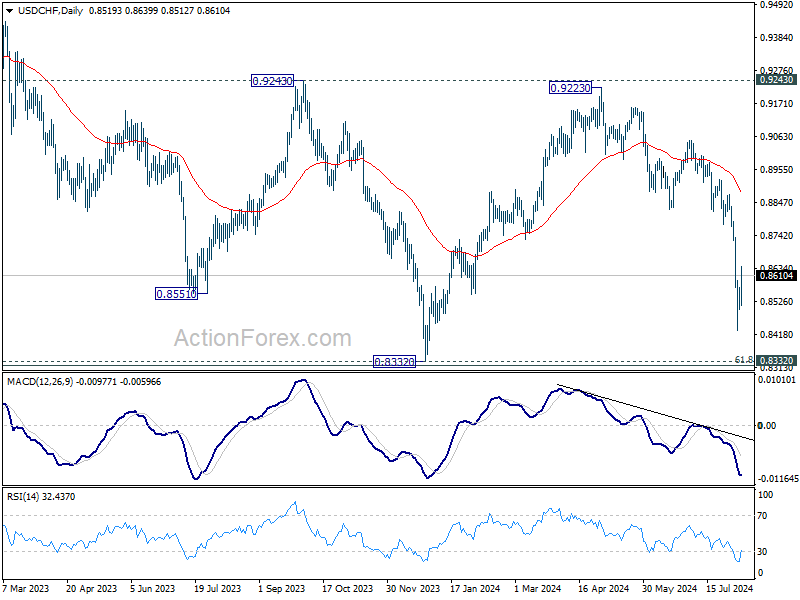
USD/CHF Mid-Day Outlook
Daily Pivots: (S1) 0.8485; (P) 0.8529; (R1) 0.8556; More…
USD/CHF's recovery from 0.8431 extends higher today but upside is still limited well below 0.8711 resistance. Intraday bias remains neutral and further decline remains in favor. On the downside, below 0.8500 will bring retest of 0.8431 first. Break there will resume the decline from 0.9223 to retest 0.8332 low.
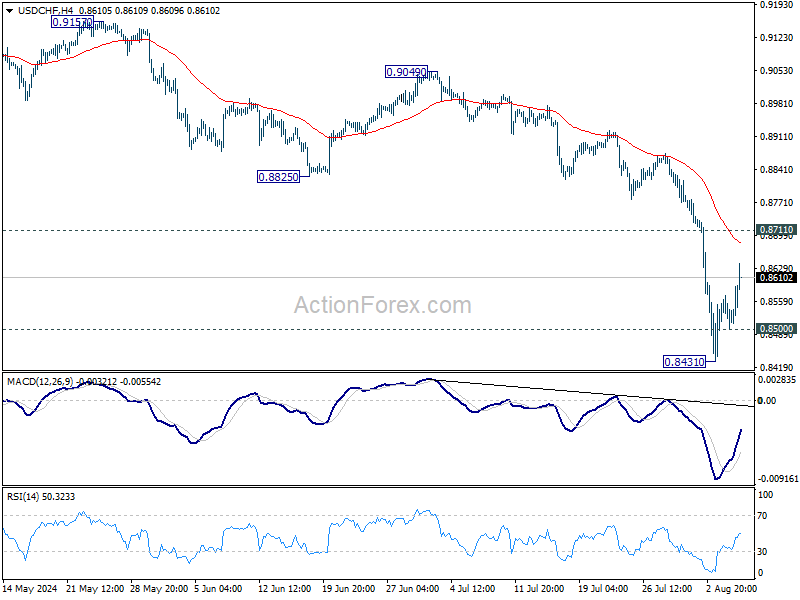
In the bigger picture, price actions from 0.8332 (2023 low) are currently seen as a medium term corrective pattern, with fall from 0.9223 as the second leg. Strong support could be seen from 0.8332 to bring rebound. Yet, overall outlook will continue to stay bearish as long as 0.9243 resistance holds. Firm break of 0.8332, however, will resume larger down trend from 1.0146 (2022 high).
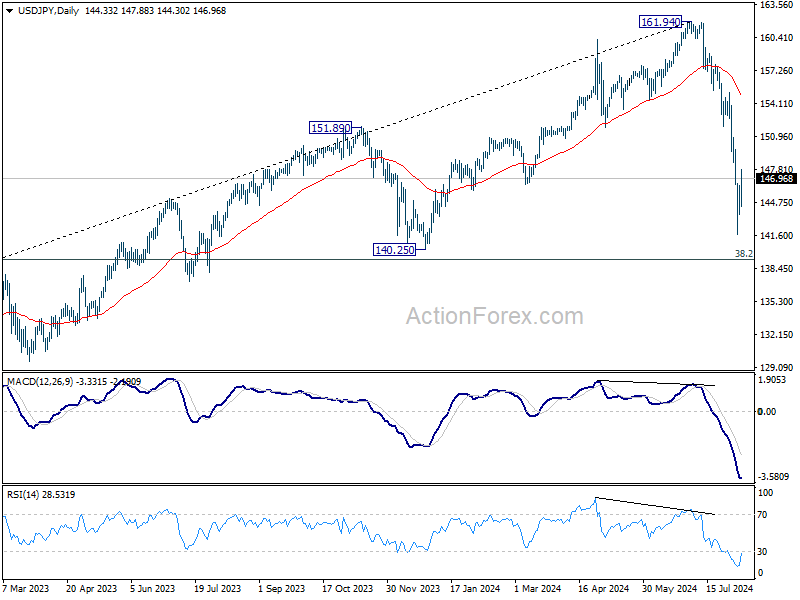
USD/JPY Mid-Day Outlook
Daily Pivots: (S1) 143.21; (P) 144.79; (R1) 145.95; More...
USD/JPY is staying below 150.88 resistance despite current rebound. Intraday bias remains neutral and further decline is expected. On the downside, below 144.04 minor support will bring retest of 141.67 first. Break there will resume the fall from 161.94 to 140.25 support next.
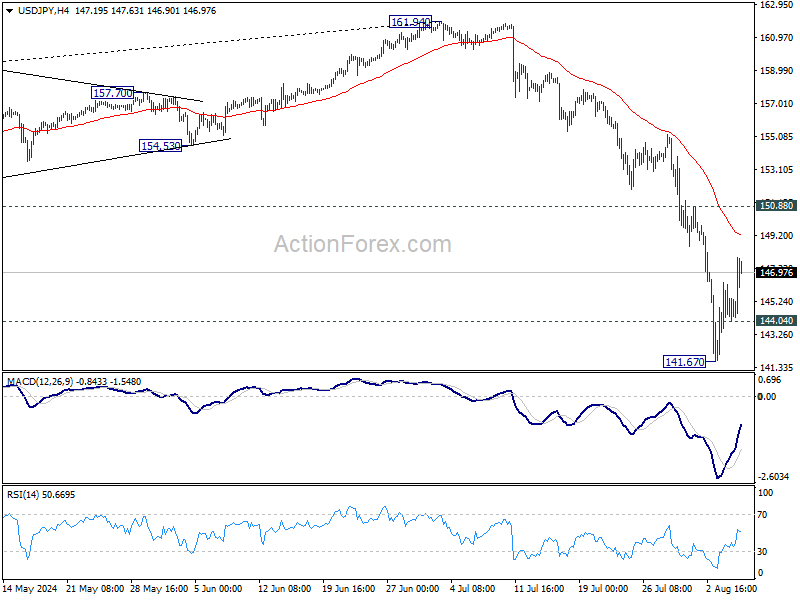
In the bigger picture, the strong break of 55 W EMA (now at 149.98) argue that fall from 161.94 medium term is correcting whole up trend from 102.58 (2021 low). Deeper decline could be seen to 38.2% retracement of 102.58 to 161.94 at 139.26, which is close to 140.25 support. In any case, risk will stay on the downside as long as 55 W EMA (now at 149.83) holds. Nevertheless, firm break of 55 W EMA will suggest that the range for medium term corrective pattern is already set.
BoC Deliberations Awaited as Kiwi Gains, Yen Falls
News flow has been slow today, with only second-tier economic data coming out of Europe and no major releases from the US. Some attention is turning towards Canada, where BoC is set to release its summary of deliberations from the July 24 meeting, which resulted in the second rate cut in a row. Despite Governor Tiff Macklem's insistence that BoC sets monetary policy independently of Fed, weak US jobs data have led some economists to speculate that both Fed and BoC might accelerate their monetary easing. In light of recent market turbulence, the insights from the BoC governing council are increasingly significant.
Overall, New Zealand Dollar is the standout performer today, bolstered by robust employment data that effectively rules out a premature rate cut by RBNZ next week. Australian Dollar and Canadian Dollar are also performing well, buoyed by recovering global risk sentiment. Conversely, Japanese Yen is the weakest performer, impacted by improved risk sentiment and remarks from a senior BoJ official dismissing the likelihood of another near-term rate hike. Swiss Franc and Euro are also underperforming, while Dollar and British Pound are positioned in the middle.
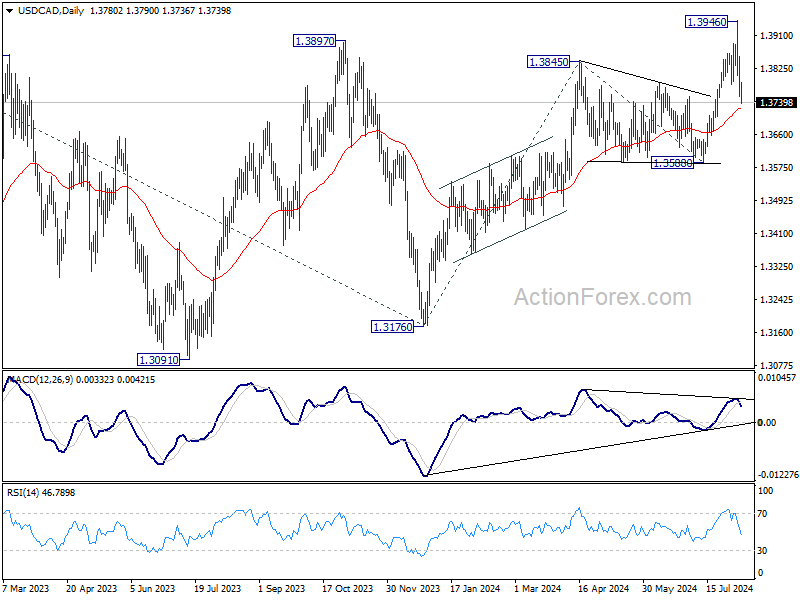
Technically, USD/CAD's short term top is extending lower today with focus now on 55 D EMA (now at 1.3724). Strong rebound from the EMA will keep near term bullishness intact. Rise from 1.3176 would still be in favor to resume through 1.3946 at a later stage. However, sustained break of the EMA will raise the chance of reversal, and bring deeper fall to 1.3588 support for confirmation.
In Europe, at the time of writing, FTSE is up 1.10%. DAX is up 1.10%. CAC is up 1.40%. UK 10-year yield is up 0.0470 at 3.971. Germany 10-year yield is up 0.0799 at 2.281. Earlier in Asia, Nikkei rose 1.19%. Hong Kong HSI rose 1.38%. China Shanghai SSE rose 0.09%. Singapore Strait Times rose 1.60%. Japan 10-year JGB yield fell -0.0136 to 0.880.
BoJ's Uchida: To keep interest rate for the time being due to extreme global market volatility
In a speech today, BoJ Deputy Governor Shinichi Uchida emphasized the necessity of maintaining monetary easing with the current policy interest rate "for the time being", citing "extremely volatile" recent developments in both Japanese and global financial and capital markets. Uchida assured that BoJ is monitoring these developments with "utmost vigilance" and will adjust monetary policy as appropriate.
Uchida reiterated that if the outlook for economic activity and prices is realized, BoJ would "continue to raise the policy interest rate." Howeer, he noted that "significant movements in stock prices and foreign exchange rates since last week" are particularly relevant in shaping this outlook.
Furthermore, Uchida pointed out that the recent correction in Yen's depreciation has reduced the "upside risk to prices arising from higher import prices." This adjustment in Yen's value "affects the conduct of monetary policy."
New Zealand employment grows 0.4% in Q2, above expectations
New Zealand's employment data for Q2 showed unexpected strength, with employment growing by 0.4%, defying expectations of a -0.3% contraction. However, the unemployment rate increased from 4.4% to 4.6%, which was still better than the anticipated 4.7%. The labor force participation rate also saw a modest rise of 0.2% to 71.7%, while the employment rate remained steady at 68.4%.
All sector wage inflation was recorded at 1.2% qoq and 4.3% yoy. Private sector wage inflation stood at 0.9% qoq and 3.6% yoy. The public sector saw higher wage inflation at 1.8% qoq and 6.9% yoy, with the annual rate hitting a series high.
China's exports grow 7.0% yoy in Jul, imports rises 7.2% yoy
China's export growth for July came in at 7.0% yoy, falling short of the expected 9.7% yoy increase. Exports to the US and EU each grew by about 8% yoy, while exports to ASEAN countries surged by 12% yoy.
Imports, on the other hand, rose by 7.2% yoy, exceeding the expected 3.5% growth. Notably, imports from the US surged by 24% yoy, imports from ASEAN countries increased by 11% yoy, and imports from the EU climbed by 7% yoy.
As a result, China's trade surplus narrowed from USD 99.1B to USD 84.6B, which was smaller than the expected USD 99.2B.
USD/JPY Mid-Day Outlook
Daily Pivots: (S1) 143.21; (P) 144.79; (R1) 145.95; More...
USD/JPY is staying below 150.88 resistance despite current rebound. Intraday bias remains neutral and further decline is expected. On the downside, below 144.04 minor support will bring retest of 141.67 first. Break there will resume the fall from 161.94 to 140.25 support next.
In the bigger picture, the strong break of 55 W EMA (now at 149.98) argue that fall from 161.94 medium term is correcting whole up trend from 102.58 (2021 low). Deeper decline could be seen to 38.2% retracement of 102.58 to 161.94 at 139.26, which is close to 140.25 support. In any case, risk will stay on the downside as long as 55 W EMA (now at 149.83) holds. Nevertheless, firm break of 55 W EMA will suggest that the range for medium term corrective pattern is already set.
Economic Indicators Update
| GMT | Ccy | Events | Actual | Forecast | Previous | Revised |
|---|---|---|---|---|---|---|
| 22:45 | NZD | Employment Change Q2 | 0.40% | -0.30% | -0.20% | -0.30% |
| 22:45 | NZD | Unemployment Rate Q2 | 4.60% | 4.70% | 4.30% | 4.40% |
| 22:45 | NZD | Labour Cost Index Q/Q Q2 | 0.90% | 0.80% | 0.80% | |
| 03:00 | CNY | Trade Balance (USD) Jul | 84.7B | 99.2B | 99.1B | |
| 05:00 | JPY | Leading Economic Index Jun P | 108.6 | 109.3 | 111.2 | |
| 06:00 | EUR | Germany Industrial Production M/M Jun | 1.40% | 1.00% | -2.50% | |
| 06:00 | EUR | Germany Trade Balance Jun | 20.4B | 21.5B | 24.9B | |
| 06:45 | EUR | France Trade Balance (EUR) Jun | -6.1B | -7.5B | -8.0B | -7.7B |
| 07:00 | CHF | Foreign Currency Reserves (CHF) Jul | 704B | 711B | ||
| 14:00 | CAD | Ivey PMI Jul | 62 | 62.5 | ||
| 14:30 | USD | Crude Oil Inventories | -1.6M | -3.4M | ||
| 17:30 | CAD | BoC Summary of Deliberations |
NZDUSD Jumps Aggressively Higher
- NZDUSD records a sizeable green candle today
- Strong reaction following the recent acute correction
- Momentum indicators are mixed, bearish pressure weakening
NZDUSD is edging aggressively higher today, cancelling out a good part of the recent correction that led to a new 9-month low. The overall positive market sentiment and the stronger labour market data from New Zealand during the Asian session have helped NZDUSD climb higher as the RBNZ is preparing for next week’s rate-setting meeting.
In the meantime, the momentum indicators are mixed. More specifically, the Average Directional Movement Index (ADX) is dropping towards its 25-threshold and thus signalling a weakening bearish trend in the NZDUSD. Similarly, the RSI is trying to climb above its 50-midpoint, potentially indicating that the recent bearish pressure has probably faded away. More importantly, the stochastic oscillator is edging higher, well above its oversold territory (OS), and heading towards its midpoint.
If the bulls remain confident, they could try to lead NZDUSD towards the 0.6037-0.6092 range, which is defined by the 38.2% Fibonacci retracement, the July 14, 2022 low, and the 50-, 100- and 200-day simple moving average (SMAs). If they manage to overcome this key resistance area, the path is clear until the October 1, 2019 low at 0.6198.
On the flip side, the bears are trying to retake the market reins and push NZDUSD towards the May 15, 2022 low at 0.5920. If successful, they could then retest the support set by the 50% Fibonacci retracement of the April 5, 2022 – October 13, 2022 downtrend at 0.5870 and be given the chance to record a 2024 low.
To sum up, NZDUSD bulls are staging a comeback, but market sentiment remains fragile and thus the recent bearish move might still have legs.

NZ Dollar Surges on Strong Employment Data
The New Zealand dollar has soared today. In the European session, NZD/USD is trading at 0.6018, up an impressive 1.1% at the time of writing.
New Zealand job growth surprises on the upside
New Zealand’s labour market has been cooling off due to elevated interest rates and the markets were braced for a soft jobs report for the second quarter. Instead, job growth rebounded and unemployment was lower than expected, sending the New Zealand dollar sharply higher.
Job growth expanded by 0.4% in the second quarter, up from -0.2% in Q1 and above the market estimate of -0.2%. The unemployment rate rose from 4.4% to 4.6%, a notch under the market estimate of 4.7%. This is the highest level since Q1 of 2021 but investors were pleased that it was lower than expected.
The positive employment report has reduced market expectations of a rate cut from the Reserve Bank of New Zealand, which has driven the New Zealand dollar sharply higher today. Inflation has fallen to 3.3%, its lowest level in three years and close to the upper level of the central bank’s target range between 1% and 3%. A weak employment report could have cemented a rate cut at next week’s meeting but the job data was better than expected, which will complicate the rate decision.
The final tier-1 release before the August 14 meeting is Inflation Expectations on Thursday. This indicator is closely followed by the central bank and will be a factor in the rate decision. Inflation Expectations has been on a steady downtrend and is expected to ease to 2.33% in the second quarter, compared to 2.5% in the first quarter.
.
NZD/USD Technical
- NZD/USD is testing resistance at 0.6009. Above, there is resistance at 0.6061
- There is support at 0.5934 and 0.5882