Sample Category Title
EUR/USD Stabilises Amid Fed Speculation and Absence of Major Economic Data
The EUR/USD pair has found some stability at around 1.0921 this Friday, following a week marked by high volatility. Market participants have been adjusting their positions in response to speculations concerning the US economy's potential rapid recession and subsequent expectations about the Federal Reserve's response.
The broader market sentiment has increasingly leaned towards anticipating a significant rate cut by the Fed in September, possibly by 50 basis points. However, the validity of these expectations remains to be seen as the situation evolves.
Austan Goolsbee, President of the Federal Reserve Bank of Chicago, recently emphasised that the Federal Reserve's mandate is not to respond to stock market fluctuations but to focus on its dual objectives of maximising employment and achieving price stability. He also reiterated that the Fed has set specific economic criteria to justify a rate reduction. Goolsbee's remarks seem to have calmed some of the more erratic market movements.
With no significant economic data released this week, traders have been left to navigate the market based on speculative movements and minor indicators.
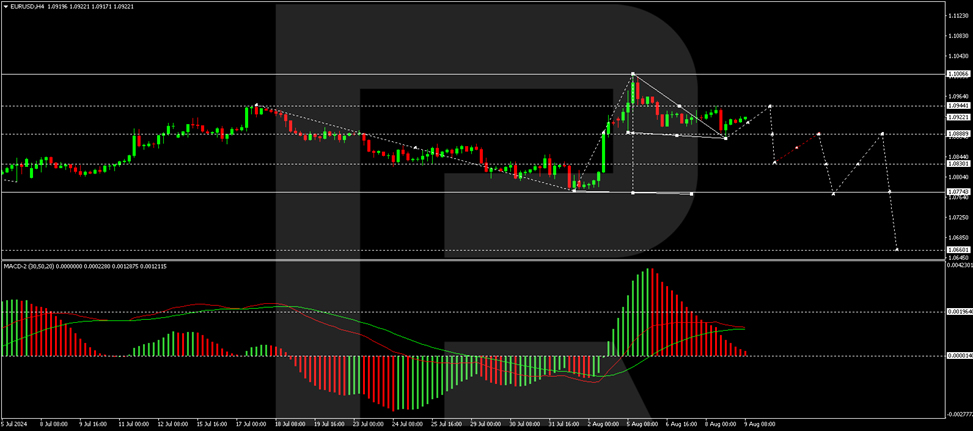
Technical analysis of EUR/USD
The H4 chart shows that EUR/USD has completed an initial downward movement targeting the 1.0880 level, followed by a corrective phase towards 1.0944. Should this correction complete, a further decline to 1.0888 is anticipated. Breaking below this level could extend the downward trajectory towards 1.0830. The bearish outlook is supported by the MACD indicator, whose signal line is positioned above zero but trending downwards, indicating a potential continuation of the decline.
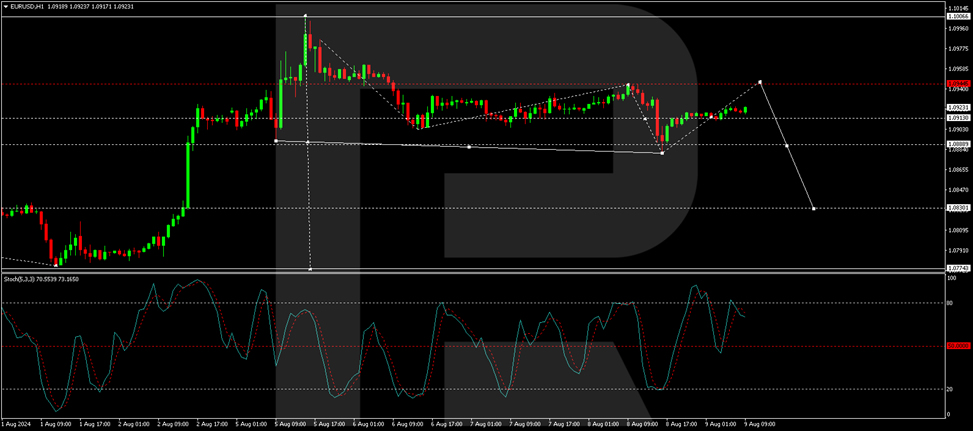
On the H1 chart, EUR/USD has formed a consolidation pattern around the 1.0913 mark. An upward breakout is expected, potentially driving the pair towards 1.0944, which is seen as a corrective move against the previous downtrend. Upon completion of this correction, the focus will shift to a new declining phase targeting 1.0888. This technical perspective is corroborated by the Stochastic oscillator, with its signal line poised to move from below the 80 level to around 20, suggesting an impending downward momentum.
Overall, the EUR/USD pair shows signs of temporary equilibrium as it navigates through speculative currents and awaits clearer directional cues from upcoming economic data or Federal Reserve communications.
A Crypto Test for Risk Appetite
Market Picture
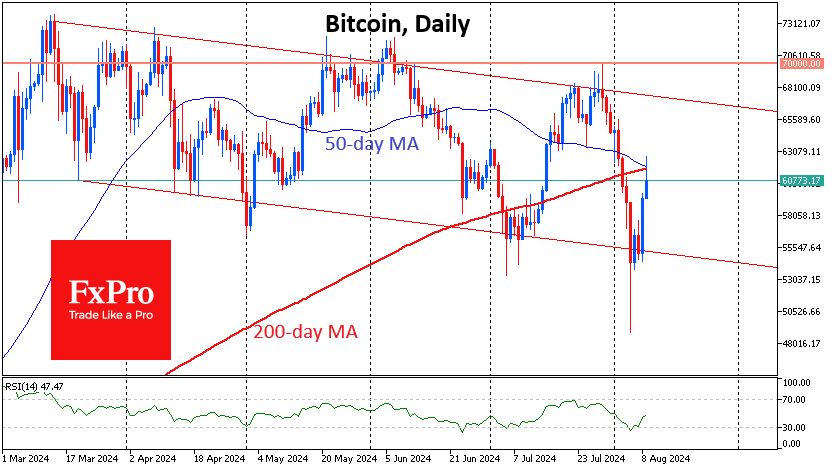
Risk appetite played out in the markets on Thursday, adding over 6.4% to the crypto market’s capitalisation in the last 24 hours. The capitalisation peaked at $2.18 trillion in the morning, the highest since last Friday.
In just over 24 hours, the price of bitcoin rose 14% to $62.6K, before falling back to $60K by the start of active trading in Europe. The former cryptocurrency failed to break above the intersection of the 50- and 200-day moving averages. The ability to close above this at $61.8K could encourage buyers to quickly rally to $67K. A retreat from this level would set up a scenario of a return to the area of the sustained July and August lows near $55.5K.
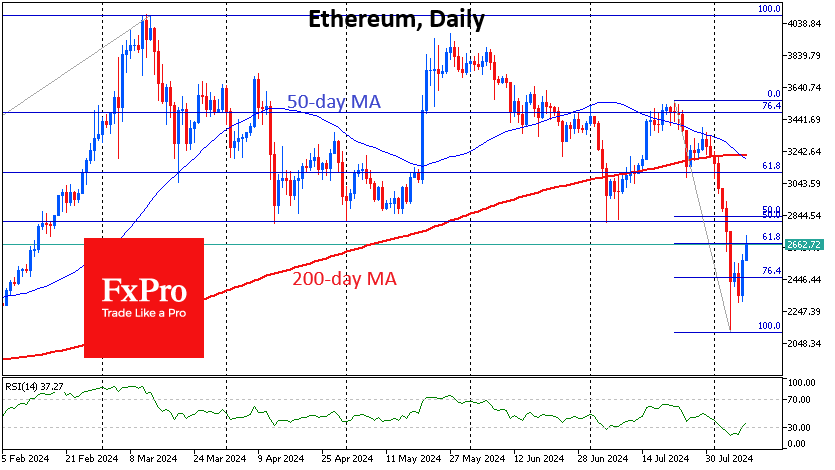
Ethereum is trading at $2660, having rallied to a classic 61.8% Fibonacci retracement of the down amplitude from 22 July to 5 August. A death cross has formed on the daily chart, increasing the chances of a downward move under technical pressure. On the other hand, Ethereum is still oversold locally, and financial markets are rallying, attracting bargain hunters to the crypto.
News background
According to Santiment, bitcoin whales actively accumulated coins during the crypto market crash on 5-6 August. The number of transactions reached its highest level since April. According to CryptoQuant’s calculations, the balance of miners’ wallets was increased by 404,448 BTC ($23 billion) over the past 30 days.
Institutional investors have virtually not reduced their positions in the first cryptocurrency amid the turbulence, which has contributed to the rebound in prices, JPMorgan noted.
Major liquidations from the Mt. Gox and Genesis bankruptcies are behind us, and upcoming fiat payments to FTX creditors later this year could boost demand. Major US political parties are also signalling support for favourable cryptocurrency regulation.
The New York Stock Exchange (NYSE) has filed with the SEC to list and trade spot Ethereum ETFs from Bitwise and Grayscale.
Brazil’s Securities and Exchange Commission has approved the launch of the country’s first Solana-based exchange-traded fund (ETF) (SOL). However, Brazil’s B3 stock exchange still needs to approve the new investment product for trading.
Canadian Dollar Rallies, Jobs Report Looms
The Canadian dollar has shined this week, posting gains over the past four days and rising 1%. Will the impressive rally continue? In the North American session, USD/CAD is trading at 1.3732, unchanged on the day.
Canadian job growth expected to rebound
Canada wraps up the week with the July employment report. The June report was soft, with job growth coming in at -1.4 thousand, a rare decline. The markets are expecting strong turnaround today, with an estimate of 26.9 thousand. The flip side is that the unemployment rate is expected to nudge up to 6.5%, compared to 6.4% in June. If the employment report is a mix as expected, it will be interesting to see how investors respond.
The Bank of Canada will be watching closely as it looks to the next meeting on September 4. The BoC has led the recent global trend of lowering rates, having trimmed rates by a quarter-point at each of the past two meetings. If the labour market shows further signs of cooling, it will support the case to lower rates again, perhaps as early as September. The Federal Reserve is virtually guaranteed to cut rates when its meets on September 18 and this will make it easier for the BoC to cut without putting downward pressure on the Canadian dollar.
In the US, weaker economic data and the meltdown in the global stock markets has raised expectations of a half-point cut from the Fed in September. The probability of that scenario, only 3% a month ago, has soared to 54.5%, according to the CME’s FedWatch. The market slide led to calls for an emergency rate cut, but the US stock market has rebounded this week. Still, there is an uneasy calm as fears persist that the US economy is showing signs of deteriorating quickly and the sell-off could reignite if the US posts weak data.
USD/CAD Technical
- 1.3746 is a weak resistance line, followed by 1.3809.
- There is support at 1.3704 and 1.3679
USDCAD Bears Take a Break But Are Not Done Yet
- USDCAD experiences worst week of the year
- Selling pressure might persist; eyes on 1.3730
- Canadian employment figures due at 12:30 GMT
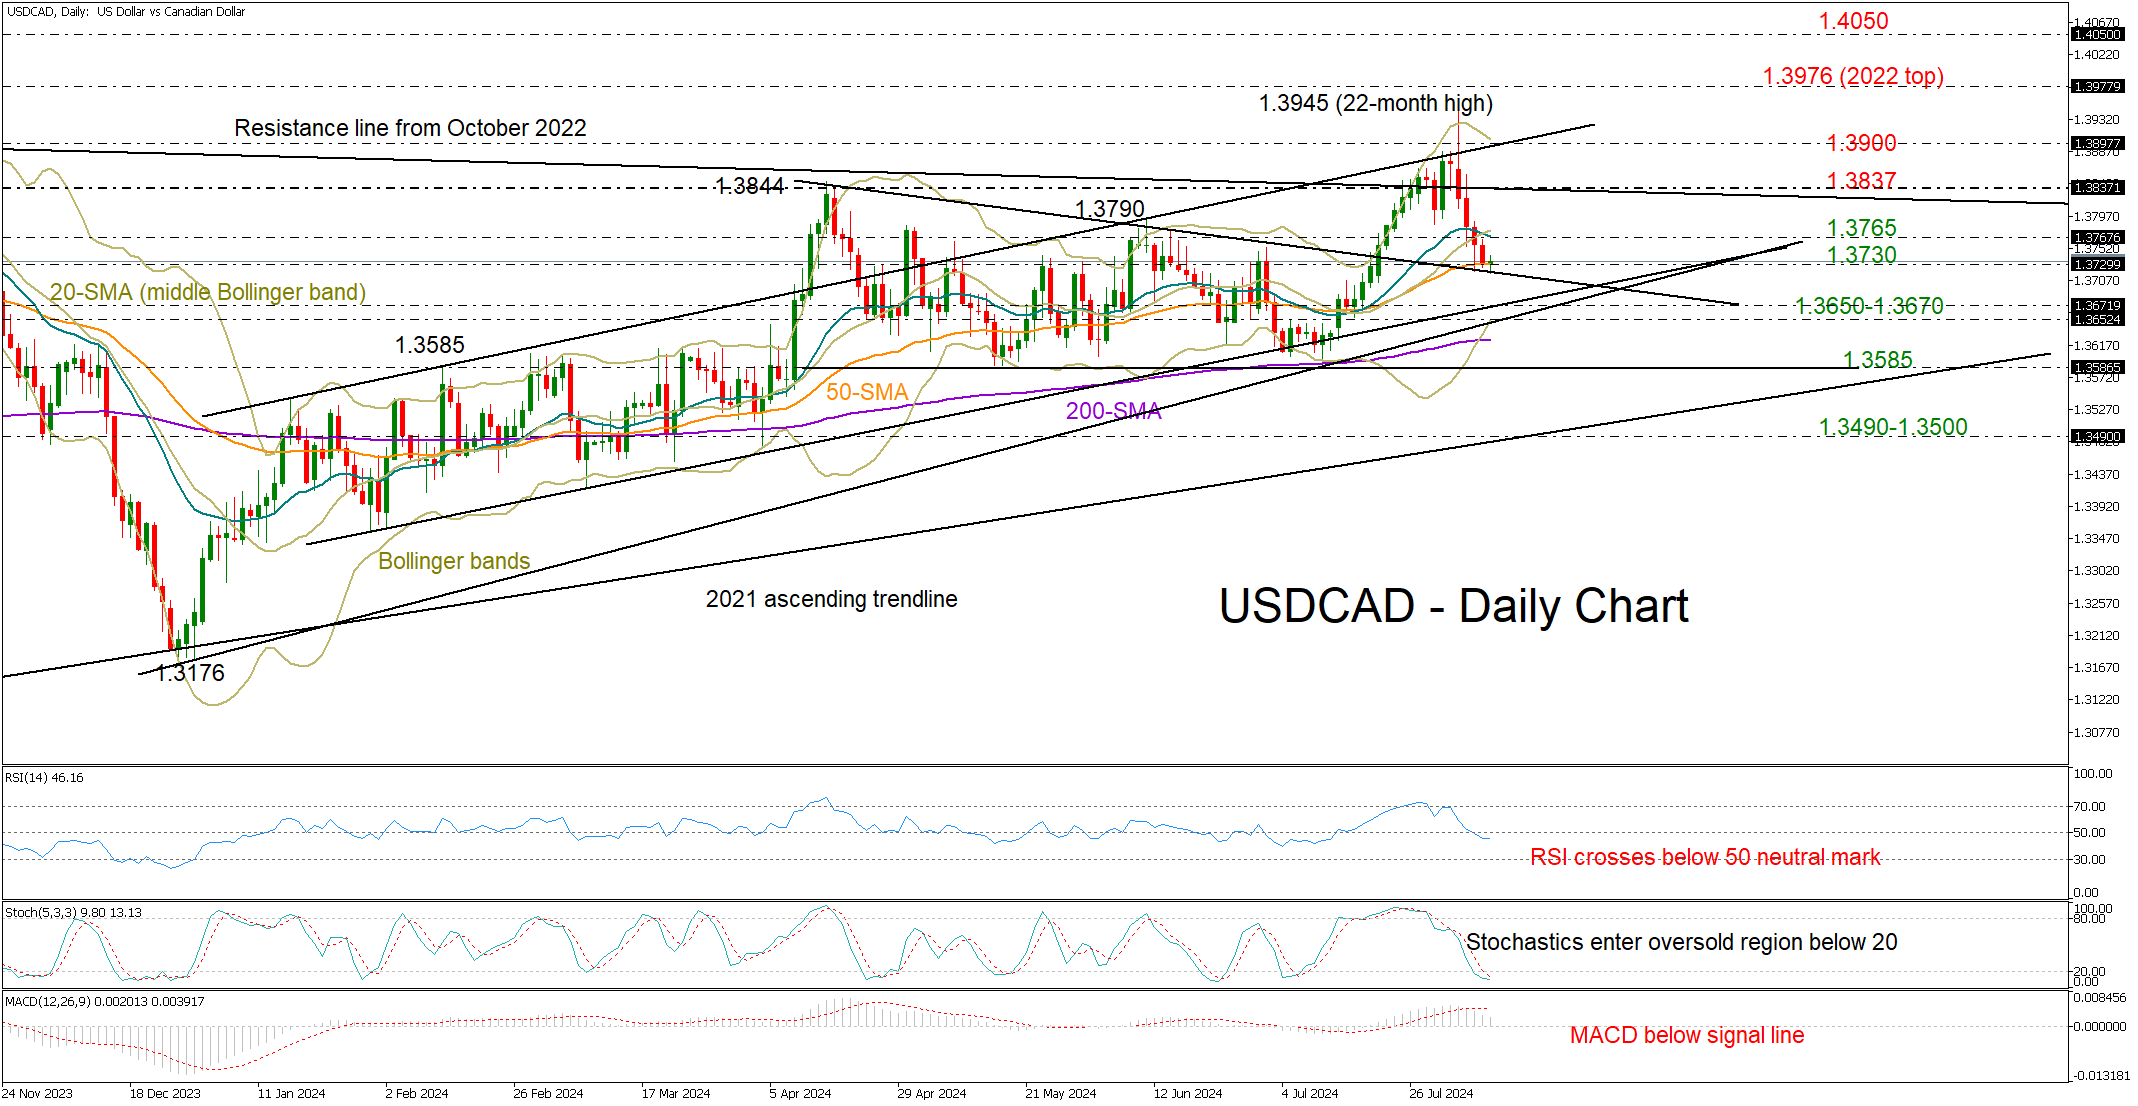
Since reaching a 22-month high of 1.3945, USDCAD has been steadily dropping towards its 50-day SMA at 1.3730, making it the worst-performing week of the year.
The broken resistance trendline drawn from April's peak is now providing support in the market, although there is no certainty of a bullish rotation according to the technical indicators.
Even though the Stochastic oscillator has entered its oversold territory, the negative cycles in the RSI and the MACD seem to be at an early stage, warning that the bearish wave in the price has yet to bottom out. Note that the price is trading comfortably above the lower Bollinger band, endorsing the bearish scenario too.
The next pivot point could develop between the ascending trendlines coming from December 2023 and January 2024 at 1.3670 and 1.3650 respectively. If selling forces breach that floor, the pair could tumble towards the critical 1.3585 base, a break of which would violate the horizontal move from April, likely prompting a fast decline towards the 2021 ascending trendline at 1.3500.
If the pair attracts new buyers around 1.3730, it may encounter resistance near the 20-day SMA at 1.3765. A step higher could face resistance around the constraining line from October 2022 at 1.3837, while higher, the bulls might push towards the 1.3900 barrier.
Summing up, USDCAD could remain under pressure as the bears seem to have the upper hand in the market. A close below 1.3730 might trigger the next downfall.
GBPJPY Climb Continues
- GBPJPY is edging higher today, recording another green session
- It remains around 10% below its recent peak
- Momentum indicators acknowledge this bullish reaction
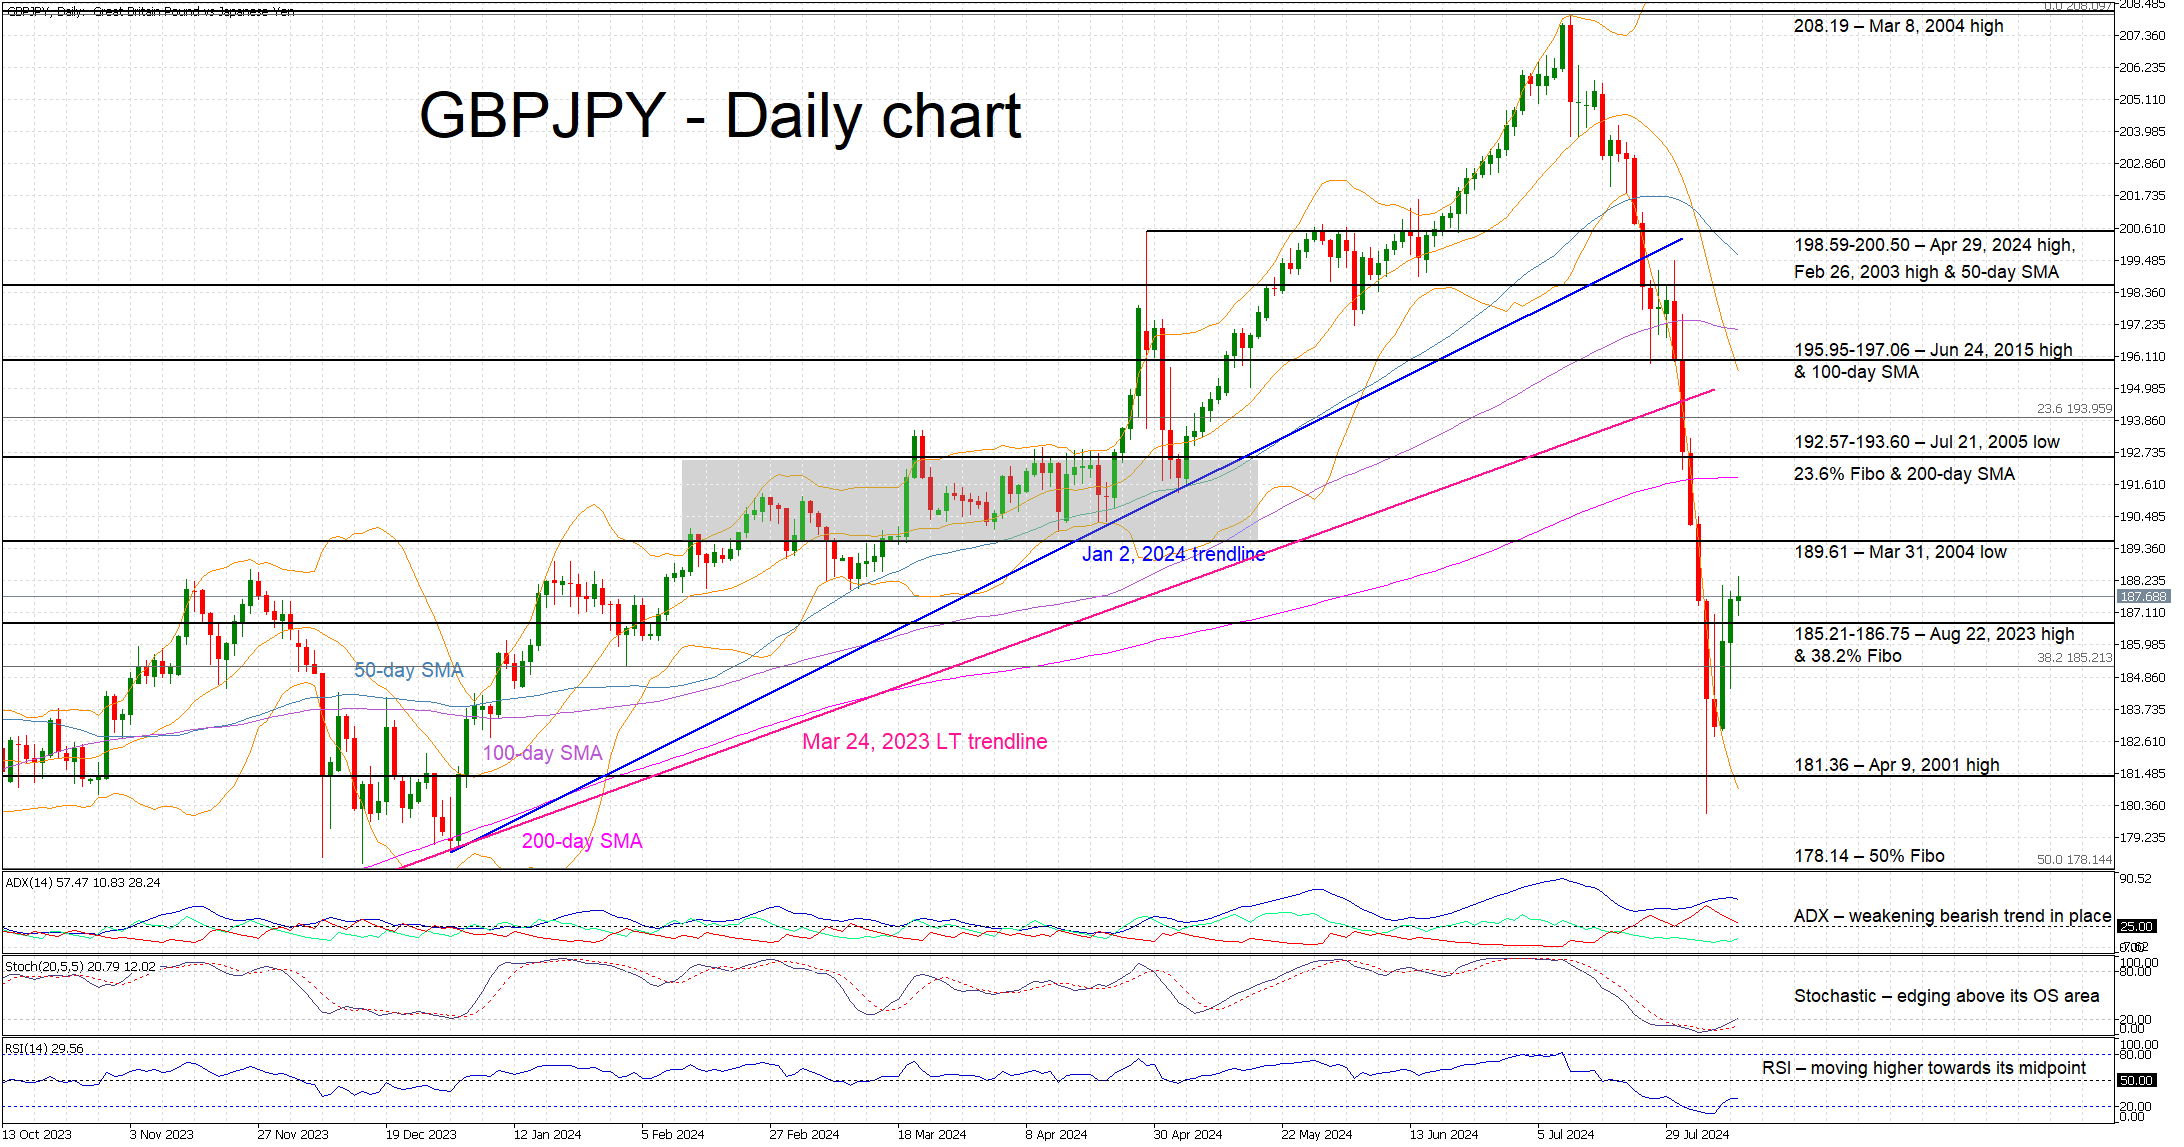
GBPJPY is edging higher again today, recording its third consecutive green candle and recovering by around 4% above its August 5 low. The market has settled down a bit following the recent rout, with GBP recovering a tad after the recent BoE rate cut. Low liquidity is probably amplifying the latest moves with the market gradually turning its focus to next week’s key UK CPI report.
In the meantime, momentum indicators are acknowledging this bullish reaction. More specifically, the Average Directional Movement Index (ADX) is trading sideways and thus signaling a weakening bearish trend in GBPJPY. Similarly, the RSI is edging higher, towards its midpoint. More importantly, the stochastic oscillator is moving higher, breaking above both its moving average and oversold territory (OS), and thus supporting the current muted bullish move in GBPJPY.
If the bulls remain confident, they could try to push GBPJPY above the March 31, 2004 low at 189.61 and then gradually retest the busy 192.57-193.60 area. This region is populated by the July 21, 2005 low, the 100-day simple moving average (SMA) and the 23.6% Fibonacci retracement level of the July 20, 2021 – July 11, 2024 uptrend.
On the other hand, the bears are probably trying to regain market control. They could attempt to push GBPJPY back below the 185.21-186.75 area that is defined by the August 22, 2023 high and the 38.2% Fibonacci retracement. If successful, they could then stage a move towards the April 9, 2001 high at 181.36, with the chance to record a new 8-month low.
To sum up, GBPJPY continues to climb higher, but market momentum remains fragile, thus keeping the door to another correction.
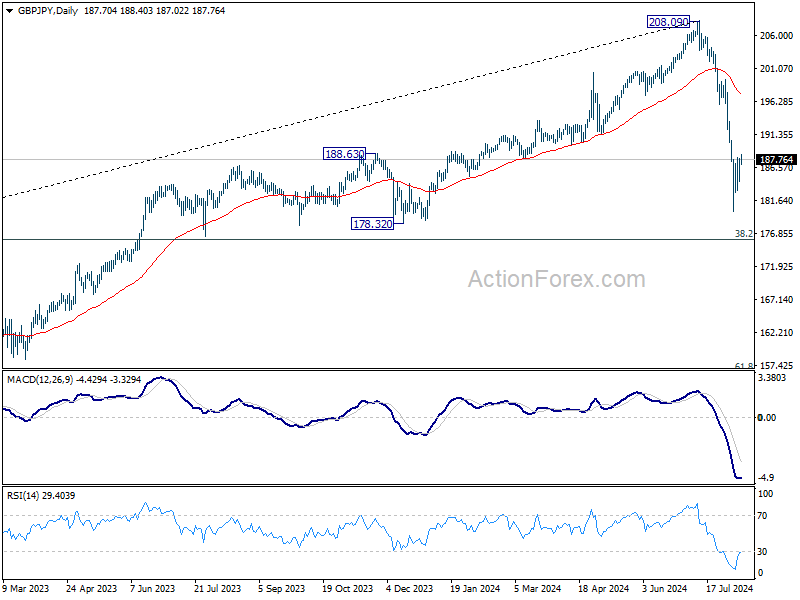
GBP/JPY Daily Outlook
Daily Pivots: (S1) 185.54; (P) 186.71; (R1) 188.93; More...
Intraday bias in GBP/JPY stays neutral and outlook remains bearish as long as 190.48 resistance holds. On the downside, below 183.10 minor support will bring retest of 180.00 first. Break there will resume the fall from 208.09 to 178.32 support next. Nevertheless, firm break of 190.48 will confirm short term bottoming and bring stronger rebound.
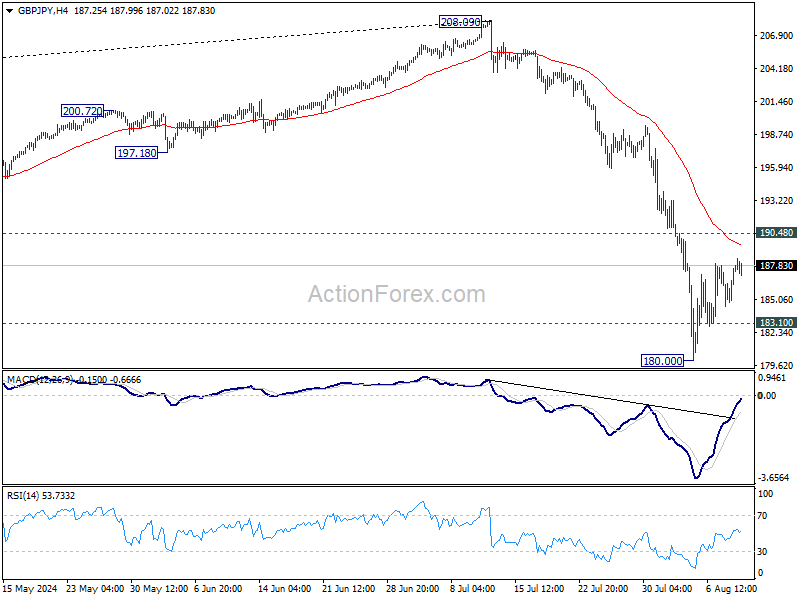
In the bigger picture, fall from 208.09 medium term top is seen as correcting the up trend from 123.94 (2020 low). Deeper decline is in favor as long as 55 W EMA (now at 189.31) holds. But strong support could emerge between 178.32 and 38.2% retracement of 123.94 to 208.09 at 175.94 to bring rebound. Meanwhile, sustained trading above 55 W EMA will suggest that the range for the medium term corrective pattern is already set.
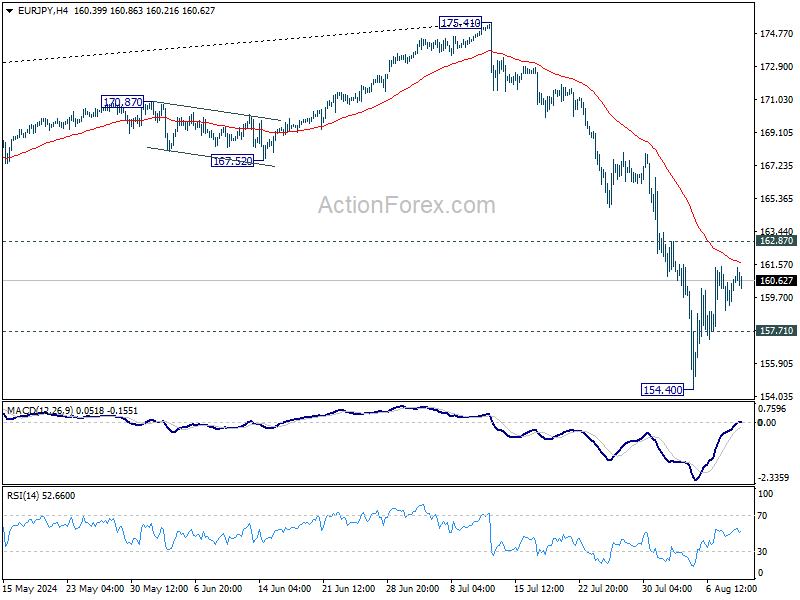
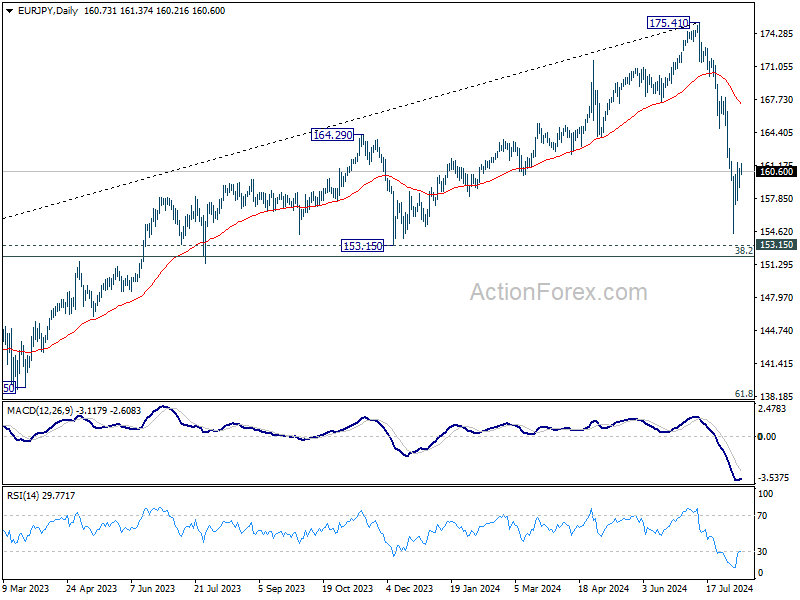
EUR/JPY Daily Outlook
Daily Pivots: (S1) 159.56; (P) 160.23; (R1) 161.48; More...
Intraday bias in EUR/JPY remains neutral for the moment. Outlook stays bearish with 162.87 resistance intact. On the downside, below 157.71 minor support will turn bias back to the downside. Break of 154.40 will resume the fall from 175.41 to 153.15 support next. However, decisive break of 162.87 will confirm short term bottoming, and turn bias back to the upside for stronger rebound.
In the bigger picture, fall from 175.41 medium term top should be correcting the whole rise from 114.42 (2020 low). Deeper fall could be seen as long as 55 W EMA (now at 161.79) holds. But strong support should emerge between 153.15 and 38.2% retracement of 114.42 to 175.41 at 152.11 to bring rebound (at least on first attempt). Meanwhile, sustained trading above 55 W EMA will argue that the range of the medium term corrective pattern has already been set.
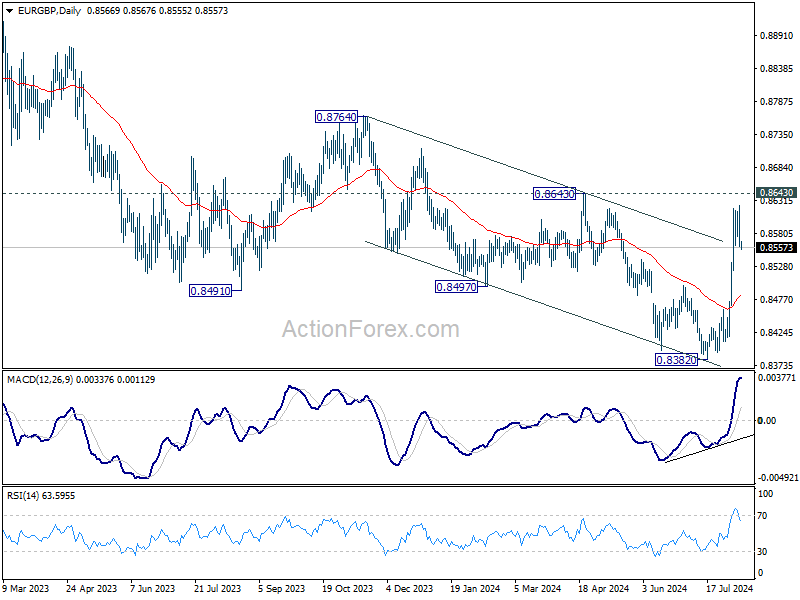
EUR/GBP Daily Outlook
Daily Pivots: (S1) 0.8542; (P) 0.8583; (R1) 0.8607; More....
EUR/GBP's break of 0.8561 support argues that a short term top was formed at 0.8624 already. Intraday bias is back on the downside for deeper pullback to 55 4H EMA (now at 0.8531). On the upside, though, break of 0.8624 will resume the rally from 0.8382 to 0.8643 resistance next.
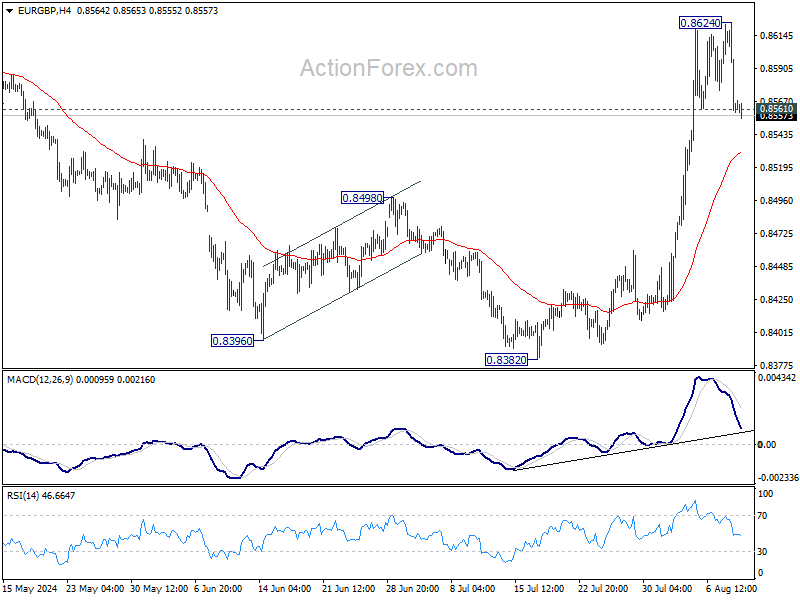
In the bigger picture, while the rebound from 0.8382 is strong, there is no confirmation of trend reversal yet. As long as 0.8643 resistance holds, down trend from 0.9267 could still resume through 0.8382 at a later stage. However, firm break of 0.8643 will indicate that such down trend has completed, and turn outlook bullish.
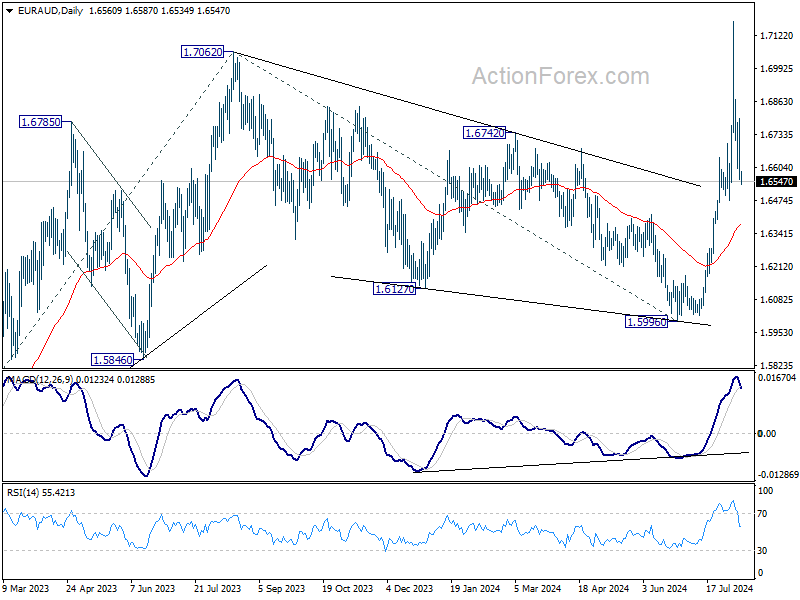
EUR/AUD Daily Outlook
Daily Pivots: (S1) 1.6480; (P) 1.6640; (R1) 1.6723; More...
Intraday bias in EUR/AUD remains neutral at this point. While deeper retreat cannot be ruled out, outlook will remain bullish as long as 1.6474 support holds. On the upside, above 1.6798 minor resistance will turn bias back to the upside for retesting 1.7180. Firm break there will resume larger up trend to 1.7715 fibonacci projection level next.
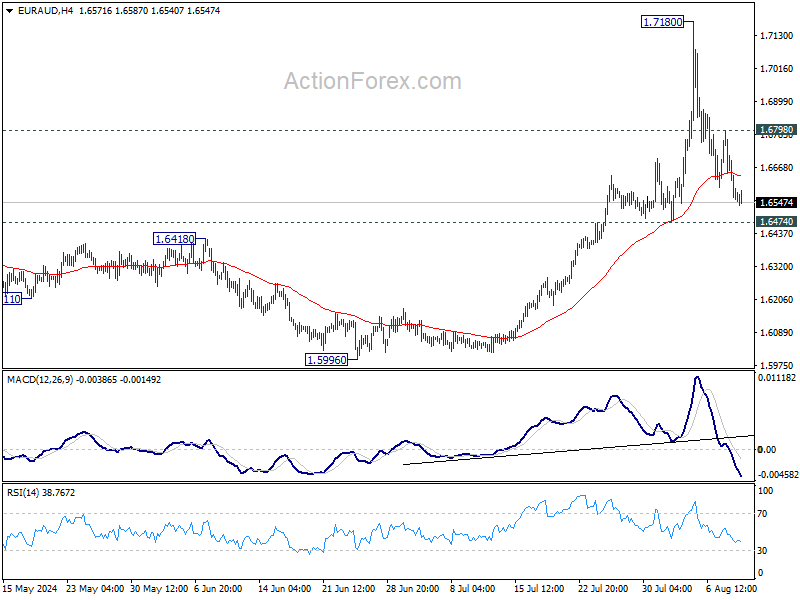
In the bigger picture, decisive break of 1.7062 resistance will confirm resumption of whole up trend from 1. 1.4281 (2022 low). Next target is 61.8% projection of 1.4281 to 1.7062 from 1.5996 at 1.7715. For now, further rally is expected as long as 55 D EMA (now at 1.6355) support holds, even in case of deep retreat.
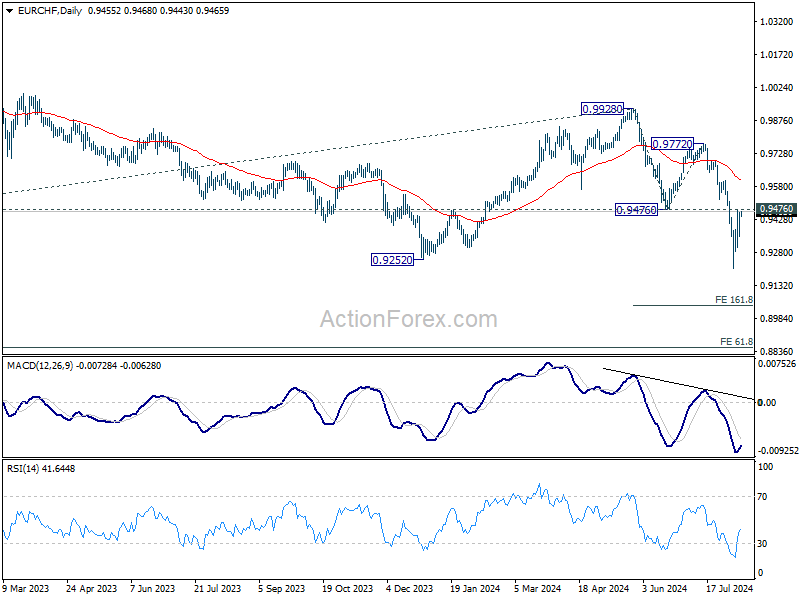
EUR/CHF Daily Outlook
Daily Pivots: (S1) 0.9390; (P) 0.9428; (R1) 0.9500; More....
Intraday bias in EUR/CHF remains neutral and further decline is expected with 0.9476 support turned resistance intact. On the downside, below 0.9354 minor support will bring retest of 0.9209 first. Firm break there will resume larger fall from 0.9928 to 161.8% projection of 0.9928 to 0.94767 from 0.9772 at 0.9041 next. However, sustained break of 0.9476 will turn bias back to the upside for stronger rebound.
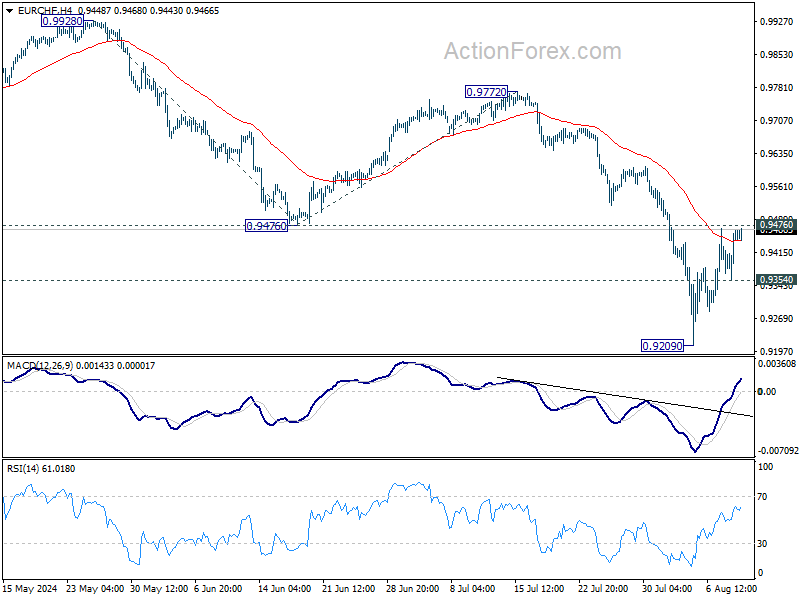
In the bigger picture, current downside acceleration argues that medium term corrective pattern from 0.9407 (2022 low) might have completed with three waves to 0.9928. Decisive break of 0.9252 (2023 low) will confirm long term down trend resumption. Next target will be 61.8% projection of 1.1149 to 0.9407 from 0.9928 at 0.8851. For now, outlook will stay bearish as long as 0.9928 resistance holds, even in case of strong rebound.