

Sample Category Title
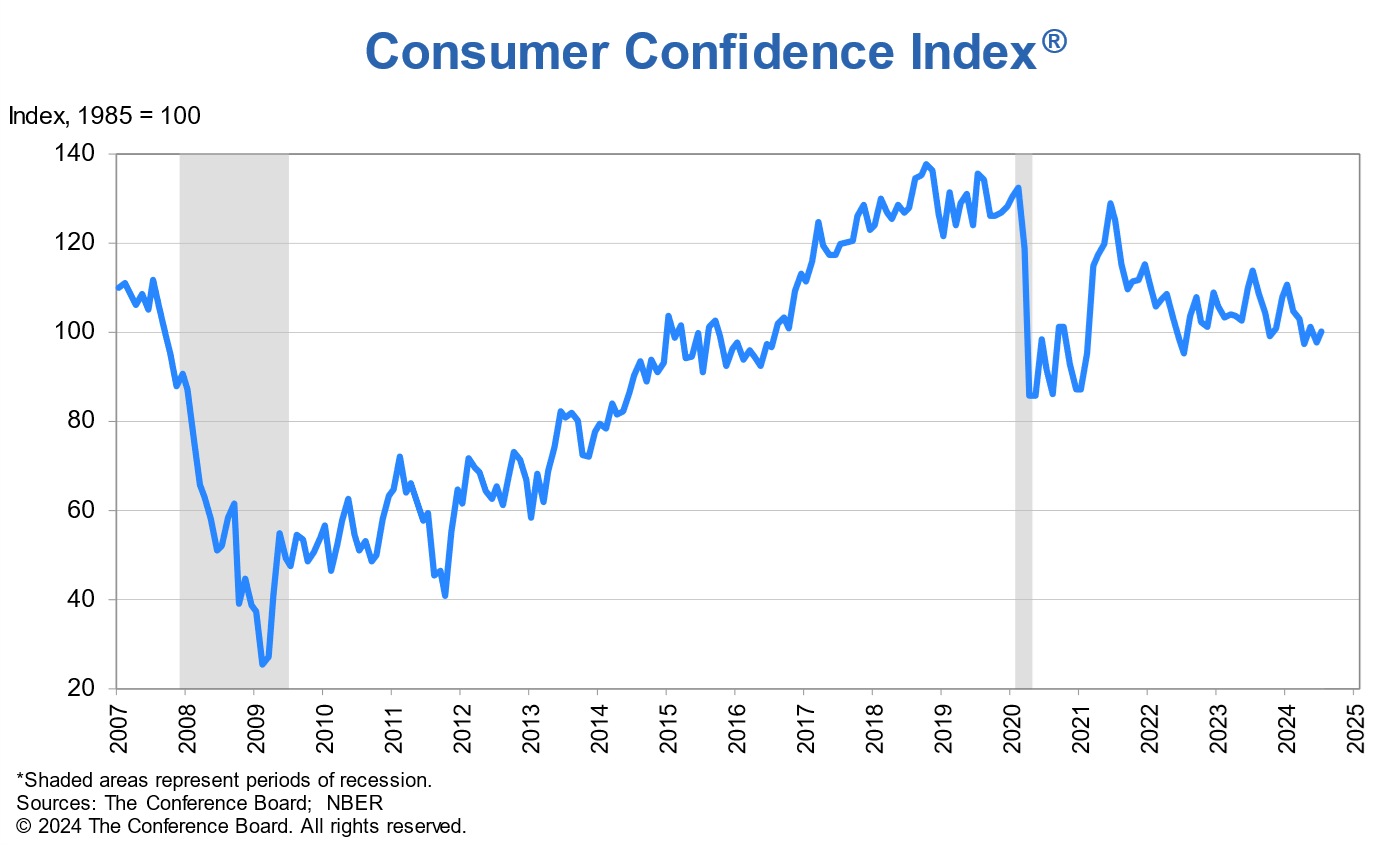
US consumer confidence rises to 100.3, staying in narrow range prevails over two years
US Conference Board Consumer Confidence rose from 97.8 to 100.3 in July, above expectation of 99.8. Present Situation Index fell from 135.3 to 133.6. But Expectations Index rose from 72.8 to 78.2. Nevertheless, Expectations reading below 80 usually signals a recession ahead.
"Confidence increased in July, but not enough to break free of the narrow range that has prevailed over the past two years," said Dana M. Peterson, Chief Economist at The Conference Board.
"Even though consumers remain relatively positive about the labor market, they still appear to be concerned about elevated prices and interest rates, and uncertainty about the future; things that may not improve until next year."
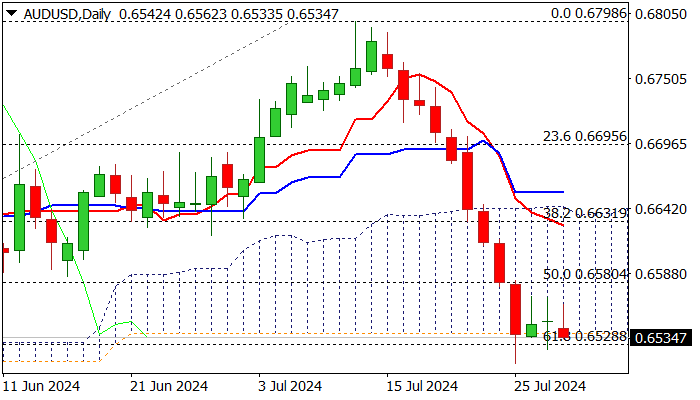
AUD/USD Outlook: Holds in Extended Consolidation Above Strong Supports
AUDUSD remains in extended consolidation around the base of thick daily cloud (0.6538), and above pivotal Fibo support at 0.6528 (61.8% of 0.6362/0.6798), following a steep fall in past nine days.
Bears are taking a breather on stretched daily studies, but remain in play (strong negative momentum, MA’s in full bearish configuration and creating a number of bear crosses) and look for firm break through significant supports at 0.6538/28, which will unmask targets at 0.6500/0.6465 (round-figure/Fibo 76.4%).
Upticks so far remain below upper pivot at 0.6586 (200DMA).
Markets await release of US Consumer confidence and JOLTS data for fresh signals.
Res: 0.6568; 0.6586; 0.6603; 0.6631.
Sup: 0.6528; 0.6500; 0.6465; 0.6407.
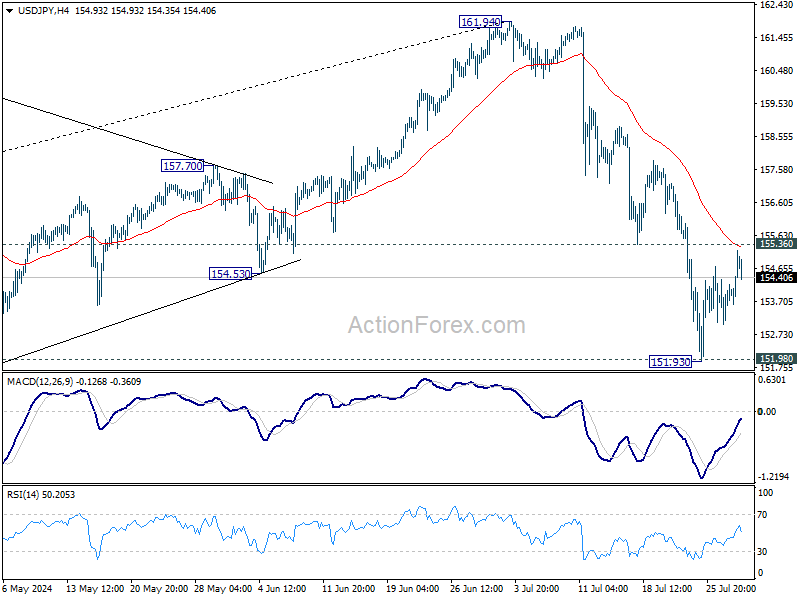
USD/JPY Mid-Day Outlook
Daily Pivots: (S1) 153.25; (P) 153.80; (R1) 154.58; More...
Intraday bias in USD/JPY stays neutral at this point. Further decline is in favor as long as 155.36 support turned resistance holds. On the downside, decisive break of 151.89 resistance turned support will argue that large scale correction is underway to 148.66 fibonacci level. Nevertheless, break of 155.36 will turn bias back to the upside for stronger rebound to 55 D EMA (now at 157.06).
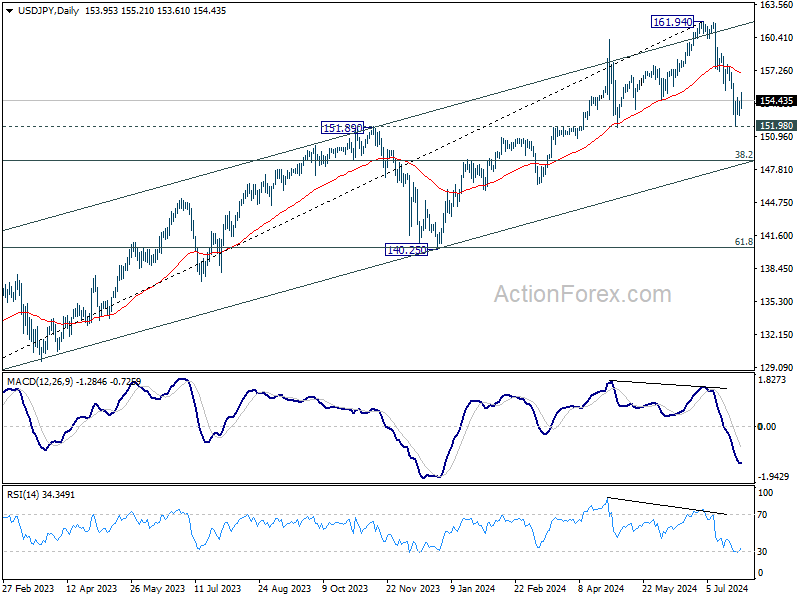
In the bigger picture, considering the depth and momentum of the current decline, 161.94 should be a medium term top already. Fall from there is seen as correcting the whole rise from 127.20 (2023 low) at least. Break of 151.89 will pave the way to 38.2% retracement of 127.20 to 161.94 at 148.66. Risk will now stay on the downside as long as 55 D EMA (now at 157.06) holds, in case of rebound.
USD/CHF Mid-Day Outlook
Daily Pivots: (S1) 0.8831; (P) 0.8851; (R1) 0.8882; More…
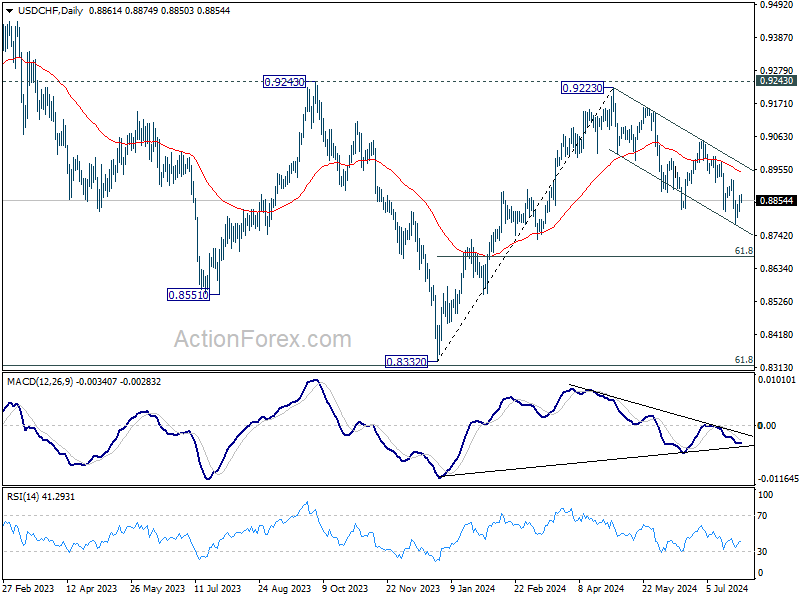
Intraday bias in USD/CHF stays neutral and consolidations from 0.8776 could extend. Further decline is expected as long as 0.8923 resistance holds. On the downside, break of 0.8776 will resume the fall from 0.9223 to 61.8% retracement of 0.8332 to 0.9223 at 0.8672 next. However, break of 0.8923 will turn bias back to the upside for stronger rebound instead.
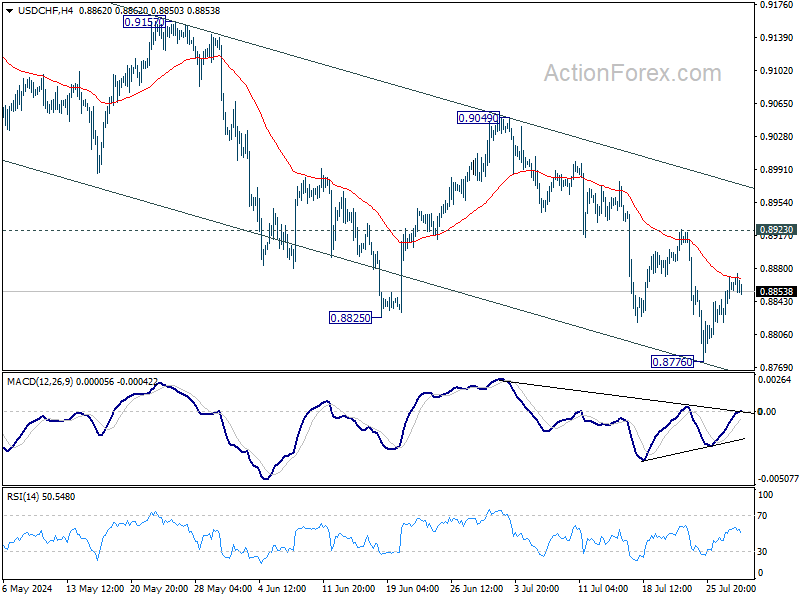
In the bigger picture, with 0.9243 resistance intact, medium term outlook in USD/CHF is neutral at best. For now, more sideway trading is likely between 0.8332/9243. However, firm break of 0.9243 will indicate larger bullish trend reversal.
EUR/USD Mid-Day Outlook
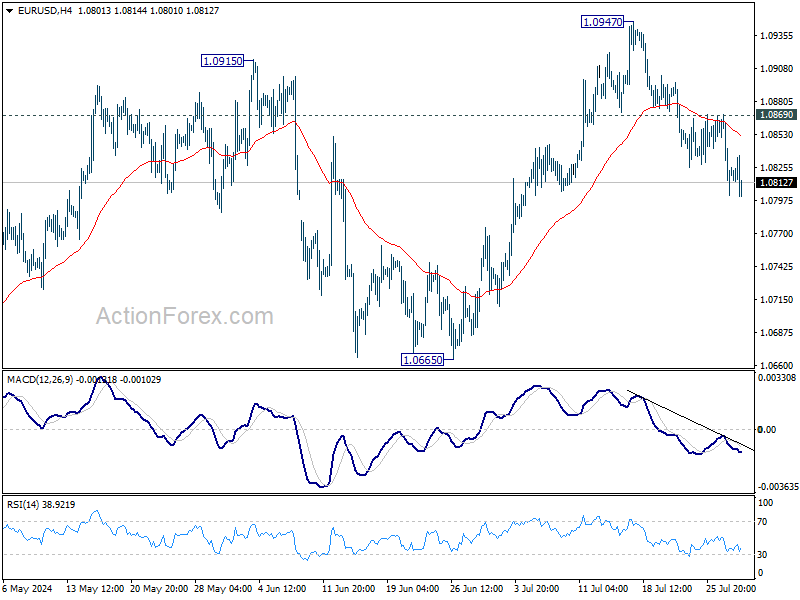
Daily Pivots: (S1) 1.0793; (P) 1.0831; (R1) 1.0860; More.....
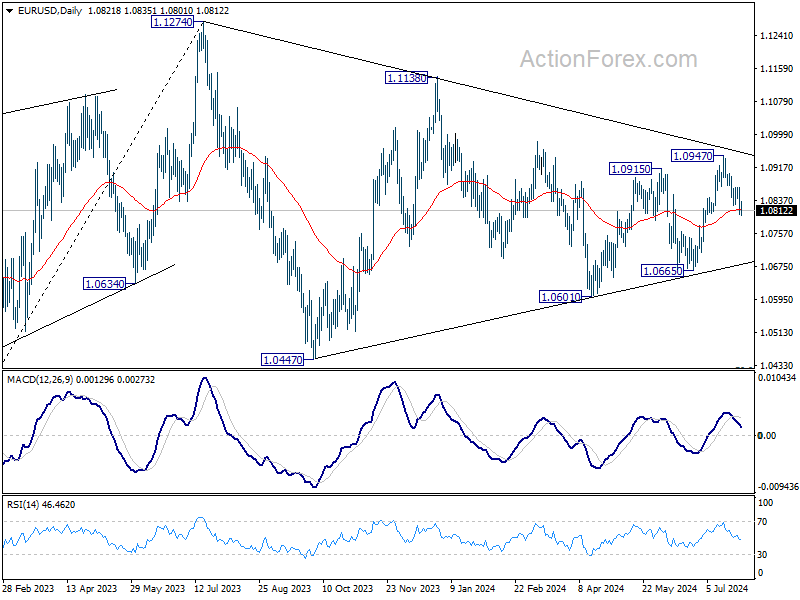
EUR/USD's fall from 1.0947 is in progress and intraday bias stays on the downside. Sustained break of 55 D EMA (now at 1.0815) will argue that whole rebound from 1.0601 has completed with three waves up to 1.0947. Deeper decline should then be seen to 1.0601/0665 support zone next. Nevertheless, break of 1.0869 minor resistance will bring retest of 1.0947 instead.
In the bigger picture, price actions from 1.1274 are viewed as a corrective pattern that's still be in progress. Break of 1.1138 resistance will be the first signal that rise from 0.9534 (2022 low) is ready to resume through 1.1274 (2023 high). However, break of 1.0665 support will extend the correction with another falling leg back towards 1.0447 support.
GBP/USD Mid-Day Outlook
Daily Pivots: (S1) 1.2816; (P) 1.2852; (R1) 1.2898; More...
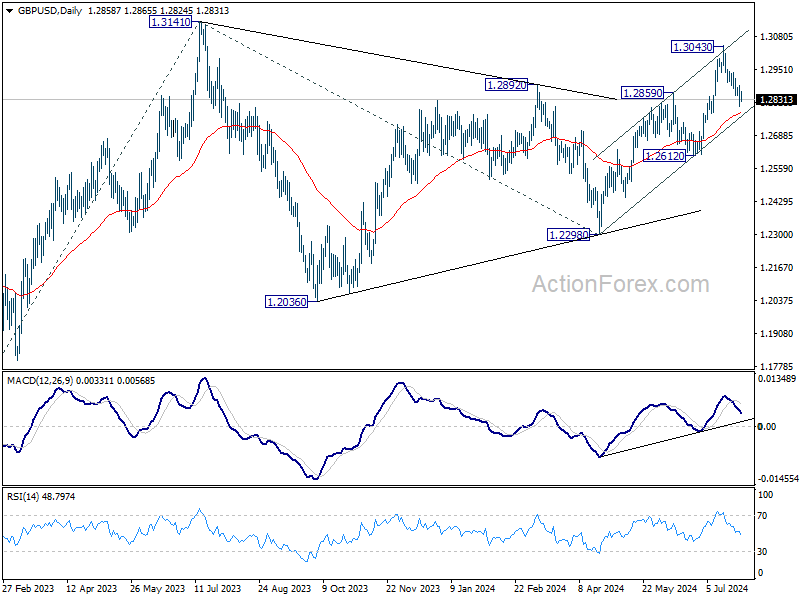
No change in GBP/USD's outlook and intraday bias stays on the downside. Decisive break of 55 D EMA (now at 1.2779) will suggest that rise from 1.2298 has completed with three waves up to 1.3043 Deeper fall would be seen to 1.2612 support and below. On the upside, above 1.2936 resistance will bring retest of 1.3043 resistance instead.
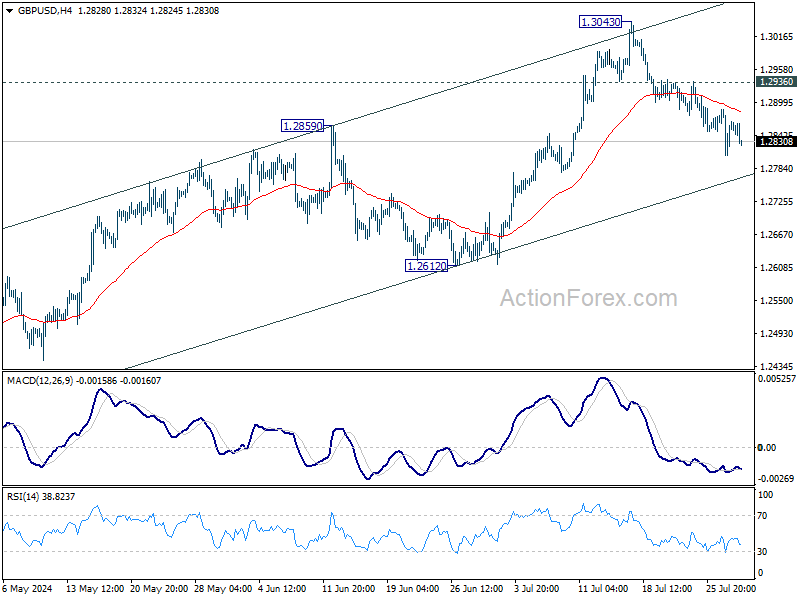
In the bigger picture, corrective pattern from 1.3141 medium term top (2023 high) could have completed with three waves to 1.2298 already. This will now remain the favored case as long as 1.2612 support holds. Firm break of 1.3141 will target 61.8% projection of 1.0351 (2022 low) to 1.3141 from 1.2298 at 1.4022. However, break of 1.2612 support argue that this corrective pattern is extending with another falling leg.
Quiet Forex Trading with Dollar Leading, AUD/JPY at Make-or-Break Level
Overall trading in the forex markets remained relatively subdued today. Dollar continues to hold the top position, despite the absence of clear follow-through buying momentum. Investor caution is also evident in US stock futures, which are moving within a tight range. Any movement in the US markets is likely to be temporary today, as traders are holding off on major bets until tomorrow's FOMC rate decision, looking for clear guidance on a September rate cut.
Elsewhere in the forex markets, Euro remains sluggish despite stronger-than-expected Q2 GDP data and German CPI figures. It is also starting to face selling pressure against Swiss Franc as this week's recovery loses steam. British Pound is also soft, with some traders guarding against a dovish rate cut from BoE on Thursday.
Yen and Australian Dollar are also on the weaker side, with key events scheduled for the upcoming Asian session. For Australian Dollar, Q2 CPI data will be crucial for RBA's decision on whether another rate hike is needed to curb inflation. Australian Dollar will also be influenced by domestic retail sales data and PMIs from China. As for Yen, it is anticipated that BoJ will outline its plan to taper bond purchases, but there is uncertainty over the announcement of an additional rate hike.
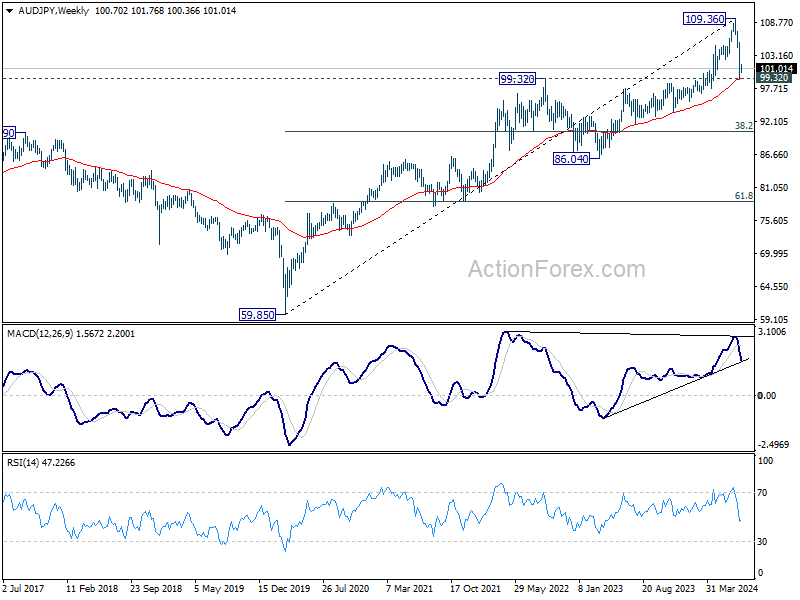
Technically, AUD/JPY is sitting slightly above clear cluster support level of 99.32, with 55 W EMA (now at 99.33). Decisive break of this level will strengthen the case that fall from 109.36 is already correcting the whole up trend from 59.85 (2020 low). That would set the set the stage for deeper medium term fall to 38.2% retracement of 59.85 to 109.36 at 90.44. It's make-or-break time for AUD/JPY in the upcoming Asian session.
In Europe, at the time of writing, FTSE is down -0.17%. DAX is up 0.64%. CAC is up 0.60%. UK 10-year yield is down -0.019 at 4.033. Germany 10-year yield is down -0.010 at 2.352. Earlier in Asia, Nikkei rose 0.15%. Hong Kong HSI fell -1.37%. China Shanghai SSE fell -0.43%. Singapore Strait Times fell -0.07%. Japan 10-year JGB yield fell -0.0318 to 0.997, back below 1% mark.
Eurozone GDP grows 0.3% qoq in Q2, above expectation 0.2% qoq
Eurozone GDP grew 0.3% qoq in Q2, better than expectation of 0.2% qoq. EU GDP also grew 0.3% qoq. Comparing with the same quarter a year ago, Eurozone GDP grew 0.6% yoy while EU grew 0.7% yoy.
Among the Member States for which data are available , Ireland (+1.2%) recorded the highest increase compared to the previous quarter, followed by Lithuania (+0.9%) and Spain (+0.8%). The highest declines were recorded in Latvia (-1.1%), Sweden (-0.8%) and Hungary (-0.2%).
The year on year growth rates were positive for eight countries and negative for three.
Swiss KOF falls to 101, signals moderate growth ahead
Swiss KOF Economic Barometer fell from 102.7 to 101.0 in July, missing the expected 102.6. This drop indicates that the Swiss economy is likely to continue growing at a "rather moderate pace" in the near future, according to KOF.
The decline, while not unanimous across all indicators, is "very widely visible". The outlook for both foreign and consumer demand is worsening. Moreover, sectors such as hospitality, construction, other services, and manufacturing showed negative developments. However, financial and insurance services sector bucked the trend, showing an increase and "resist the widespread downward tendency".
Japan's unemployment rate falls to 2.5%, job availability declines
Japan's unemployment rate fell to 2.5% in June, down from 2.6%, outperforming expectations of being unchanged at 2.6%.
The number of employed persons reached 68.22mmarking an increase of 370k compared to the same month last year. This represents the 23rd consecutive month of employment growth and the highest number since comparable records began in 1953. However, the number of unemployed persons also saw an increase, rising by 20k from the same month last year to 1.81m marking the third consecutive month of increase.
In separate data, the Ministry of Health, Labor and Welfare reported that the job availability ratio fell by 0.01 point from June to 1.23. This marks the third consecutive month of decline in the ratio, indicating that there are now 123 jobs available for every 100 job seekers, down slightly from previous months.
GBP/USD Mid-Day Outlook
Daily Pivots: (S1) 1.2816; (P) 1.2852; (R1) 1.2898; More...
No change in GBP/USD's outlook and intraday bias stays on the downside. Decisive break of 55 D EMA (now at 1.2779) will suggest that rise from 1.2298 has completed with three waves up to 1.3043 Deeper fall would be seen to 1.2612 support and below. On the upside, above 1.2936 resistance will bring retest of 1.3043 resistance instead.
In the bigger picture, corrective pattern from 1.3141 medium term top (2023 high) could have completed with three waves to 1.2298 already. This will now remain the favored case as long as 1.2612 support holds. Firm break of 1.3141 will target 61.8% projection of 1.0351 (2022 low) to 1.3141 from 1.2298 at 1.4022. However, break of 1.2612 support argue that this corrective pattern is extending with another falling leg.
Economic Indicators Update
| GMT | Ccy | Events | Actual | Forecast | Previous | Revised |
|---|---|---|---|---|---|---|
| 23:30 | JPY | Unemployment Rate Jun | 2.50% | 2.60% | 2.60% | |
| 01:30 | AUD | Building Permits M/M Jun | -6.50% | -2.30% | 5.50% | 5.70% |
| 06:45 | EUR | France Consumer Spending M/M Jun | -0.50% | -0.40% | 1.50% | |
| 05:30 | EUR | France GDP Q/Q Q2 P | 0.30% | 0.20% | 0.20% | |
| 07:00 | CHF | KOF Leading Indicator Jul | 101 | 102.6 | 102.7 | |
| 08:00 | EUR | Italy GDP Q/Q Q2 P | 0.20% | 0.20% | 0.30% | |
| 08:00 | EUR | Germany GDP Q/Q Q2 P | -0.10% | 0.10% | 0.20% | |
| 09:00 | EUR | Eurozone GDP Q/Q Q2 P | 0.30% | 0.20% | 0.30% | |
| 09:00 | EUR | Eurozone Economic Sentiment Indicator Jul | 95.8 | 95.4 | 95.9 | |
| 09:00 | EUR | Eurozone Industrial Confidence Jul | -10.5 | -10.5 | -10.1 | -10.2 |
| 09:00 | EUR | Eurozone Services Sentiment Jul | 4.8 | 6.4 | 6.5 | 6.2 |
| 09:00 | EUR | Eurozone Consumer Confidence Jul F | -13 | -13 | -13 | |
| 12:00 | EUR | Germany CPI M/M Jul P | 0.30% | 0.30% | 0.10% | |
| 12:00 | EUR | Germany CPI Y/Y Jul P | 2.30% | 2.20% | 2.20% | |
| 13:00 | USD | S&P/CS Composite-20 HPI Y/Y May | 6.80% | 7.40% | 7.20% | |
| 13:00 | USD | Housing Price Index M/M May | 0.00% | 0.20% | 0.20% | 0.30% |
| 14:00 | USD | Consumer Confidence Jul | 99.8 | 100.4 |
Has Rally in GBPCAD Peaked?
- GBPCAD stabilizes near 3-year high, at the top of a bullish channel
- Technical signals flag weaker sessions ahead; bears eye 1.7700 level
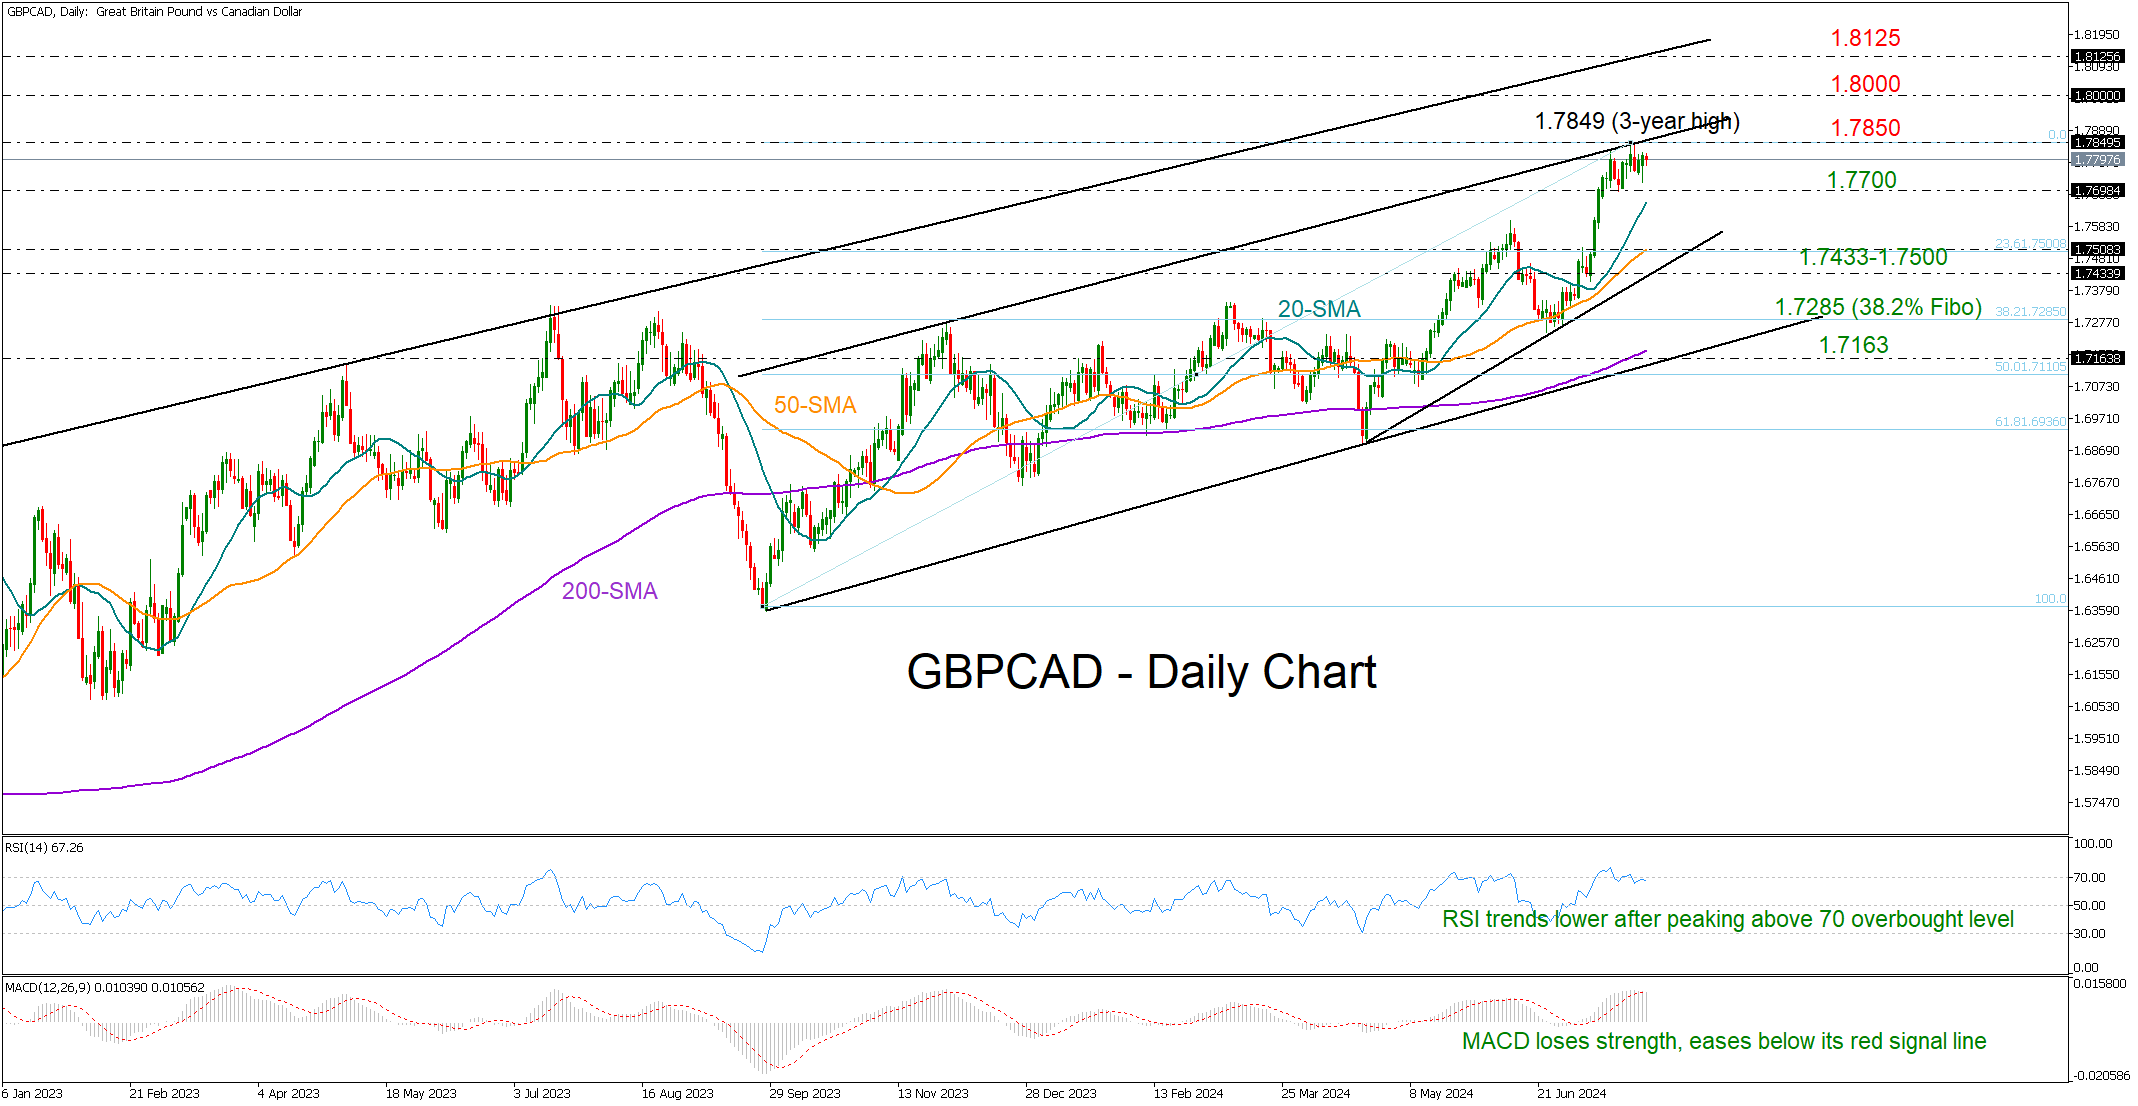
GBPCAD is in the fifth week of gains, having exponentially risen to 1.7849 last week– the highest level reached since March 2021.
The pair has been on the sidelines this week, retaining marginal gains so far, with the RSI and the MACD signaling growing appetite for selling as the former has changed trajectory to the downside after peaking above its 70 overbought level and the has retreated below its red signal line.
If the bears drive the price below the 1.7700 level and beneath the 20-day simple moving average (SMA), the 50-day SMA coupled with the tentative support trendline drawn from April’s low might attempt to pause the sell-off within the 1.7433-1.7500 territory. The 23.6% Fibonacci retracement of the September-July upleg is adding extra credence to the region. Hence, a violation there could upset traders, leading to a swift bearish correction towards the 38.2% Fibonacci of 1.7285.
In the big picture, the pair seems to be trading within a bullish channel with support at 1.7135 and resistance at 1.7895. A decisive rally above the channel could last till the 1.8000 psychological number or even higher at 1.8125, where the resistance line from December 2022 is placed.
To sum up, GBPCAD seems to have become more sensitive to bearish developments after unlocking a three-year high, though only a close below 1.7000 could bolster selling appetite, whilst an outlook deterioration could happen lower and beneath 1.7433.
EUR/USD Outlook: Corrects Monday’s Drop, Looks for Fresh Direction Signal
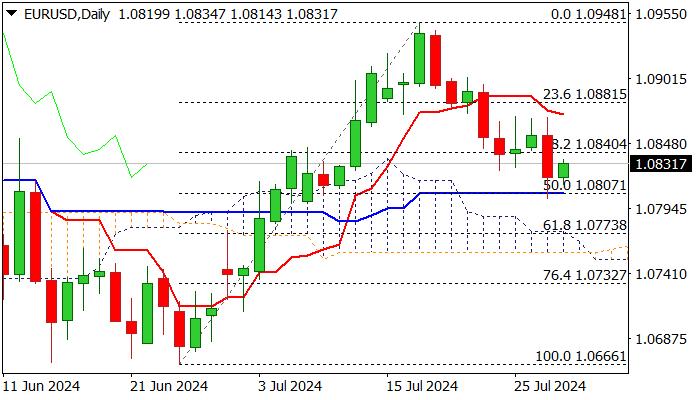
EURUSD edges higher on Tuesday morning after strong fall on Monday was contained by solid support at 1.0807 (daily Kijun-sen / 50% retracement of 1.0666/1.0948 rally) and also failed to register a daily close below cracked converged 55/200DMA’s (1.0815).
Monday’s downside rejection also left a bear-trap, generating an initial positive signal, which requires confirmation on lift above 1.0870 (lower platform of past four days, reinforced by daily Tenkan-sen) to indicate an end of corrective phase and shift near term focus higher.
Daily studies show MA’s in mixed setup, while momentum and RSI are currently neutral.
On the other hand, tomorrow’s twist of daily cloud could be magnetic and attract bears for attack at thinning cloud, break of which to activate negative scenario and risk deeper drop towards 1.0732 Fibo support (76.4%).
Eurozone preliminary Q2 GDP was in line with expectations but better than Q1, which provided some support to Euro, with German in inflation data (due later today) eyed for fresh signals.
Res: 1.0840; 1.0870; 1.0881; 1.0902.
Sup: 1.0814; 1.0802; 1.0758; 1.0732.
WTI Oil: At the Risk of Further Drop to Retest Major Range Support of US$73.15-71.35/Barrel
- Citigroup Economic Surprise Indices across the different regions (except for Latin America) on average are suggesting lackluster economic growth.
- US crude oil inventories (excluding SPR) are showing signs of a build-up.
- Technical factors are suggesting further potential weakness for WTI crude oil below US$80.30 key medium-term resistance.
Since its high of US$84.74 printed on 5 July 2024, the price actions of West Texas Oil CFD (a proxy of the WTI crude oil futures) have tumbled by 10% to print a current intraday low of US$76.16 at this time of the writing in light of sluggish demand from China and the lack of direct fiscal stimulus measures from China top policymakers after the conclusion of The Third Plenum; a twice-a-decade work plan meeting to set China’s economy strategy for the medium-term.
In addition, Donald Trump, the Republican US presidential nominee spoke about lowering the inflationary pressures in the US by reducing energy costs through an increase in domestic oil and gas production during the Republican National Convention on 18 July. In turn, added further downside pressure on WTI crude oil.
Lackluster economic growth prospects may put a cap on oil demand
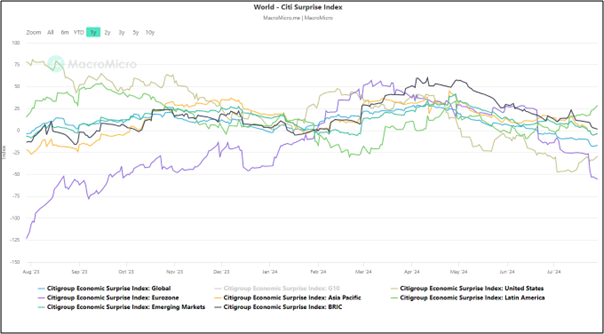
Fig 1: Citi Economic Surprise Indices of different regions as of 29 Jul 2024 (Source: MacroMicro, click to enlarge chart)
Since the start of spring 2024 (April), the Citigroup Economic Surprise Indices for different regions have been trending downwards except for Latin America (see Fig 1).
These indices measure the difference between the actual readings of key economic indicators and their respective forecasts. Hence, results trending toward zero suggest that economic conditions are generally worse than expected which in turn is likely to reduce oil demand.
US crude oil inventories are showing signs of a build-up
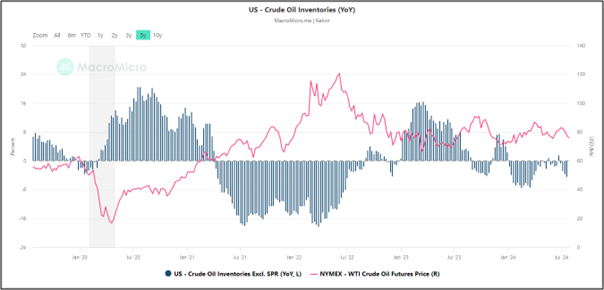
Fig 2: EIA US crude oil inventories excluding SPR (y/y change) with WTI crude oil futures as of 19 Jul 2024 (Source: MacroMicro, click to enlarge chart)
The growth of US crude oil inventories excluding the Strategic Petroleum Reserve (SPR) on a year-on-year basis has an indirect correlation with the movement of WTI crude oil as build-up in oil inventories put downside pressure on oil prices.
Since mid-March 2024, the drawn down of US crude oil inventories (excluding SPR) has slowed down from -7.5% y/y to -4.45% y/y as of 19 July based on data from the US Energy Information Administration (EIA) which suggests a potential build-up in oil inventories which is likely to dampen the prices of WTI crude oil (see Fig 2).
WTI crude oil reintegrated below its 200-day moving average
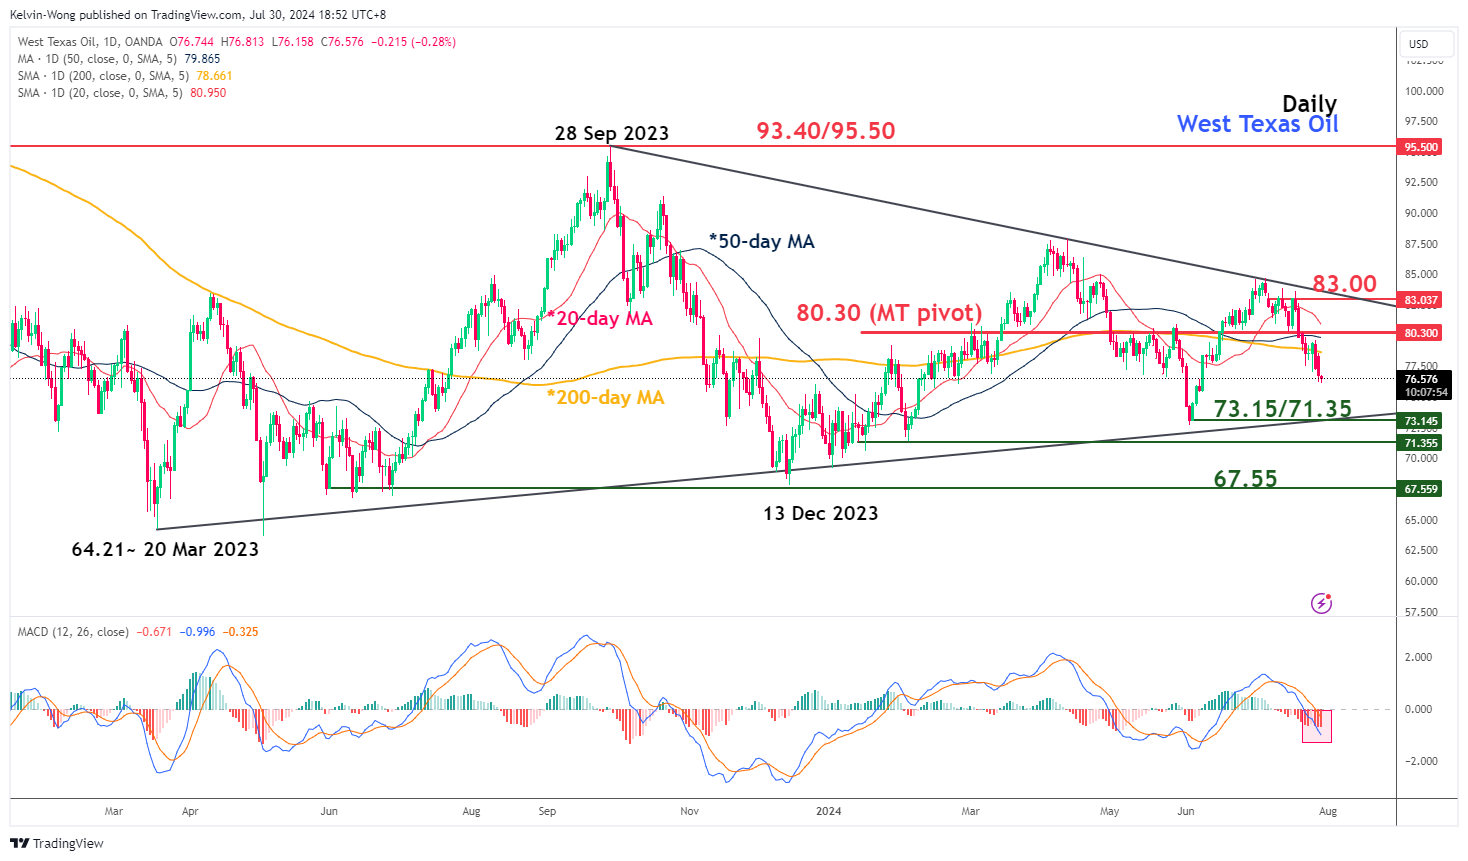
Fig 3: West Texas Oil CFD medium-term trend as of 30 Jul 2024 (Source: TradingView, click to enlarge chart)
After a failure to have a recent positive follow-through in price actions last Friday, 26 July, the West Texas Oil CFD has broken below its key 200-day moving average, and its daily MACD trend indicator has continued to trend lower below its centreline in the past six sessions.
These observations suggest further technical weakness for West Texas Oil CFD to expose the “Symmetrical Triangle” range support of US$73.15/71.35 in the coming weeks (see Fig 3).
However, a clearance above the US$80.30 key medium-term pivotal resistance is likely to negate the bearish tone the see a retest on the upper boundary of the “Symmetrical Triangle” that is acting as an intermediate resistance at US$83.00 in the first step.