Sample Category Title
EURJPY Stubbornly Fights for An Upturn
- EURJPY remains resilient above pivotal territory
- Some recovery likely, but short-term risk not bullish yet
- Eurozone Q2 GDP growth +0.3% q/q vs +0.2% q/q expected
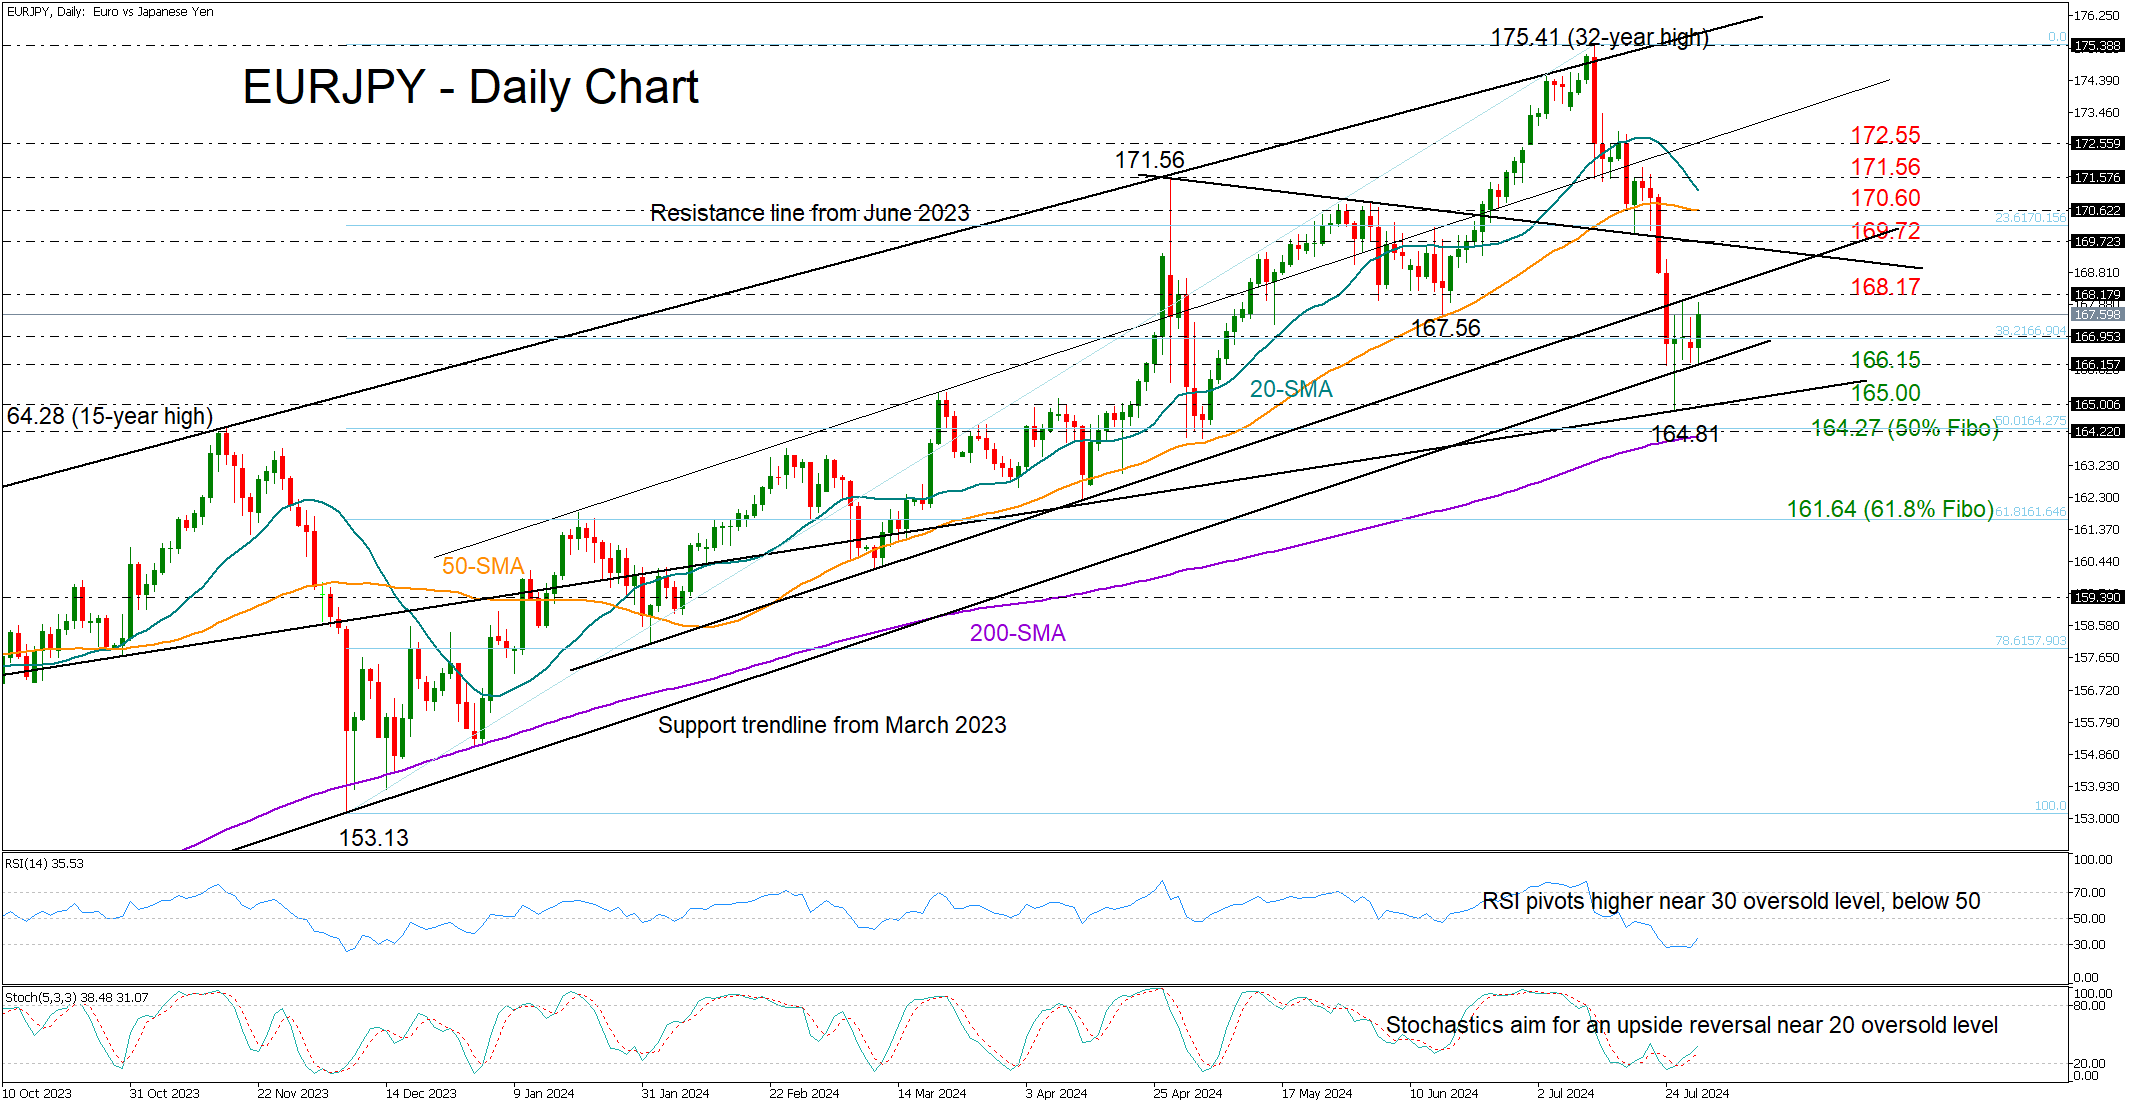
EURJPY is making another attempt to pierce through the 168.00 level and the support-turned-resistance trendline from February at 168.17.
Although previous efforts were fruitless, the pair keeps defending itself above long-term trendlines for the fourth day, and with oversold conditions detected by the technical indicators, there is a possibility of positive outcomes for the bulls.
A close above 168.17 might confirm an extension towards the 169.72 barrier, though only a break beyond the 20- and 50-day simple moving averages (SMAs) and April’s top of 171.56 would brighten the short-term outlook. A continuation higher could halt near the 172.55 territory, where the price got rejected in mid-July. Another success there might clear the way towards July's high of 175.41.
Should selling forces resurface, the price might again seek shelter somewhere between 166.15 and 165.00. The 200-day SMA and the 50% Fibonacci level at 164.27 will be closely monitored too. A breach could lead to a swift decline towards the 61.8% Fibonacci level of 161.65.
As regards the market trend, the pair has charted a lower low below June’s trough of 167.56, raising concerns of a bearish trend reversal as the 20- and 50-day SMAs approach a negative intersection.
To summarize, EURJPY is still exposed to downside risks, but there is a chance of a rebound or consolidation as the pair seems to be emerging from oversold conditions.
NZD/USD Sinks to Three-Month Minimum, Driven by Rate Speculation and Strengthening USD
The NZD/USD pair plummeted to 0.5892, marking a significant three-month low. The New Zealand dollar remains under pressure as the US dollar gains strength due to the start of the Federal Reserve's two-day meeting.
The Fed is expected to leave the interest rate in the target range of 5.25-5.50% this time. At the same time, the market eagerly anticipates clear signals regarding the September meeting, when borrowing costs are expected to be lowered.
A week earlier, the NZD fell by almost 2% against the USD due to overly large-scale risk aversion in the global market, reduced carry trade positions with JPY, and China's relatively sluggish macroeconomic background.
Expectations regarding the Reserve Bank of New Zealand's future steps also exert fundamental pressure on the NZD. The main forecast assumes that the RBNZ will lower the interest rate soon. At the moment, investors take a rate cut at the August meeting with a 44% probability, which is quite a lot, given all the inputs.
Technical Analysis of NZD/USD
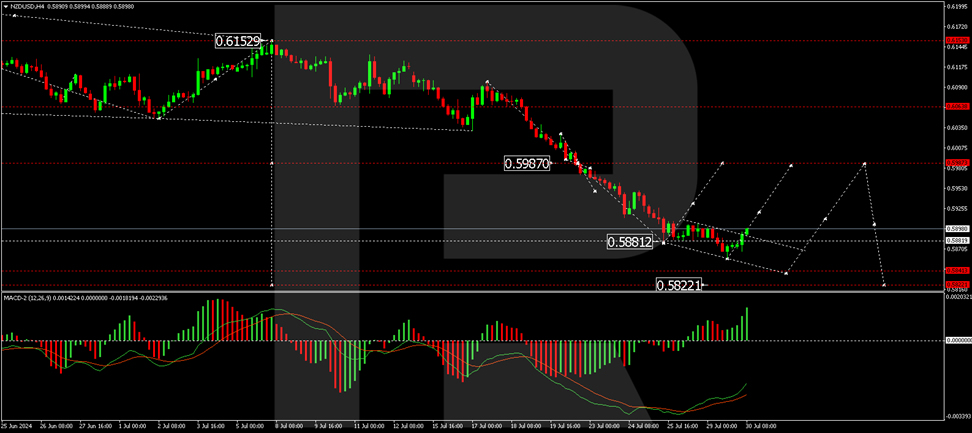
On the H4 chart of NZD/USD, the market executed a wave of decline to the level of 0.5858. Today, the market is correcting this wave of decline. We expect a growth link to the level of 0.5903. If this level is breached upwards, the correction continuing to 0.5987 (test from below) is possible. After the correction is completed, we will consider the beginning of a new wave of decline to the level of 0.5840 with the prospect of trend continuation to the level of 0.5822. Technically, this scenario is confirmed by the MACD indicator. Its signal line is under the zero mark and is directed strictly upwards.
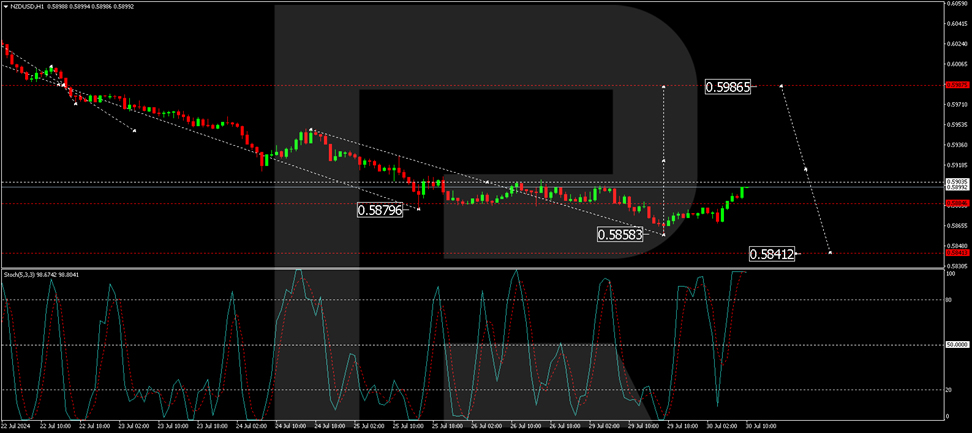
On the H1 chart of NZD/USD, the market is forming a growth structure towards the level of 0.5903. After working off this level, we will consider the probability of a decline to the level of 0.5884 (test from above). Then, we will consider the likelihood of another growth structure to the level of 0.5986. Technically, this scenario is confirmed by the Stochastic oscillator. Its signal line is above the 80 mark. We expect a decline to the level of 50 and further to the level of 20.
GBP/USD Stalls as Bulls and Bears Clash Ahead of Central Bank Meetings
- The GBP/USD pair is currently experiencing a standoff between bulls and bears, with the pair clinging to support at the 1.2850 level.
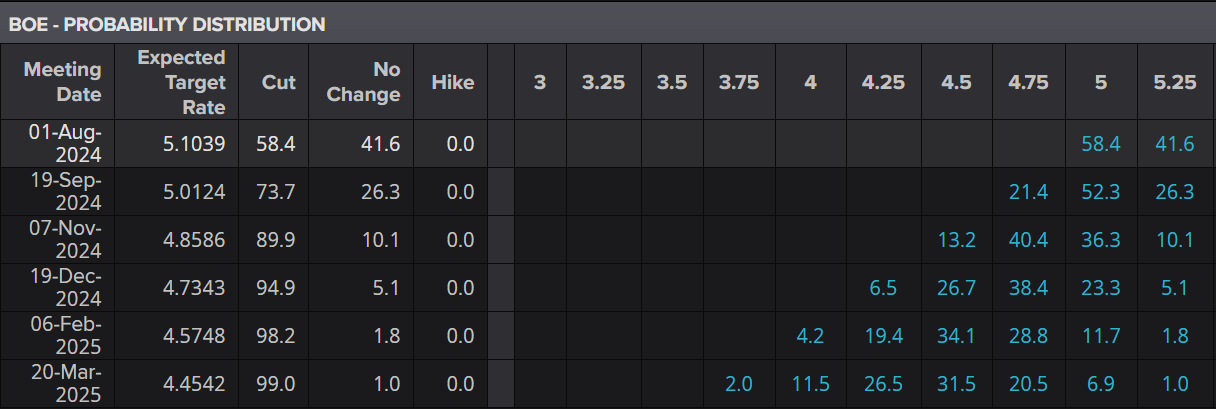
- The upcoming Federal Reserve and Bank of England policy meetings are adding to market uncertainty, with the odds of a BoE rate cut hovering around 58%.
- UK Finance Minister Rachel Reeves has announced immediate spending cuts, citing the unsustainability of public finances.
Cable has held onto support at the 1.2850 level as the battle between bulls and bears heats up. With the Federal Reserve and the Bank of England (BoE) holding their policy meetings this week, markets are on edge.
Yesterday, an attempted move lower driven by renewed US dollar safe haven appeal pulled the pair below 1.2850, but buying pressure quickly emerged. The increasing geopolitical risk premium continues to weigh on Cable, although expectations of the Federal Reserve’s rate cut cycle are providing some offset.
The BoE faces an even more intriguing situation at its upcoming monetary policy meeting. The odds for a rate cut on Thursday remain around 50%, making it a difficult decision to predict.
Bank of England Interest Rate Probabilities, July 30, 2024
Source: LSEG
An excellent way of looking at it, two members of the nine-person committee have already begun voting for rate cuts. Two or possibly three others hold the opposite view and are clearly resistant to cuts. This leaves four or five members in the middle, who seem undecided.
June’s meeting indicated that some, perhaps most, of these officials believed the decision was finely balanced. However, since the general election was called in late May, we’ve heard very little from these policymakers.
UK Government Cuts Spending
Britain’s new Finance Minister, Rachel Reeves, informed Parliament that her conservative predecessor had set public spending to reach £21.9 billion this year, necessitating immediate cuts of £5.5 billion.
Reeves emphasized the unsustainability of current public finances. Conservative opponents criticized her remarks, accusing her of setting the stage for tax hikes—a possibility Reeves has not dismissed.
The Office for Budget Responsibility announced it would review the preparation of Jeremy Hunt’s March budget, calling it a serious issue.
Economic Data Ahead
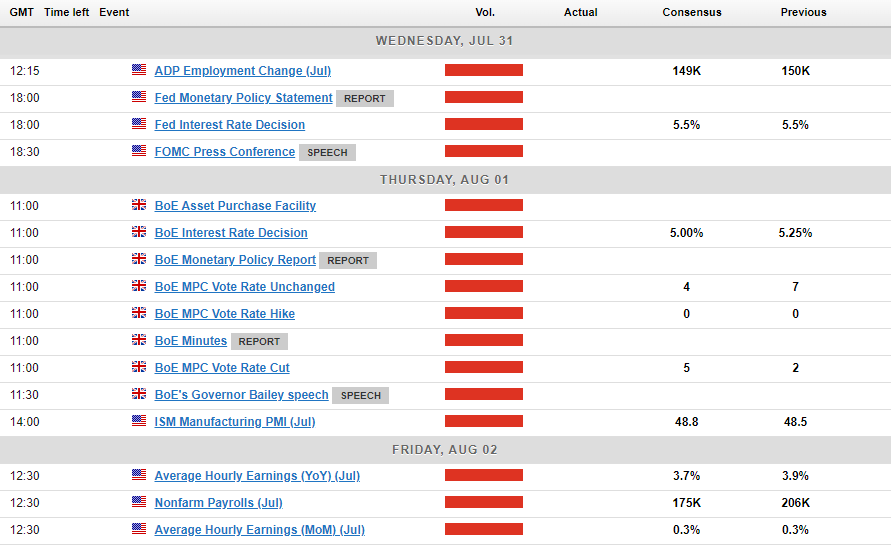
A big week for Central Banks with the Bank of England (BoE), Federal Reserve and the Bank of Japan (BoJ). On top of that we also have the NFP and jobs report on Friday which could have a bigger impact on the US Dollar than the FOMC meeting.
Of course the impact of the Fed meeting will largely depend on the rhetoric adopted by Fed Chair Jerome Powell as markets are expecting the Fed to hold rates steady.
Technical Analysis
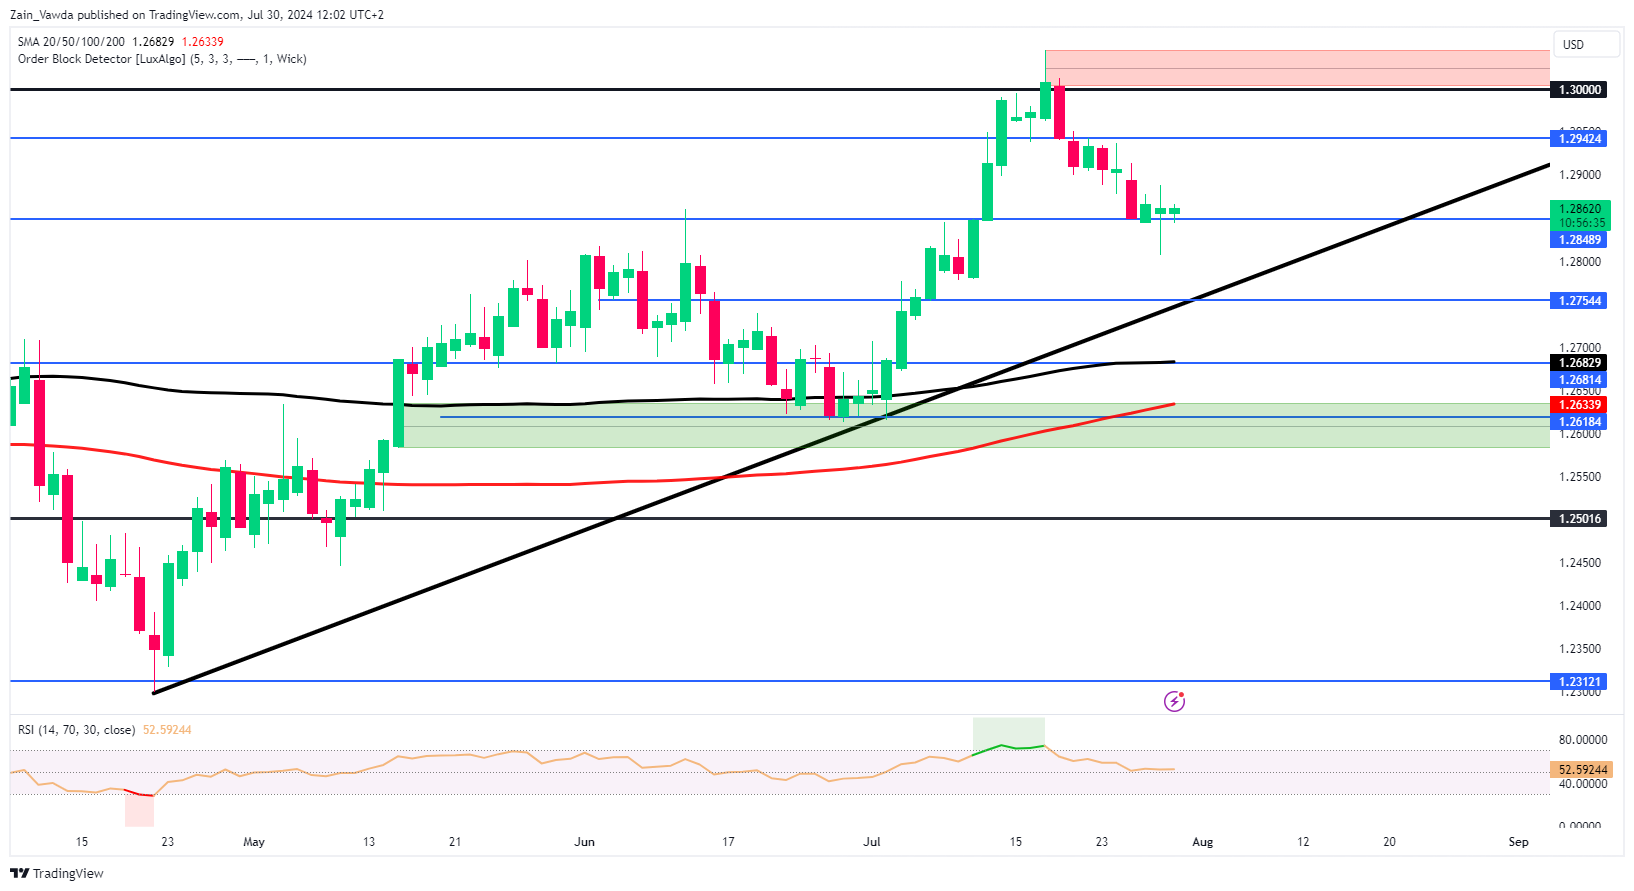
From a technical perspective, GBP/USD has been consolidating over the past three days since hitting support at 1.2850.
Both bulls and bears have attempted to move the price away from this level, but each effort has been countered by buying or selling pressure. This underscores the current uncertainty surrounding the upcoming Central Bank meetings.
Immediate support below the 1.2850 area lies at the 1.2800 and 1.2750 levels. A break below these support zones could shift focus back to the psychological 1.2500 mark.
Conversely, an upward movement will face resistance at 1.2950 before the psychological 1.3000 level becomes crucial again.
GBP/USD Chart, July 30, 2024
Source: TradingView (click to enlarge)
Support
- 1.2800
- 1.2750
- 1.2680
Resistance
- 1.2950
- 1.3000
- 1.3040
USD/JPY – All Eyes on Bank of Japan, Yen Slips
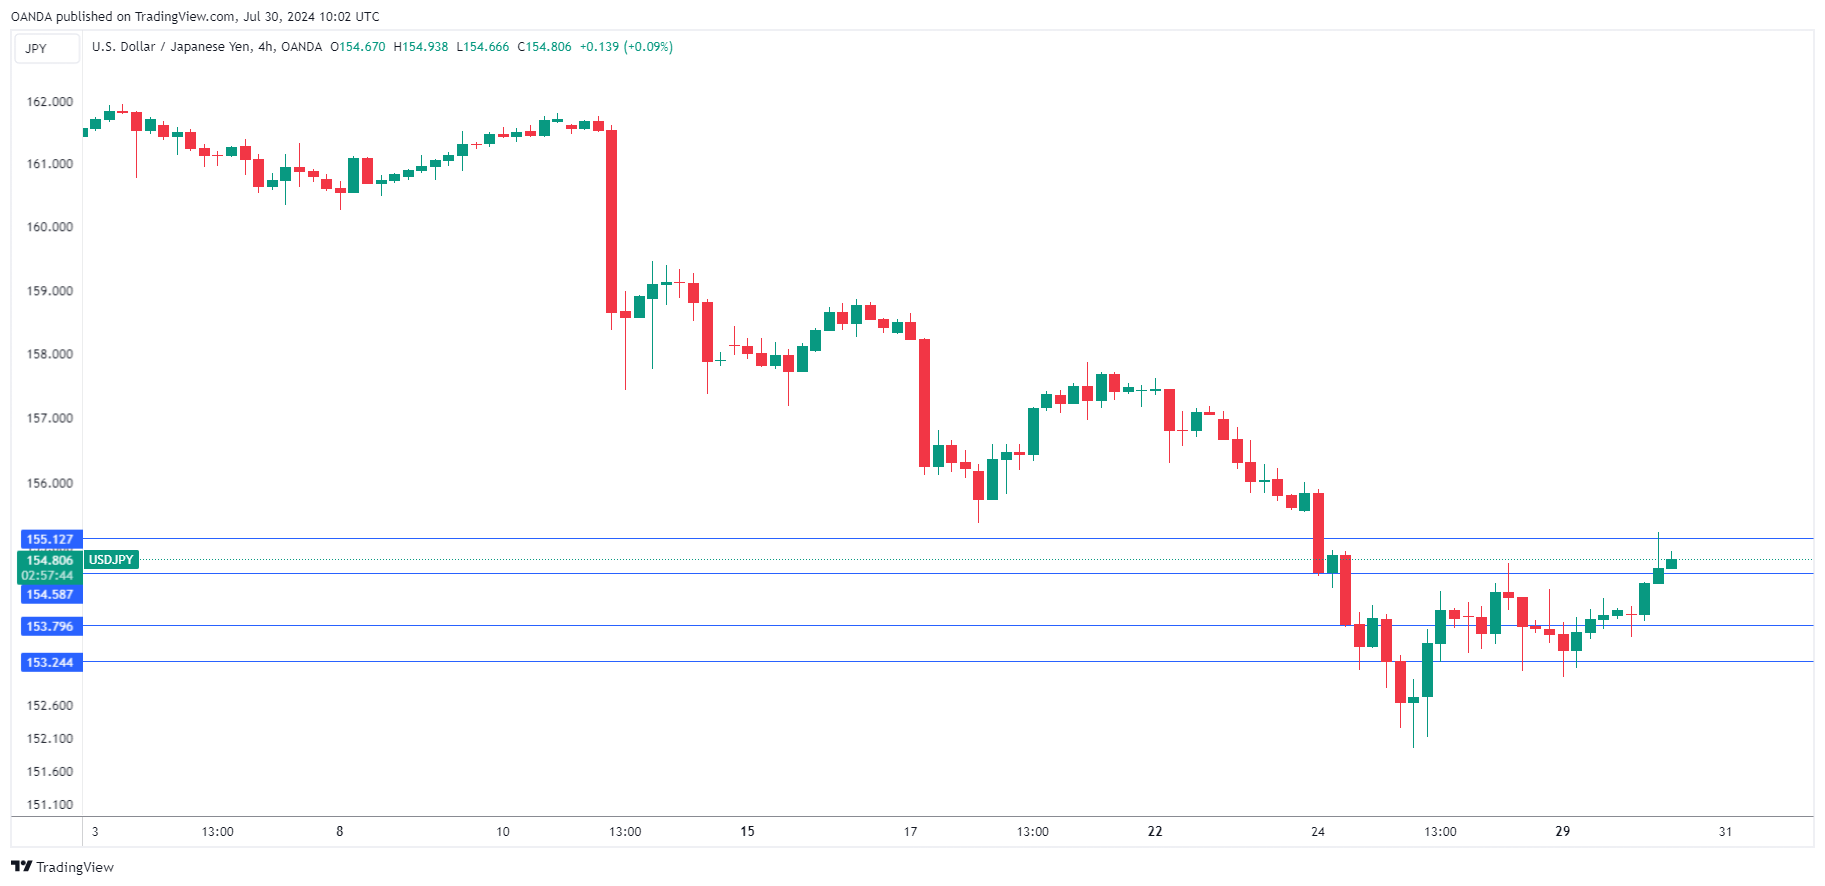
The Japanese yen has sparkled in the second half of July but has lost steam this week. USD/JPY is trading at 154.88 in the European session, up 0.57% on the day at the time of writing.
To hike or not to hike
The Bank of Japan meets early Wednesday and the markets aren’t sure what to expect. Will we see the first rate hike since March or will the policy markets again stay on the sidelines? The markets have priced in a 65% chance of a 10-basis point hike, which would raise rates to 0.1%-0.2%, while some economists expect a hike of 15 even 25 basis points.
Inflation remains above the BoJ’s inflation rate of 2% but is still relatively moderate, which means it isn’t really a factor in tomorrow’s crucial decision. With the Fed widely expected to cut in September, the US/Japan rate differential will narrow, putting less pressure on the BoJ to hike rates.
The BoJ is also expected to provide details on a quantitative tightening plan to cut bond buying by around half in the next 12 to 18 months. This would help contain inflation and put upward pressure on interest rates. Still, most of the buzz in the markets surrounds the rate decision.
Will Fed signal a September cut?
Following the BoJ policy meeting, the Federal Reserve meets later o n Wednesday. Unlike the BoJ meeting, there won’t be any drama around rates, as the Fed is virtually certain to hold the benchmark rate of 5.25%-5.5%, where it has hovered since July 2023.
Investors will be monitoring the rate statement and Fed Chair Powell’s follow-up rate statement. Will we see a signal of a September cut? The markets have priced in a quarter-point cut at 89% and a half-point cut at 10% according to CME’s FedWatch. Any hint of a rate cut in September could have a significant impact on the movement of the US dollar.
.
USD/JPY Technical
- USD/JPY has pushed past resistance at 154.58 and is testing resistance at 155.13
- 154.58 and 153.80 are the next support level
Spooked Bitcoin
Market picture
The cryptocurrency market pulled back 3% to a capitalisation of $2.4 trillion, erasing gains for a while due to the Bitcoin conference. For the past week and a half, the market has been predominantly moving in the $2.4-2.5 trillion range. The hesitancy of traders this week can easily be blamed on expectations of important rate decisions from key central banks and Friday’s US jobs report later in the week.
Bitcoin spent a few seconds above $70K on Monday before undergoing a powerful sell-off that took its price below $66K at the peak of the decline in Asian trading on Tuesday. The market was pressured by reports that the US government had put 30K Bitcoins ($2.1bn) into circulation.
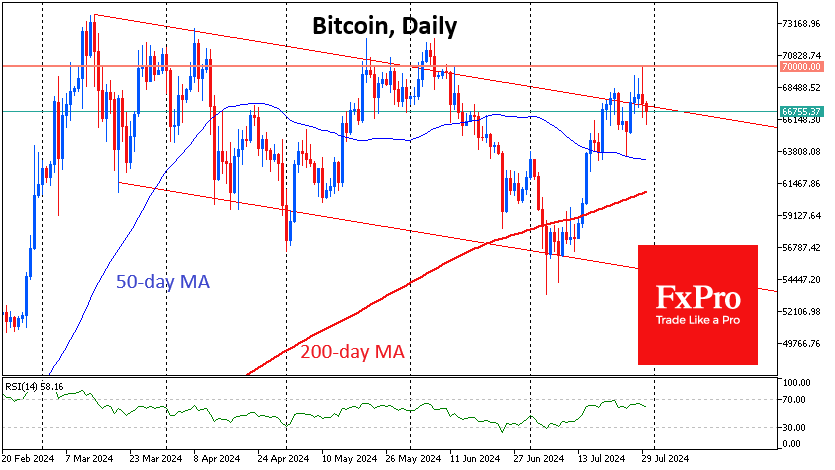
One can only wonder whether this is part of a trend following the Mt Gox and German government sales, a game of anticipation before Trump came to power and banned these sales, or whether it’s all about the “high price.” Only further transactions will help us to find an answer. There are believed to be over 203k bitcoins on the balance sheet, a concentrated sale of which could sell off the market.
Technically, yesterday’s breakout of resistance by Bitcoin may still be false, and the latest rise slightly changes the angle of the downtrend but does not break it.
News background
According to CoinShares, crypto fund investments rose by $245 million last week after inflows of $1.353 billion a week earlier; the figure is up for the fourth week in a row. Bitcoin investments were up $519 million; Ethereum was down $285 million, and Solana was down $3 million.
29 July marked 100 days since BTC’s fourth halving. ETC Group noted that bitcoin has historically started to move towards updating all-time highs (ATH) after the end of this period. Bitcoin’s post-halving consolidation is “pretty much over,” according to co-founder Okse.
BrainChip Holdings believes Bitcoin miners have probably started a new phase of accumulating coins to capitalise on the potential price rise. Such behaviour by market participants indicates confidence in BTC’s long-term outlook.
HashKey Global believes the main catalyst for Bitcoin’s growth is US presidential candidate Donald Trump’s decision to become a major supporter of the cryptocurrency. He recently stated that Bitcoin has the potential to surpass gold in terms of market value in the future.
Co-founder of cryptocurrency exchange Gemini Cameron Winklevoss called on Democratic presidential candidate Kamala Harris to fire SEC head Gary Gensler as soon as possible to prove her support for the crypto industry.
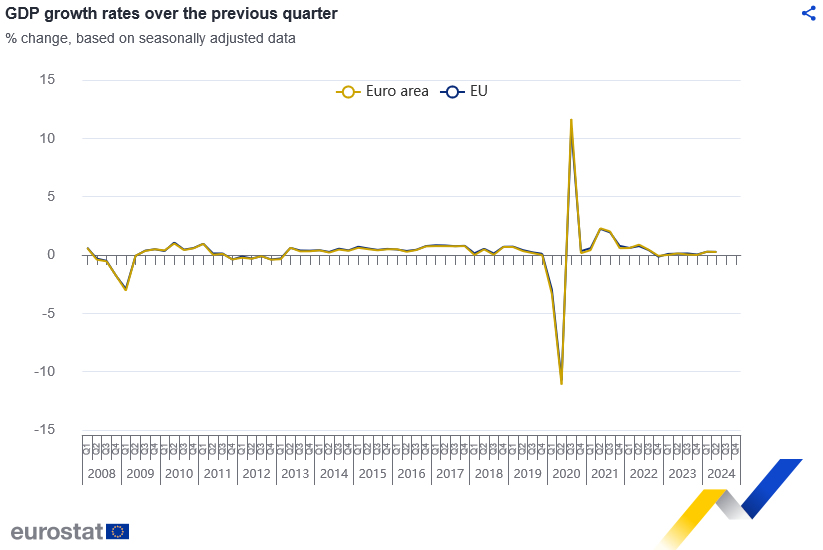
Eurozone GDP grows 0.3% qoq in Q2, above expectation 0.2% qoq
Eurozone GDP grew 0.3% qoq in Q2, better than expectation of 0.2% qoq. EU GDP also grew 0.3% qoq. Comparing with the same quarter a year ago, Eurozone GDP grew 0.6% yoy while EU grew 0.7% yoy.
Among the Member States for which data are available , Ireland (+1.2%) recorded the highest increase compared to the previous quarter, followed by Lithuania (+0.9%) and Spain (+0.8%). The highest declines were recorded in Latvia (-1.1%), Sweden (-0.8%) and Hungary (-0.2%).
The year on year growth rates were positive for eight countries and negative for three.
GBPUSD Extends Pullback From 1-Year High
- GBPUSD declines steadily from 1-year high
- The bears eye the 50-day SMA as next target
- Momentum indicators ease but remain positively tilted
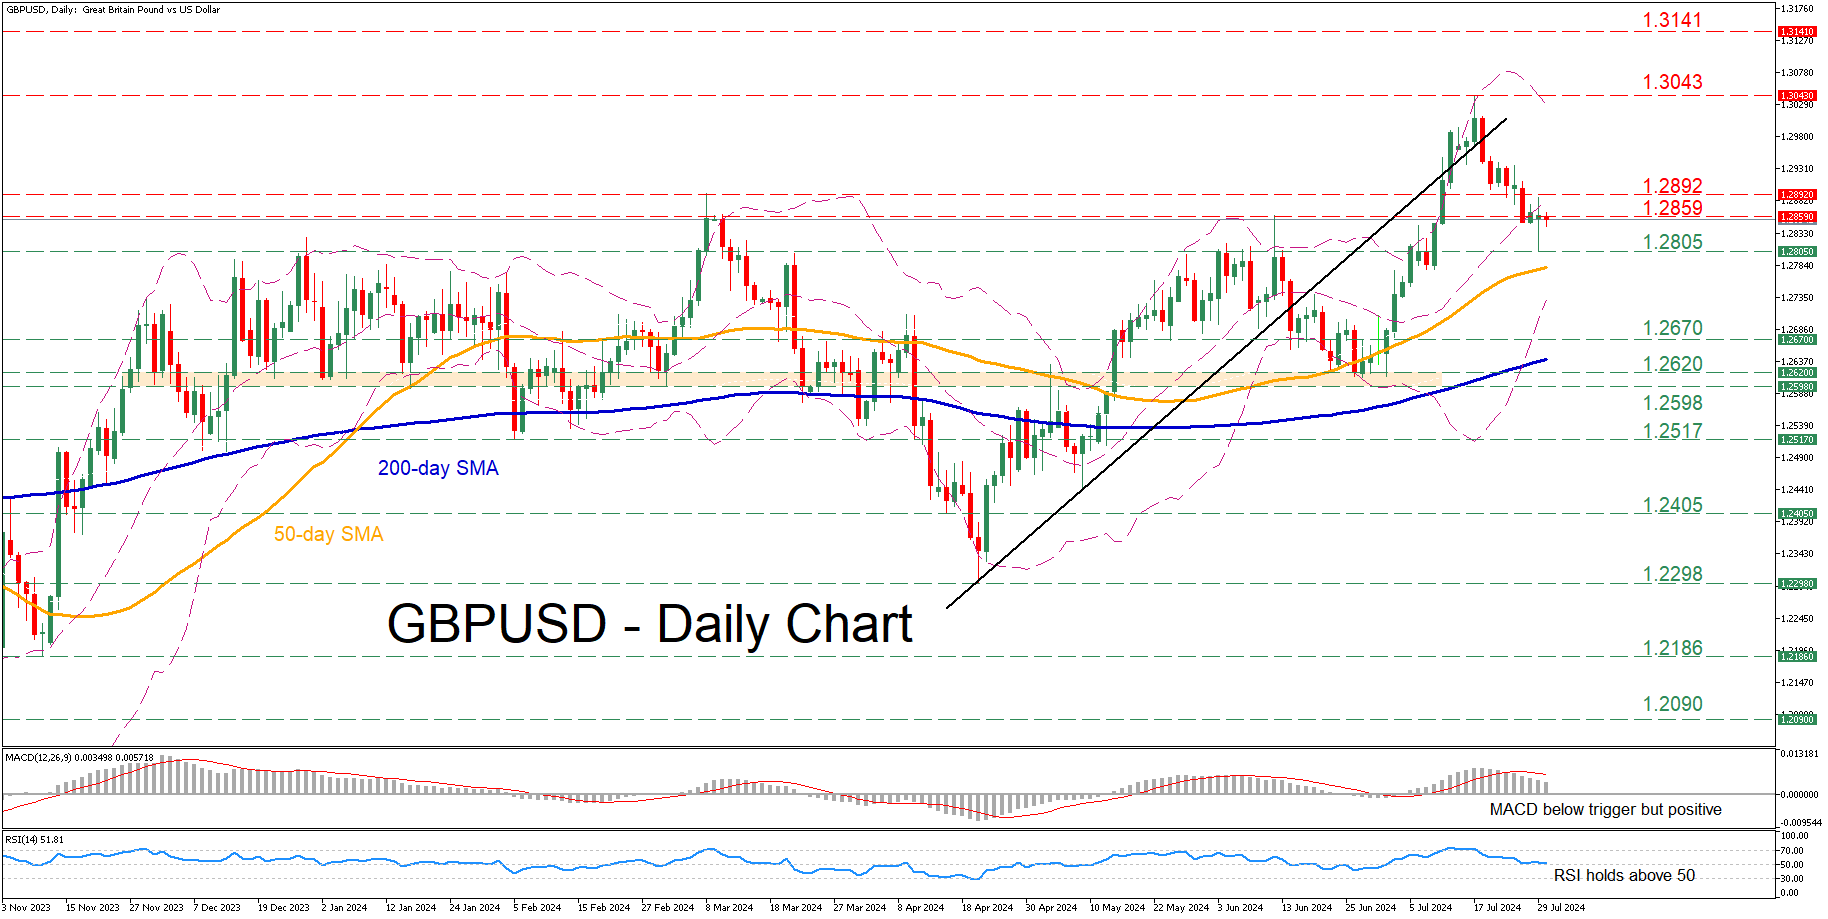
GBPUSD had been on the rise following its bounce off the 50-day simple moving average (SMA) in late June. Although the pair posted a fresh one-year high of 1.3043 on July 17, it has been undergoing a downside correction since then.
Should bearish pressures persist, the price could face the recent support of 1.2805, a region that also acted as resistance in March, May and June. Lower, the May-June support of 1.2670 may prevent further declines. Failing to halt there, the pair might descend to challenge the 1.2620-1.2598 range, which is framed by the June and March lows.
On the flipside, if the pullback fades and the pair reverses back higher, the June high of 1.2859 may prove to be the first barricade for the bulls to clear. A break above that zone could open the door for the March peak of 1.2892. Should that hurdle also fail, attention could shift to the one-year peak of 1.3043.
Overall, GBPUSD has come under selling pressure after its trip to a fresh one-year high came to an end. For the short-term technical picture to deteriorate further, the pair needs to slide beneath the 50-day SMA.
US 100 Index Stops at Uptrend Line; Positive Risks Not Faded Yet
- US 100 heads up, standing beneath short-term rising trend line
- Stochastics point north above oversold region
- RSI ticks higher below 50 level
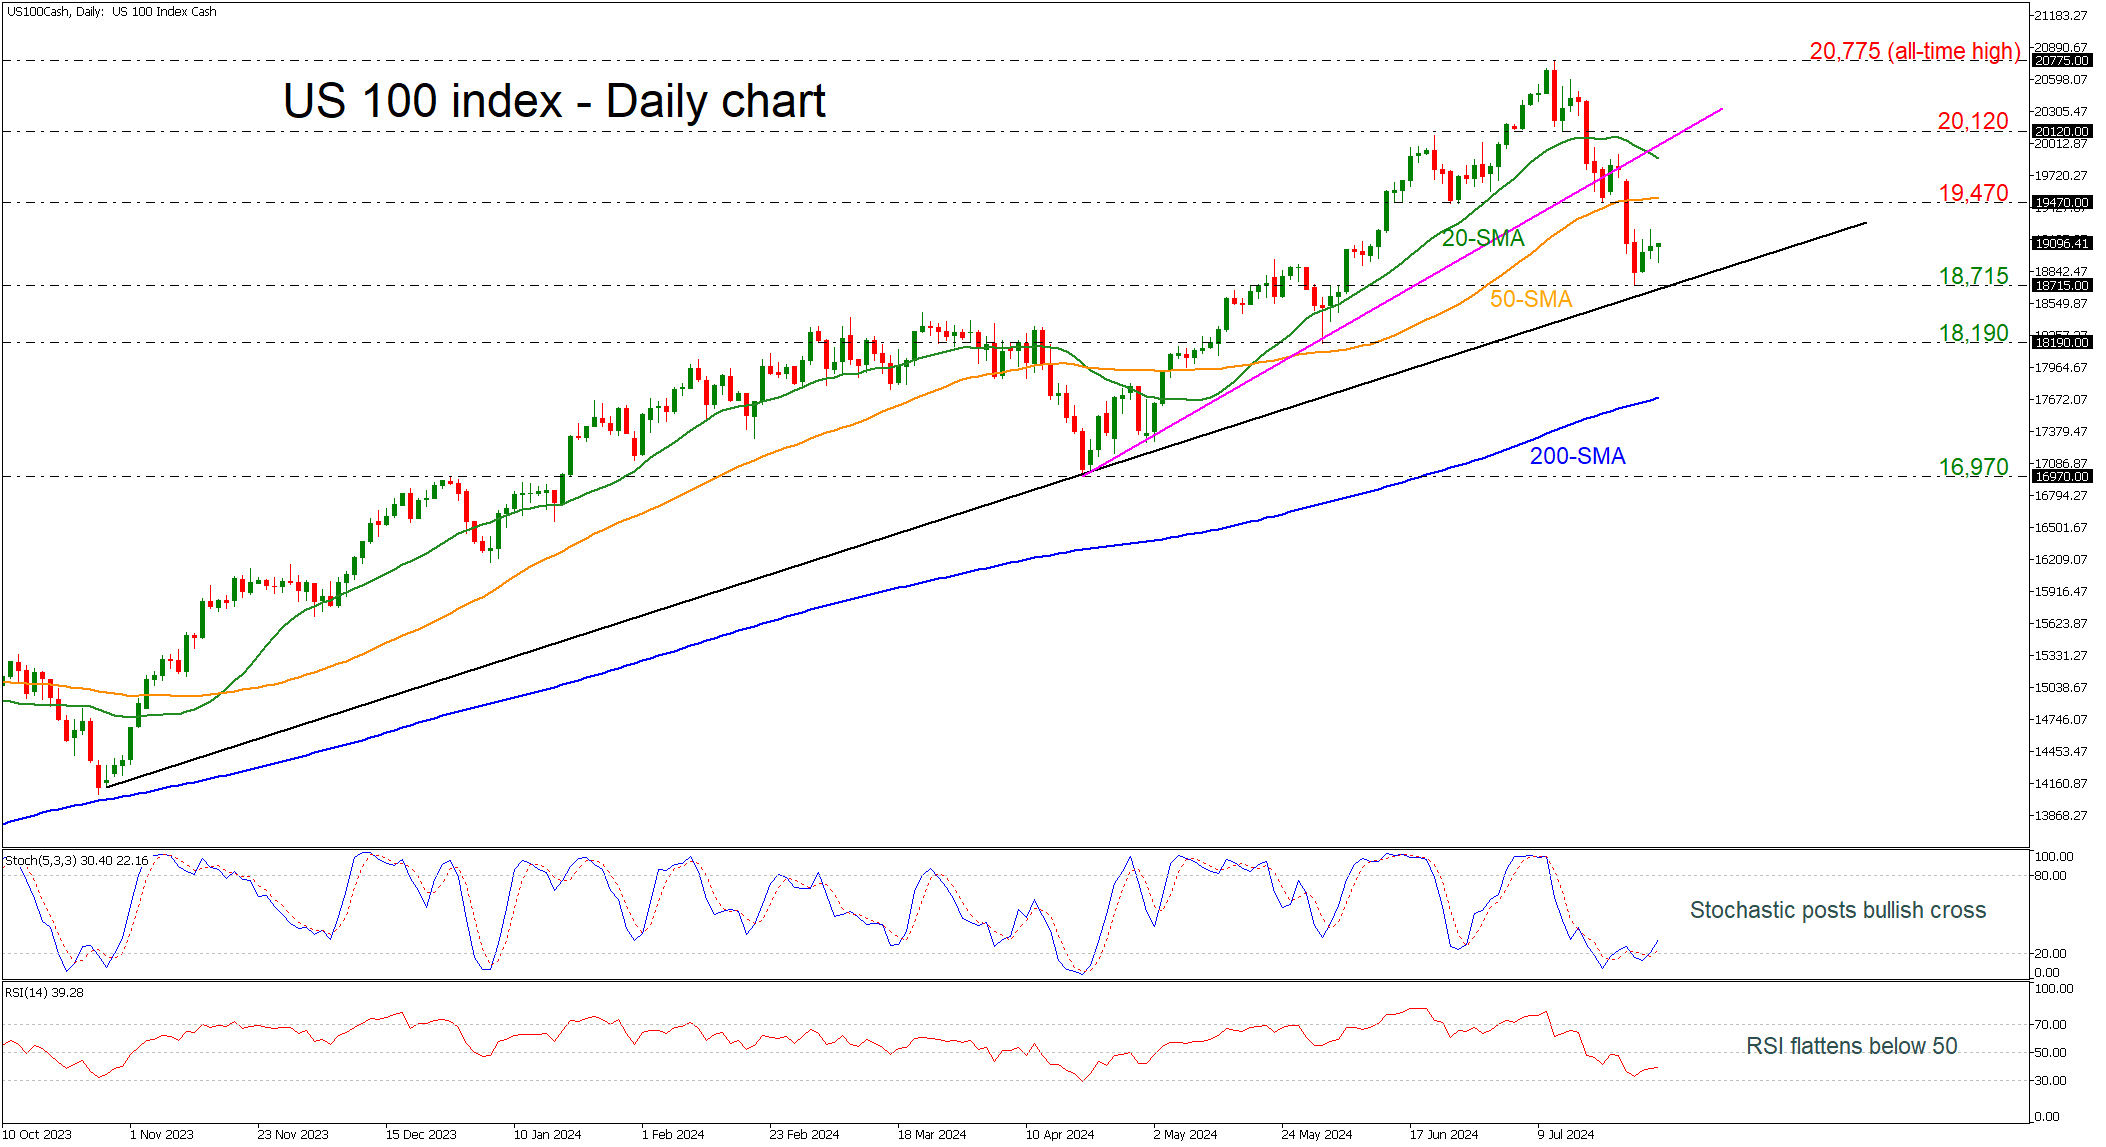
The US 100 (cash) index had a strong pullback off the 18,715 support, failing to extend its dive from the all-time high of 20,775 below the long-term ascending trend line.
Technically, the stochastic oscillator is moving up following the bullish crossover within its %K and %D lines in the oversold zone, while the RSI is ticking slightly up beneath the neutral threshold of 50. Also, the 20- and 50-day simple moving averages (SMAs) are heading down, approaching the current market price.
If traders continue to buy the index, then the 50-day SMA near 19,470 resistance would be the first obstacle to look for ahead of the 20-day SMA at 19,875. A break above this level would shift the short-term outlook back to positive, taking the price above the near-term uptrend line at 20,120.
In the event of a downside reversal and a closing session below the long-term ascending trend line, near the 18,715 support, could open the way for a downside tendency, hitting 18,190. A strong barrier, though, could be found at the 200-day SMA at 17,690.
In the bigger picture, the US 100 index is bullish as long as it holds above the 200-day SMA. If it violates this line, the bears would probably take the upper hand.
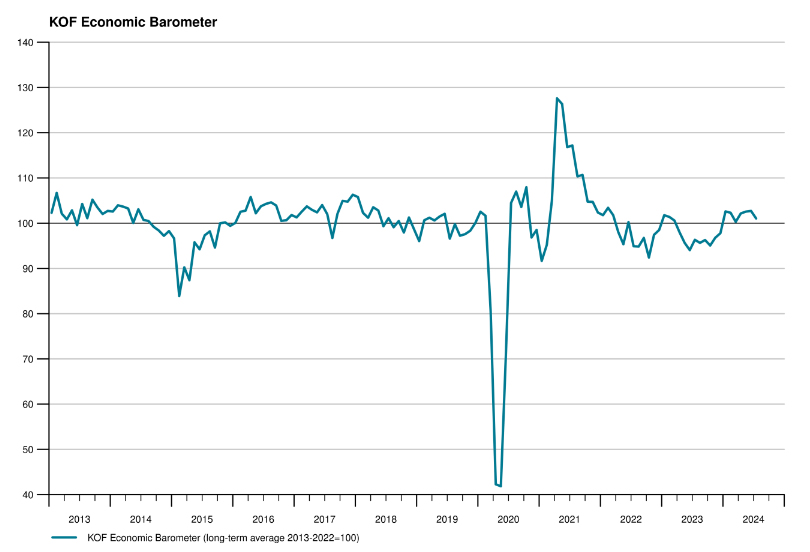
Swiss KOF falls to 101, signals moderate growth ahead
Swiss KOF Economic Barometer fell from 102.7 to 101.0 in July, missing the expected 102.6. This drop indicates that the Swiss economy is likely to continue growing at a "rather moderate pace" in the near future, according to KOF.
The decline, while not unanimous across all indicators, is "very widely visible". The outlook for both foreign and consumer demand is worsening. Moreover, sectors such as hospitality, construction, other services, and manufacturing showed negative developments. However, financial and insurance services sector bucked the trend, showing an increase and "resist the widespread downward tendency".
CADJPY: Trade of the Week
The Canadian Dollar (CAD) weakened on Monday as it lagged behind the strengthening US Dollar ahead of the Federal Reserve's rate decision. This week, the CAD is underrepresented on the economic calendar, making it susceptible to broader market movements and central bank appearances. Key data to watch includes Wednesday’s Canadian GDP for May, anticipated to slow to 0.1% MoM from April’s 0.3%. Additionally, Thursday's S&P Global Canadian Manufacturing PMI for June is expected to remain in contraction territory, below 50.0, as it has since May 2023. These factors will likely influence CAD's performance this week.
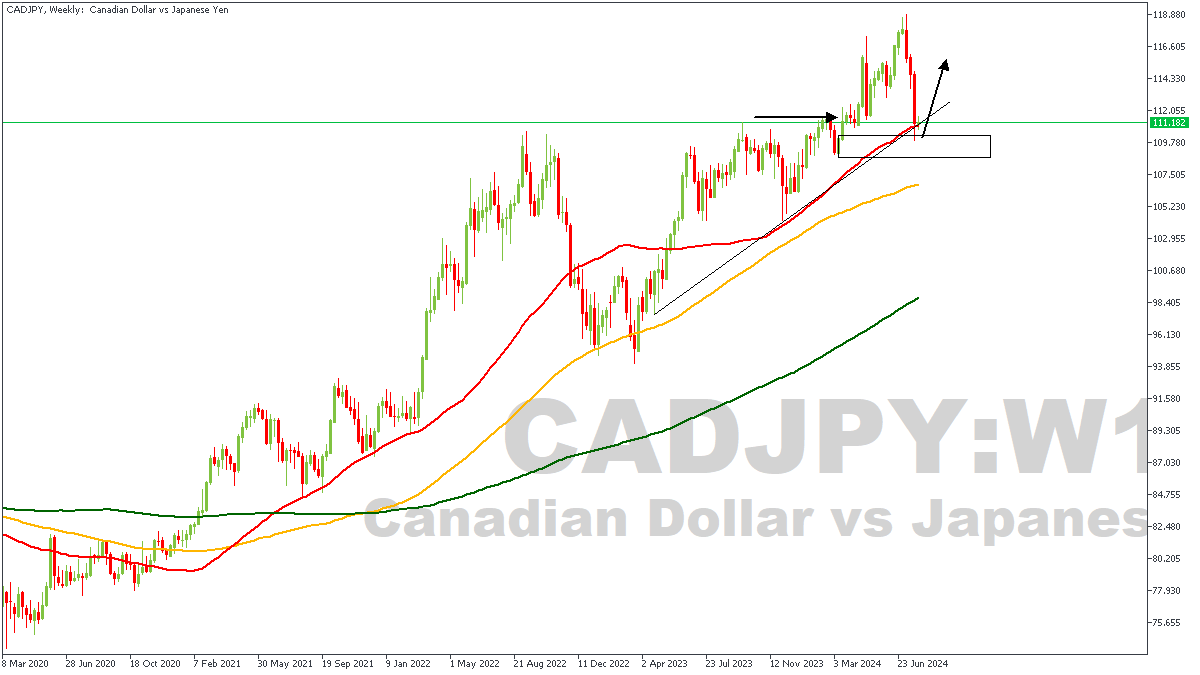
CADJPY – Weekly Timeframe
On the weekly timeframe of CADJPY, we see the price action is currently stalling around the 50-period moving average, while resting on a trendline support and a drop-base-rally demand zone. The bullish array of the moving averages can also be deduced clearly from the chart. Considering the break of structure at the highlighted horizontal arrow, I will be looking towards the lower timeframes for confirmation of a trade entry.
CADJPY – D1 Timeframe
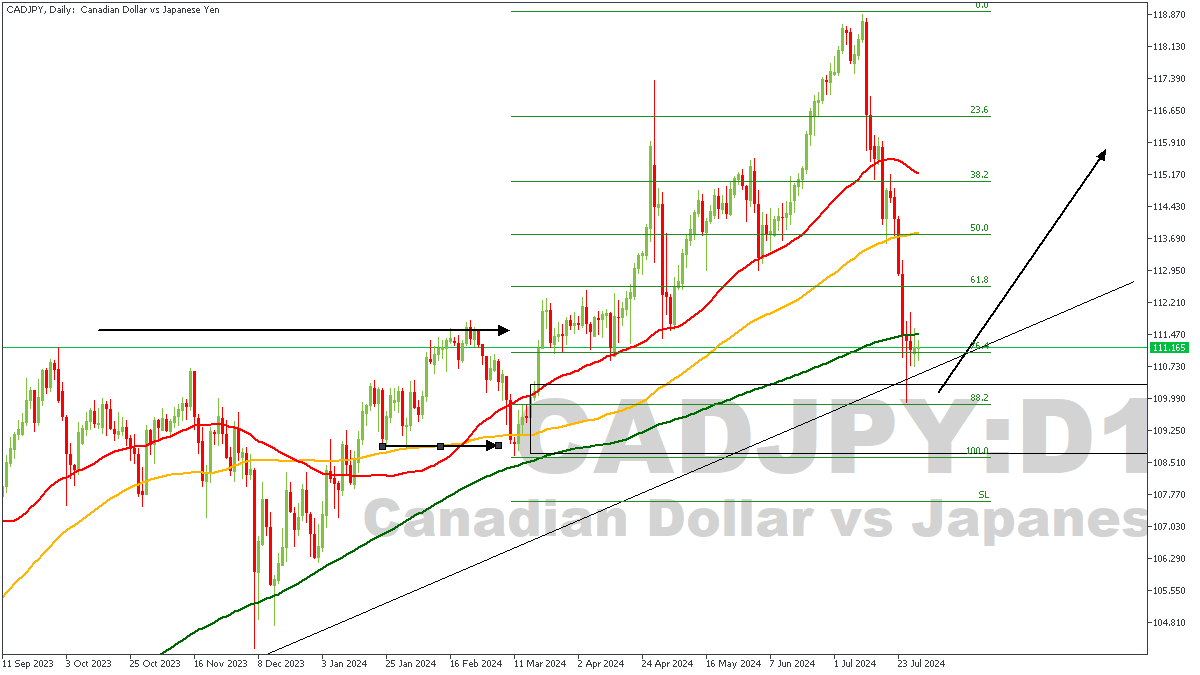
One beautiful pattern I can spot pretty easily on this daily timeframe chart of CADJPY is the SBR (Sweep-Break-Retest) price action pattern. This is based on the sweep below the low at the short horizontal arrow, then the break above the high at the long horizontal arrow. Considering that the 200-day moving average is also in play as a crucial support level, as well as the trendline, simply implies that price can be expected to make a big bounce from the demand zone soon.
Analyst’s Expectations:
- Direction: Bullish
- Target: 114.501
- Invalidation: 108.463