Sample Category Title
Market Analysis: AUD/USD Remains At Risk While NZD/USD Attempts Recovery
AUD/USD declined heavily from well above 0.6650. NZD/USD also tumbled and is now attempting a recovery from 0.5850.
Important Takeaways for AUD USD and NZD USD Analysis Today
- The Aussie Dollar started a major decline below the 0.6610 level against the US Dollar.
- There is a connecting bearish trend line forming with resistance near 0.6530 on the hourly chart of AUD/USD at FXOpen.
- NZD/USD is attempting a recovery wave from the 0.5850 zone.
- There was a break above a key bearish trend line with resistance at 0.5880 on the hourly chart of NZD/USD at FXOpen.
AUD/USD Technical Analysis
On the hourly chart of AUD/USD at FXOpen, the pair struggled to stay above the 0.6650 pivot zone. The Aussie Dollar started a fresh decline below the 0.6620 and 0.6600 levels against the US Dollar.
The pair even settled below the 0.6550 level and the 50-hour simple moving average. Finally, it tested the 0.6480 support zone. The recent low was formed near 0.6482 and the pair is now consolidating losses near the 23.6% Fib retracement level of the downward move from the 0.6562 swing high to the 0.6482 low.
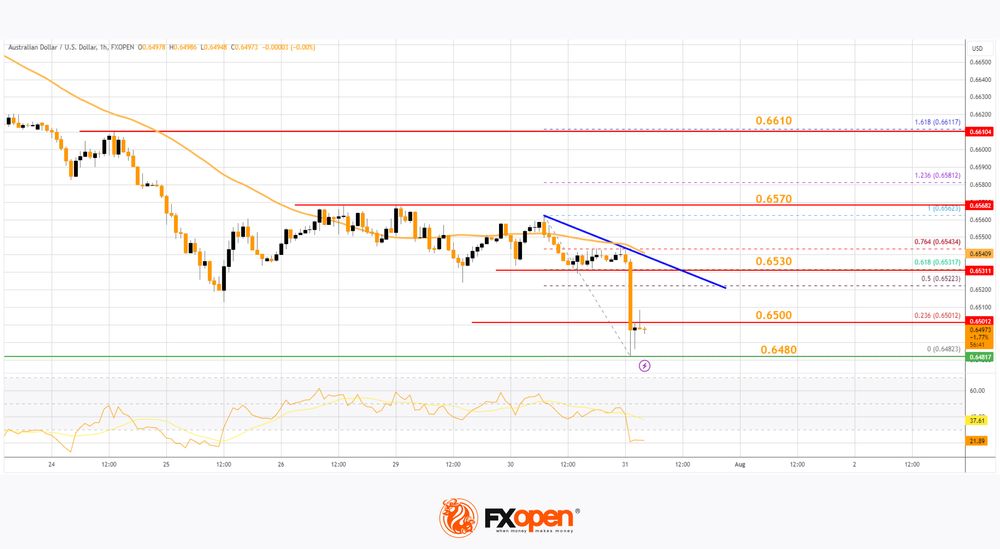
On the upside, the AUD/USD chart indicates that the pair is now facing resistance near a connecting bearish trend line at 0.6530. The trend line is near the 61.8% Fib retracement level of the downward move from the 0.6562 swing high to the 0.6482 low.
The first major resistance might be 0.65740. An upside break above the 0.6570 resistance might send the pair further higher. The next major resistance is near the 0.6610 level. Any more gains could clear the path for a move toward the 0.6660 resistance zone.
On the downside, initial support is near the 0.6480 zone. The next support could be the 0.6450 zone. If there is a downside break below the 0.6450 support, the pair could extend its decline toward 0.6415. Any more losses might signal a move toward 0.6365.
NZD/USD Technical Analysis
On the hourly chart of NZD/USD on FXOpen, the pair also declined heavily from well above the 0.6000 zone. The New Zealand Dollar even declined below 0.5915 against the US Dollar.
The pair tested the 0.5850 zone and recently started a recovery wave. There was a break above a key bearish trend line with resistance at 0.5880. The bulls pushed the pair above the 50% Fib retracement level of the downward move from the 0.5949 swing high to the 0.5857 low.
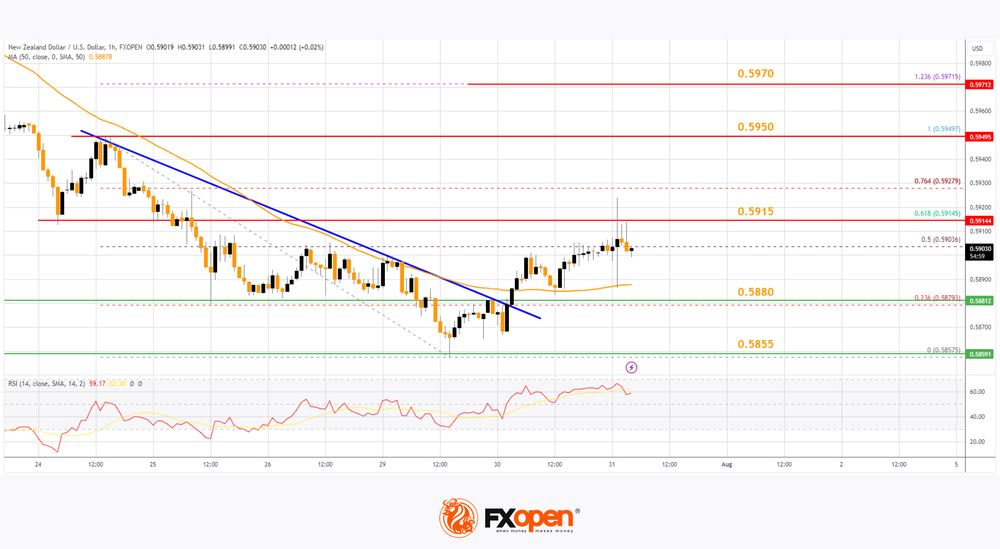
It settled above 0.5880 and the 50-hour simple moving average. The NZD/USD chart suggests that the RSI is still above 50 and signaling more upsides. On the upside, the pair might struggle near the 61.8% Fib retracement level of the downward move from the 0.5949 swing high to the 0.5857 low at 0.5915.
The next major resistance is near the 0.5950 level. A clear move above the 0.5950 level might even push the pair toward the 0.5970 level. Any more gains might clear the path for a move toward the 0.6000 resistance zone in the coming days.
On the downside, there is major support forming near the same trend line at 0.5880. The next major support is near 0.5855, below which the pair might test 0.5820.
If there is a downside break below the 0.5820 support, the pair might slide toward the 0.5765 support. Any more losses could lead NZD/USD in a bearish zone to 0.5740.
Trade over 50 forex markets 24 hours a day with FXOpen. Take advantage of low commissions, deep liquidity, and spreads from 0.0 pips. Open your FXOpen account now or learn more about trading forex with FXOpen.
This article represents the opinion of the Companies operating under the FXOpen brand only. It is not to be construed as an offer, solicitation, or recommendation with respect to products and services provided by the Companies operating under the FXOpen brand, nor is it to be considered financial advice.
Nasdaq Composite Index Reaches Key Support
Important news days are ahead, with high volatility likely in the US stock markets.
The Federal Open Market Committee (FOMC) will announce its monetary policy decision today at 21:00 GMT+3. Wall Street expects the FOMC to keep the rate unchanged at 5.25%. Traders will then analyse Fed Chair Jerome Powell's speech at 21:30 GMT+3 to assess the likelihood of a quarter-point rate cut in mid-September, as they anticipate.
In addition to this key news:
→ ADP will release its National Employment Report for July at 15:15 GMT+3 today. According to ForexFactory, analysts expect an increase of 146,000 jobs (excluding the agricultural sector) for the month.
→ The Institute for Supply Management will publish its Chicago Business Barometer for July today. The National Association of Realtors will release real estate market news.
→ Major companies are reporting their second-quarter results, including Meta (report due on 31 July), Apple, and Amazon (1 August).
Given that the Nasdaq Composite Index (US Tech 100 mini on FXOpen) has fallen more than 8% since 11 July, market participants might be wary of the downward trend continuing. However, the chart offers some hope for bulls.
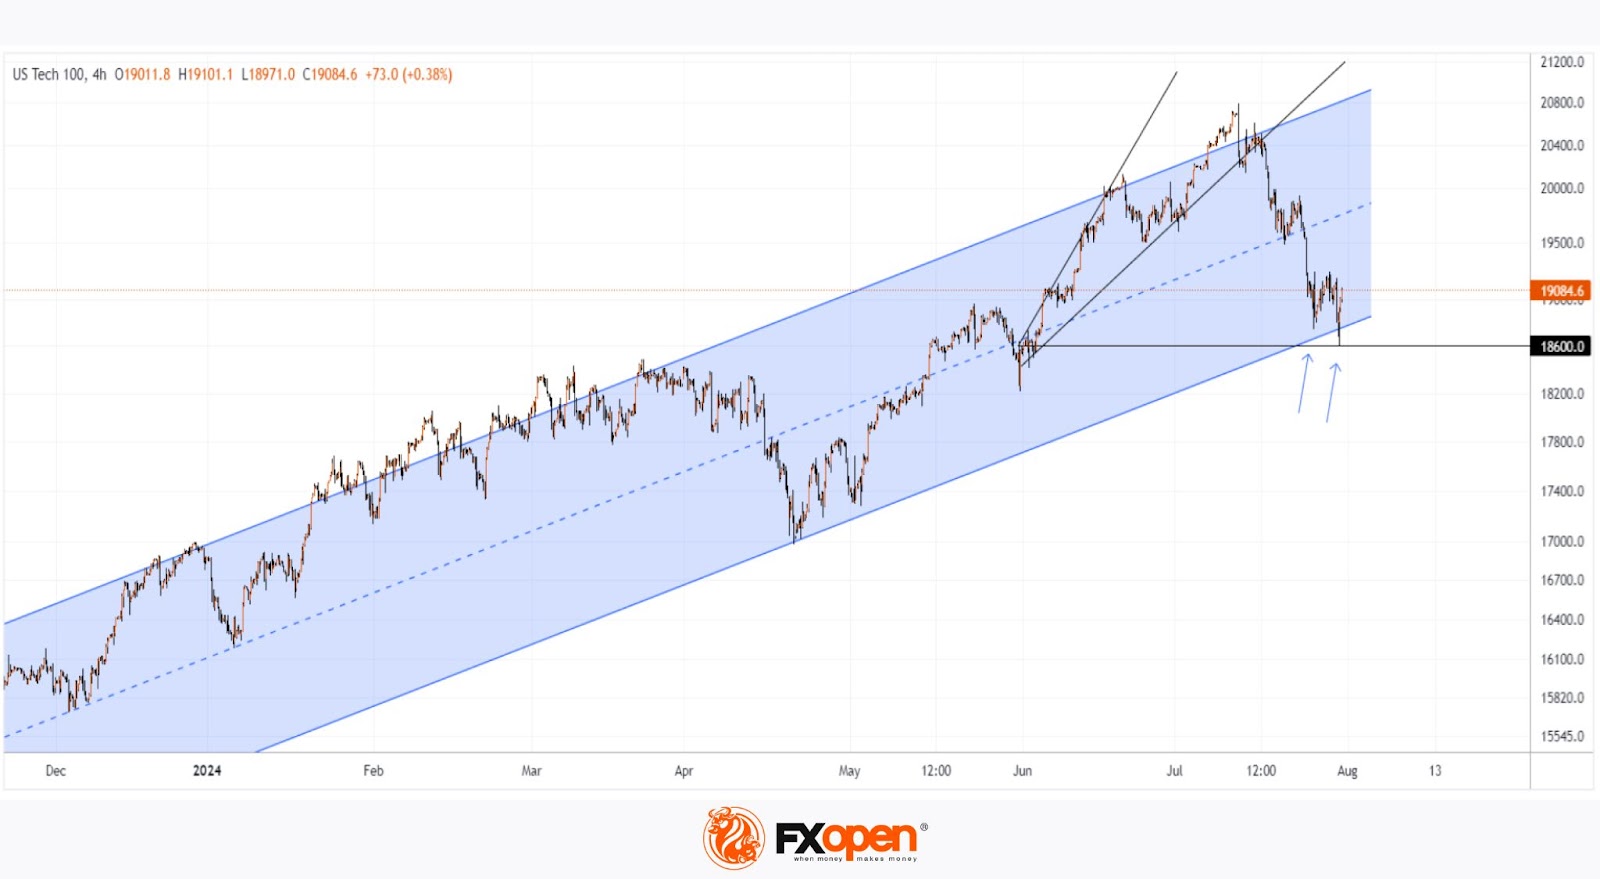
According to technical analysis of the Nasdaq Composite Index (US Tech 100 mini on FXOpen):
→ The price is near the lower boundary of the ascending channel (shown in blue), which may act as support.
→ The price is close to the 18,600 level, from which the rally to historical highs began (shown with black lines). Bulls might draw strength from this level.
→ The chart shows two lows (indicated with arrows). On the second low, the price broke the first and sharply recovered, indicating aggressive demand. Adding almost any oscillator to the chart would show a bullish divergence.
In the best-case scenario for investors, the upcoming events might halt the negative trend of the second half of July, and the Nasdaq Composite (US Tech 100 mini on FXOpen) might even attempt to resume the uptrend within the blue channel (as seen in April-May).
Trade global index CFDs with zero commission and tight spreads. Open your FXOpen account now or learn more about trading index CFDs with FXOpen.
This article represents the opinion of the Companies operating under the FXOpen brand only. It is not to be construed as an offer, solicitation, or recommendation with respect to products and services provided by the Companies operating under the FXOpen brand, nor is it to be considered financial advice.
Both US Yields and Dollar Trade Little Changed Ahead of Some Key Data
Markets
After a series of mixed European GDP and inflation numbers, some US data hit the market yesterday in late afternoon trading too. June JOLTS job openings were at a higher-than-expected 8.18m, down from an upwardly revised 8.23m. Consumer confidence in the Conference Board indicator picked up from 97.8 to 100.3 in July with an improvement in the expectations component offsetting a drop in the assessment of the present situation to the lowest since mid-2021. After some intraday volatility, yields nevertheless ended the day lower. Geopolitical concerns took the upper hand in late US dealings amid reports of Israel having conducted a Hezbollah-aimed retaliatory strike near Lebanon’s capital Beirut. Net daily changes in US yields varied between -2.9 and -4.2 bps. German yields followed by -0.7 and -4.2 bps. Tech sold off again in equity markets, lowering the Nasdaq by some 1.3%. The dollar didn’t take up its safe haven role (e.g. EUR/USD only marginally lower at 1.0815) but the yen did. USD/JPY’s close at 152.77 was the lowest since mid-April. JPY extended gains this morning going into an important BoJ meeting before paring them again (see below). Other market moves take place in Aussie markets (cfr. infra). Asian equity markets shrug off geopolitics by rising up to 3% in China. Both US yields and the dollar trade little changed ahead of some key data, including the ADP job report (expected job growth of 150k) and the Employment Cost Index (+1% in Q2), and the FOMC policy meeting later today. The Fed’s status quo at 5.25-5.5% is widely anticipated. The central question is whether the recent string of beneficial CPI outcomes and mostly below-consensus economic outcomes will prompt clearer clues towards a first cut (in September) in either the statement or the presser. We think there’s a possibility of that to happen, be it subtle in order to prevent the recent sharp yield correction go much further against the background of thinner liquidity circumstances and the risk of a technical acceleration should first support zones in the likes of the US 10-yr break. Complementing the case for (short-term) yields not to drop much lower from current levels is the current pricing in money markets (almost three cuts priced in for 2024). The four cuts for 2025, as things currently stand, seem appropriate as well. First support for the dollar kicks in at EUR/USD 1.09. That should hold.
News & Views
The Australian dollar and swap yields are under pressure this morning. AUD/USD is testing the 0.65 support zone, down from a 0.654 open. Australian swap yields tumble between 11.9 and 19 bps across the curve, the front outperforming. These sharp moves follow the release of Q2 CPI figures. They were bang in line on a headline level, 1% q/q and 3.8% y/y with the latter even quickening from the 3.6% in Q1. Core gauges, though, decelerated more than expected. Advancing 0.8% on a quarterly basis, the yearly prints eased from 4% to 3.9% and 4.4% to 4.1%, depending on the gauge. While still above the Reserve Bank of Australia’s 2-3% target range, the sizeable market moves comes amid speculation the central bank was closer to tightening policy further short term on stubborn inflation rather than easing. It was the RBA itself that as recently as June flagged the possibility of doing so. Today’s data wipe out all such market bets for the upcoming meetings. A rate cut isn’t expected at next week’s though with a full 25 bps move priced in for February 2025 currently.
The Bank of Japan surprised some in the market by raising the policy rate from a range of 0-0.1% to “around” 0.25%. The decision follows as economic activity and prices have been developing generally in line with the BoJ’s outlook, adding that moves to raise wages have been spreading across regions, industries and firm sizes. The hike came against the background of new forecasts, which entailed a minor growth downgrade for the current FY (0.6%) while leaving forecasts for the next two years unchanged at 1%. Core inflation (ex fresh food) was seen lower this FY at 2.5% (from 2.8%) but was tilted to 2.1% for the FY to March 2026 (unchanged at 1.9% for the FY thereafter). The BoJ said that if this outlook materializes, it will further raise the (still accommodative) policy rate. The central bank also announced to taper its monthly bond buying purchases by JPY 400 bn (from JPY 6000 bn now) each calendar quarter with an interim assessment scheduled April 2026. By then, the bank’s balance sheet is seen to have shrunk by about 7-8%. That’s slightly softer than markets expected, which was the buying pace cut in half in tops 1.5 years time. The yen whipsawed on the BoJ outcome before trading back to opening levels of USD/JPY 152.8. Japanese yields to jump an unusually big 2-7 bps across the curve, the front underperforming.
Graphs
GE 10y yield
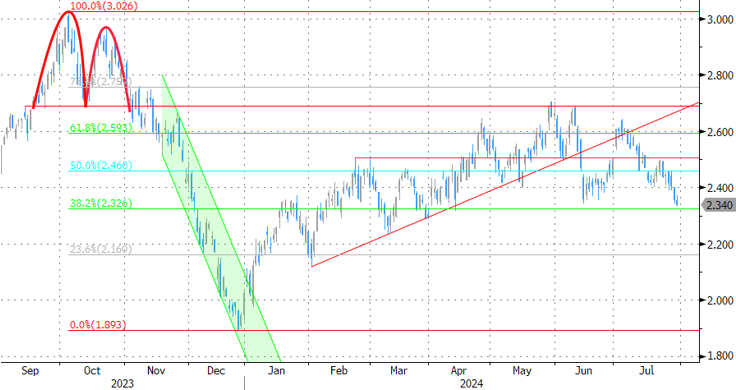
The ECB cut its key policy rates by 25 bps at the June policy meeting. A more bumpy inflation path in H2 2024, the EMU economy gradually regaining traction and the Fed’s higher for longer US strategy make follow-up moves difficult. Markets are coming to terms with that. Disappointing US and unconvincing EMU data, however, for now brings yields back to their post-French snap election low. The 2.34%-2.4% support zone is being revisited but looks solid.
US 10y yield
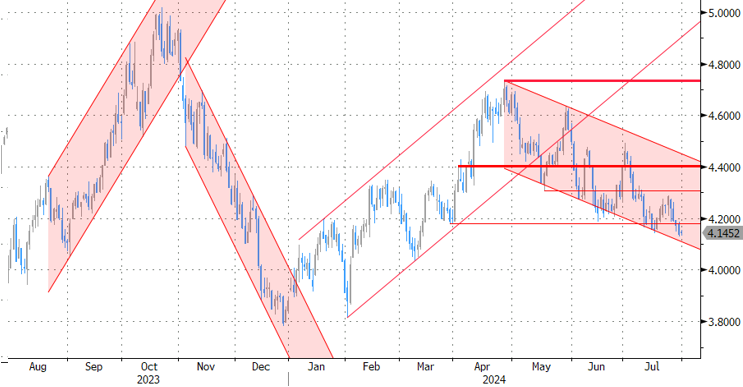
The Fed indicated that it needs more evidence to lower its policy rate. June dots suggested one move in 2024 and four next year. Disappointing ISM and back-to-back downward CPI surprises put the US money market back on more than two rate cuts this year (September/December). The US 10-yr yield tests the recent lows and the downside of the downward trend channel in the 4.2% area.
EUR/USD
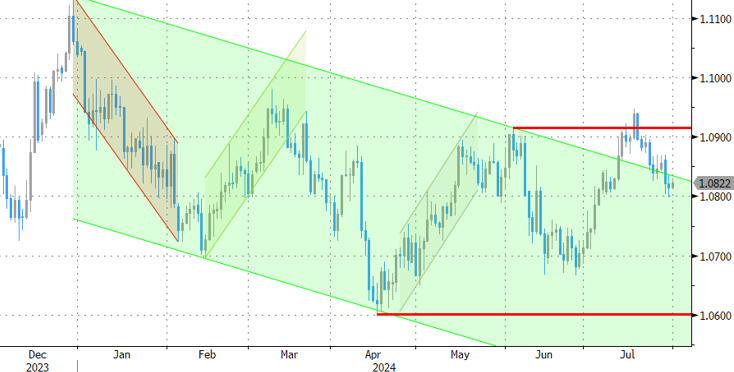
EUR/USD tested the topside of the 1.06-1.09 range as the dollar lost interest rate support at stealth pace. Markets consider a September rate cut a done deal and only need confirmation from high-ranked Fed officials. In the meantime, the euro got rid of the (French) political risk premium. EUR/USD recently evolved back to a more neutral positioning but is holding up rather well despite ongoing poor EMU data.
EUR/GBP
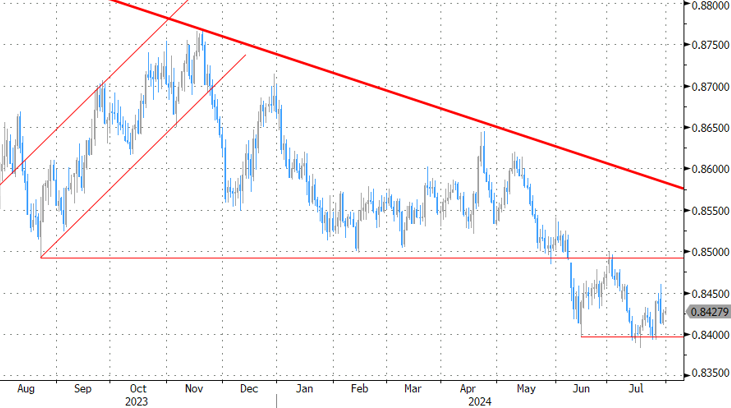
Debate at the BoE is focused at the timing of rate cuts. May & June headline inflation returned to 2%, but core measures do not align a sustainable return to target soon. Some BoE members at the June meeting nevertheless appeared moving closer to a rate cut. Labour revealed a near £22bn of unfunded commitments, setting the stage for a painful Budget release on October 30. EUR/GBP 0.84 support is being tested.
EUR/USD Daily Outlook
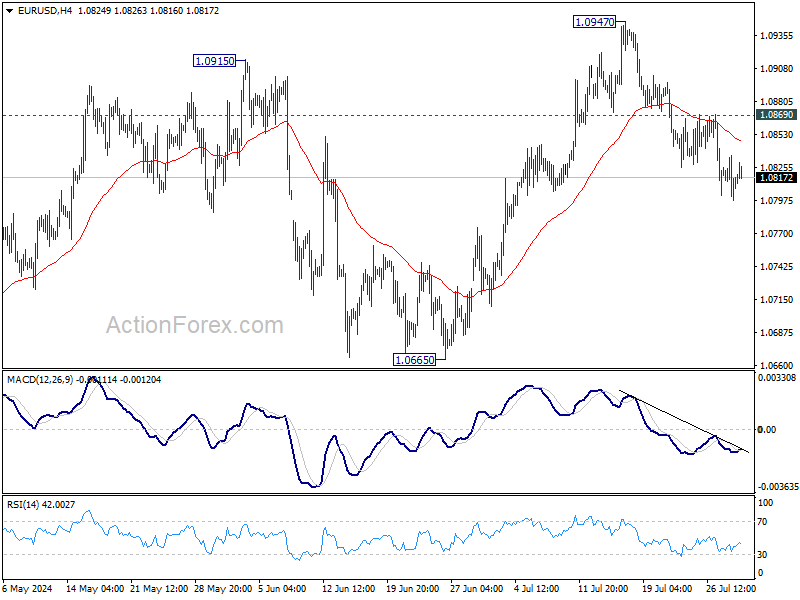
Daily Pivots: (S1) 1.0797; (P) 1.0816; (R1) 1.0835; More.....
Further decline is expected in EUR/USD with 1.0869 resistance intact. Sustained break of 55 D EMA (now at 1.0815) will argue that whole rebound from 1.0601 has completed with three waves up to 1.0947. Deeper decline should then be seen to 1.0601/0665 support zone next. Nevertheless, break of 1.0869 minor resistance will bring retest of 1.0947 instead.
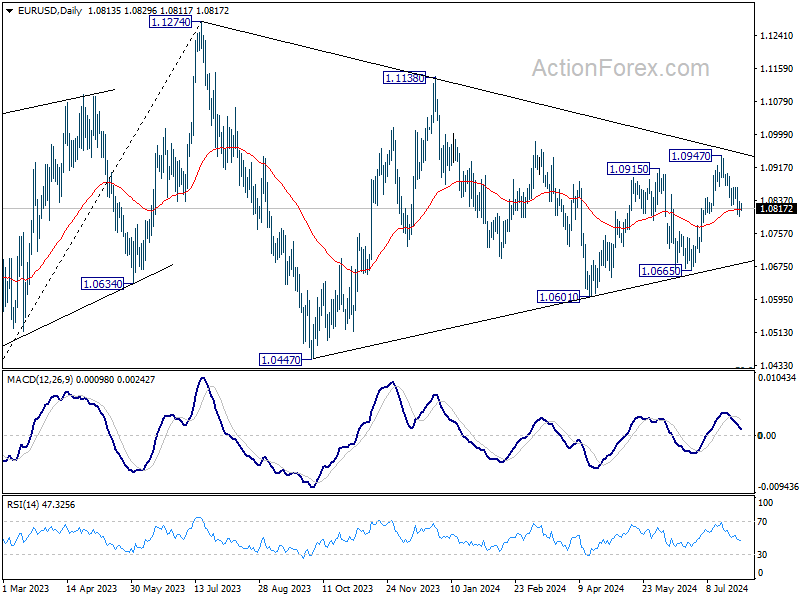
In the bigger picture, price actions from 1.1274 are viewed as a corrective pattern that's still be in progress. Break of 1.1138 resistance will be the first signal that rise from 0.9534 (2022 low) is ready to resume through 1.1274 (2023 high). However, break of 1.0665 support will extend the correction with another falling leg back towards 1.0447 support.
GBP/USD Daily Outlook
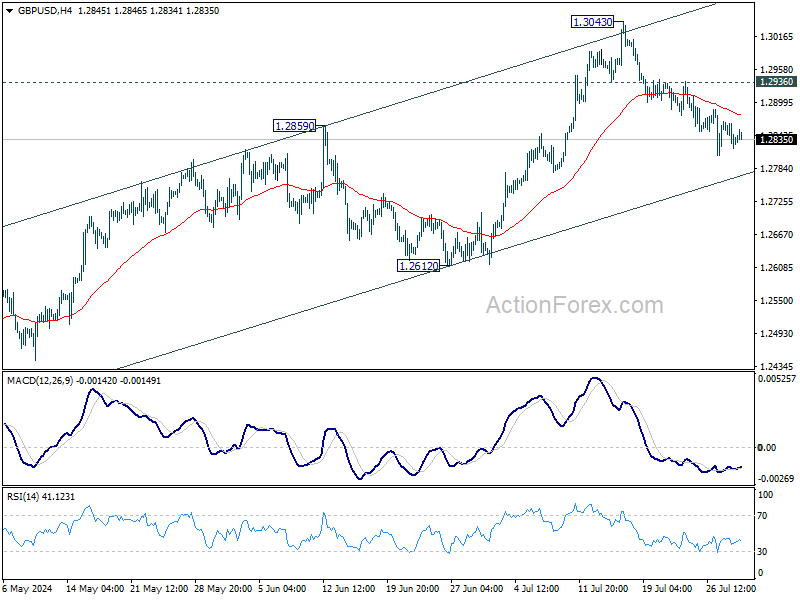
Daily Pivots: (S1) 1.2815; (P) 1.2841; (R1) 1.2863; More...
Further decline is expected in GBP/USD as long as 1.2936 resistance holds. Decisive break of 55 D EMA (now at 1.2781) will suggest that rise from 1.2298 has completed with three waves up to 1.3043. Deeper fall would be seen to 1.2612 support and below. On the upside, above 1.2936 resistance will bring retest of 1.3043 resistance instead.
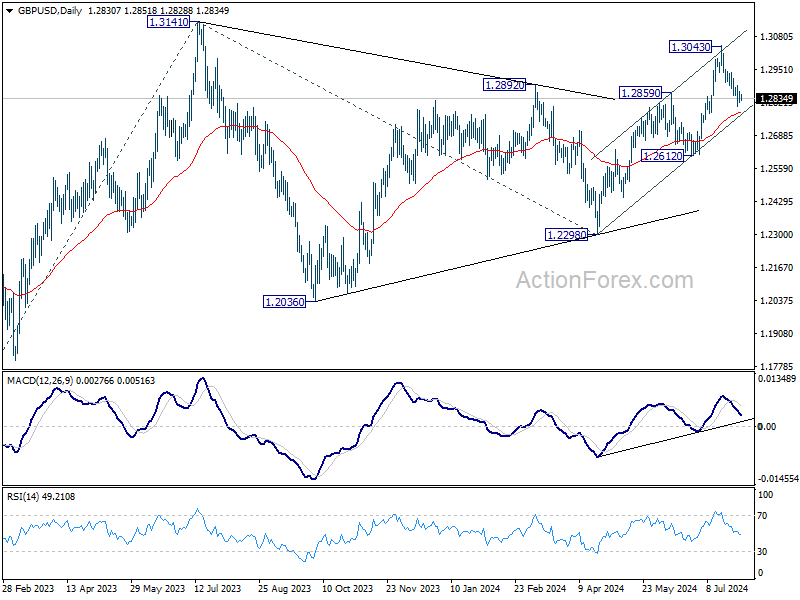
In the bigger picture, corrective pattern from 1.3141 medium term top (2023 high) could have completed with three waves to 1.2298 already. This will now remain the favored case as long as 1.2612 support holds. Firm break of 1.3141 will target 61.8% projection of 1.0351 (2022 low) to 1.3141 from 1.2298 at 1.4022. However, break of 1.2612 support argue that this corrective pattern is extending with another falling leg.
USD/JPY Daily Outlook
Daily Pivots: (S1) 151.86; (P) 153.54; (R1) 154.43; More...
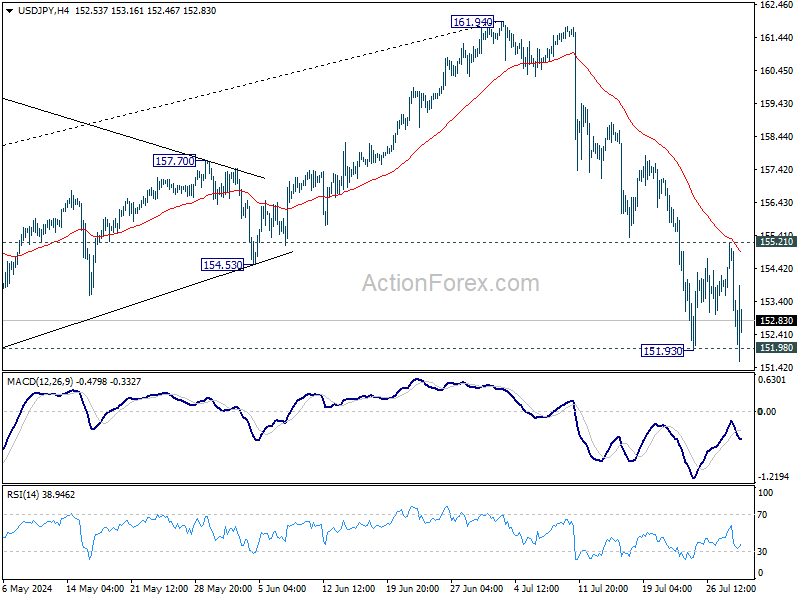
Intraday bias in USD/JPY is back on the downside with breach of 151.93 temporary low. decisive break of 151.89 resistance turned support will argue that large scale correction is underway to 148.66 fibonacci level. On the upside, break of 155.21 resistance will mix up the outlook and turn intraday bias neutral first.
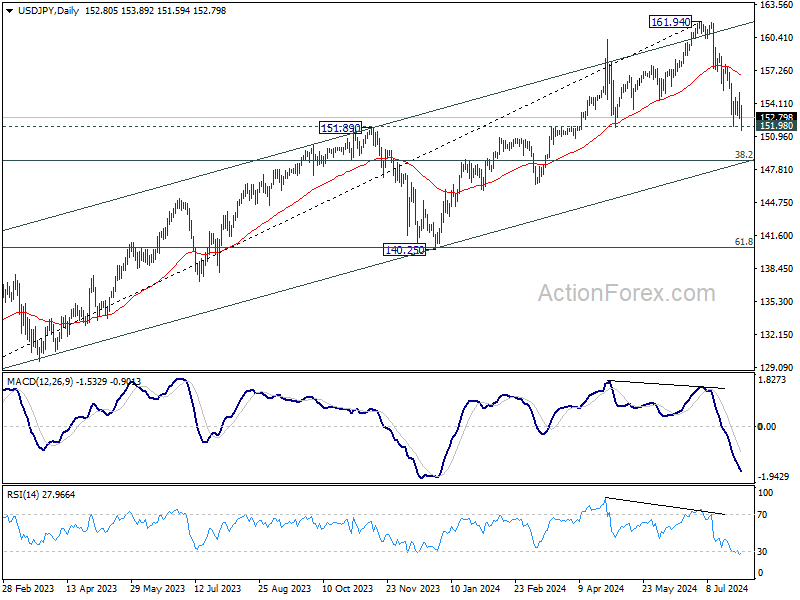
In the bigger picture, considering the depth and momentum of the current decline, 161.94 should be a medium term top already. Fall from there is seen as correcting the whole rise from 127.20 (2023 low) at least. Break of 151.89 will pave the way to 38.2% retracement of 127.20 to 161.94 at 148.66. Risk will now stay on the downside as long as 55 D EMA (now at 157.06) holds, in case of rebound.
USD/CHF Daily Outlook
Daily Pivots: (S1) 0.8810; (P) 0.8843; (R1) 0.8860; More…
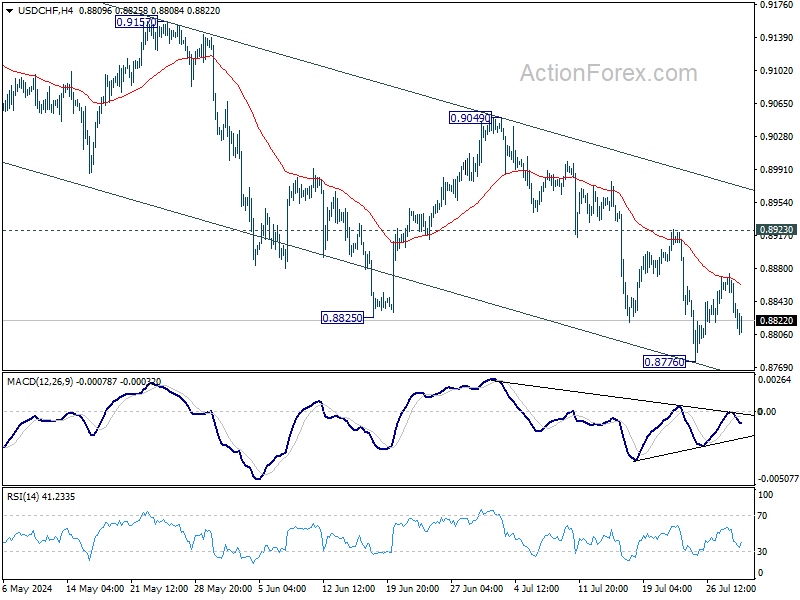
Intraday bias in USD/CHF remains neutral as consolidation from 0.8776 is still in progress. Further decline is expected as long as 0.8923 resistance holds. On the downside, break of 0.8776 will resume the fall from 0.9223 to 61.8% retracement of 0.8332 to 0.9223 at 0.8672 next. However, break of 0.8923 will turn bias back to the upside for stronger rebound instead.
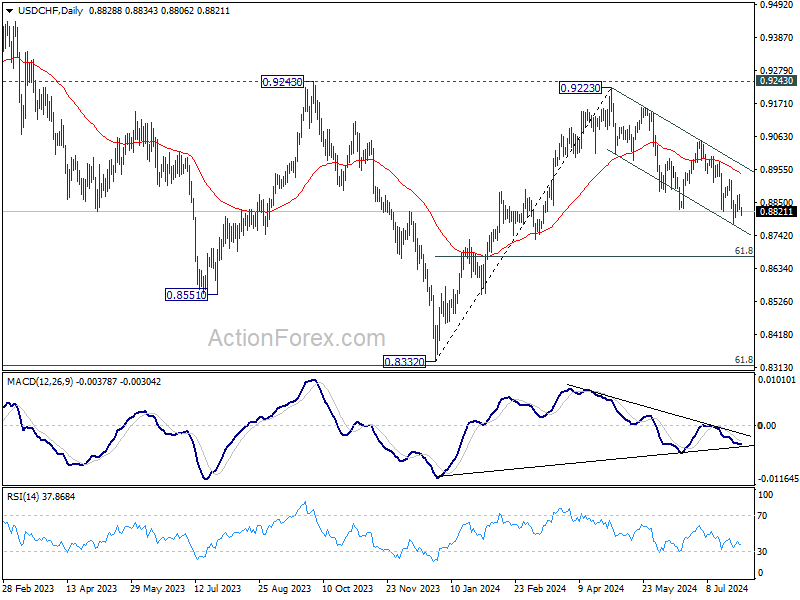
In the bigger picture, with 0.9243 resistance intact, medium term outlook in USD/CHF is neutral at best. For now, more sideway trading is likely between 0.8332/9243. However, firm break of 0.9243 will indicate larger bullish trend reversal.
AUD/USD Daily Report
Daily Pivots: (S1) 0.6523; (P) 0.6543; (R1) 0.6556; More...
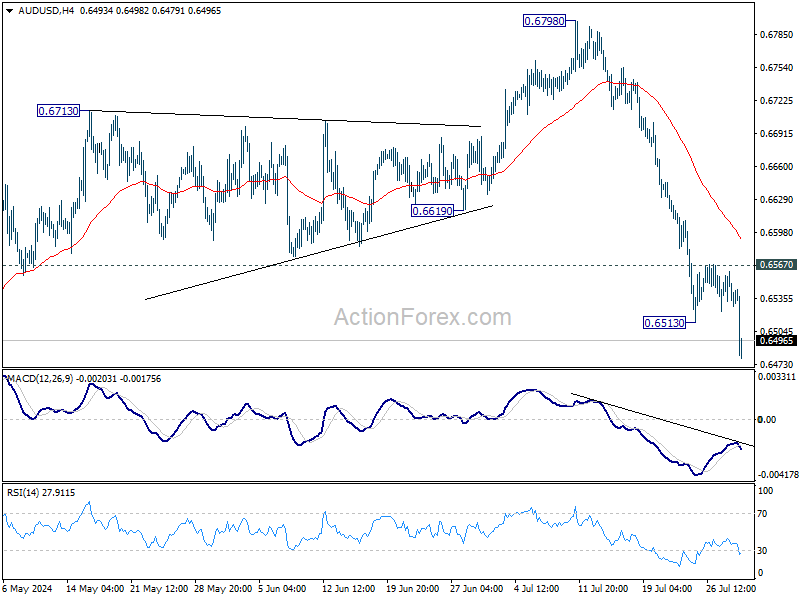
AUD/USD's fall from 0.6798 resumes today and hits as low as 0.6479 so far. Intraday bias is back on the downside for 0.6361 support first. Firm break there will target 0.6269 low. On the upside though, above 0.6567 resistance will turn intraday bias neutral first.
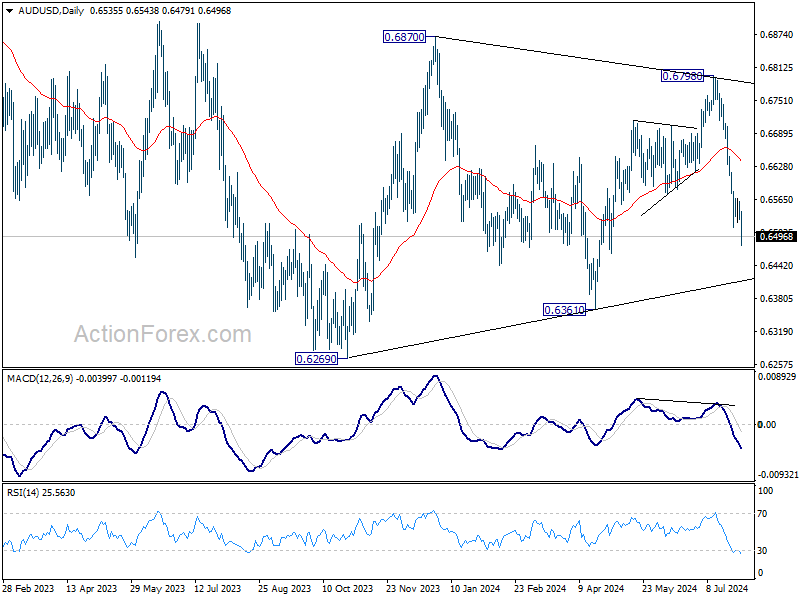
In the bigger picture, overall, price actions from 0.6169 (2022 low) are seen as a medium term corrective pattern, with fall from 0.6798 as another falling leg. Deeper fall could be seen to the lower side of the range between 0.6169/6361. But strong support should be seen there to contain downside. For now, risk will stay on the downside as long as 0.6798 resistance holds, in case of rebound.
USD/CAD Daily Outlook
Daily Pivots: (S1) 1.3837; (P) 1.3851; (R1) 1.3864; More...
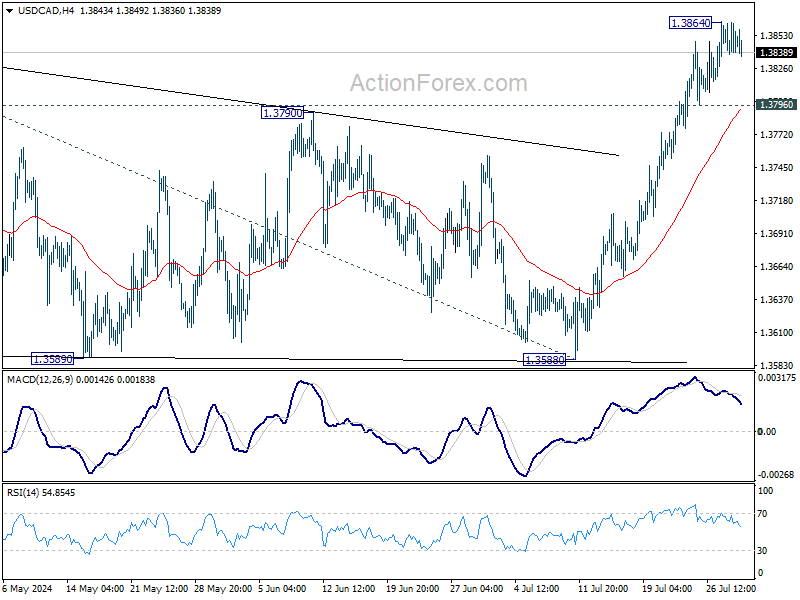
A temporary top is in place with current retreat and intraday bias in USD/CAD is turned neutral first. Further rally is expected as long as 1.3796 support holds. Rise from 1.3176 should be resuming and next target is 61.8% projection of 1.3176 to 1.3845 from 1.3588 at 1.4025. On the downside, below 1.3796 minor support will delay the bullish case and bring deeper pullback first.
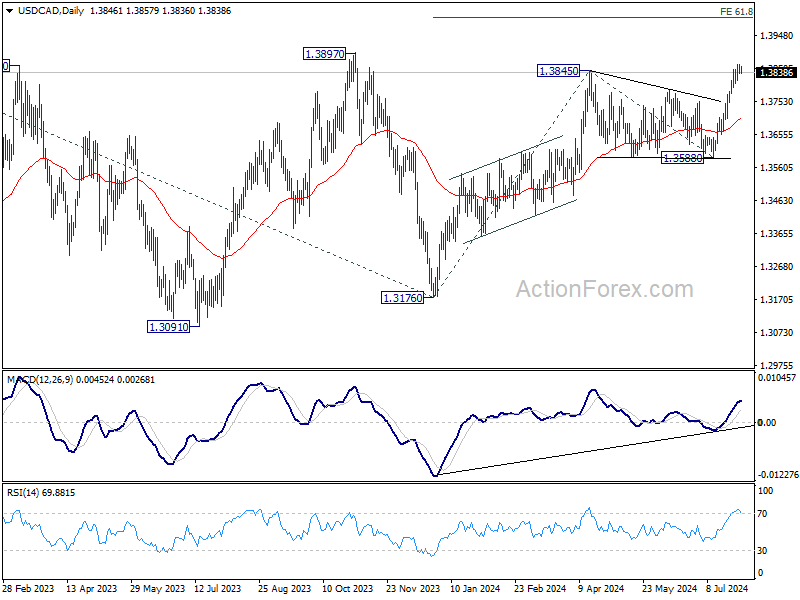
In the bigger picture, price actions from 1.3976 (2022 high) are viewed as a corrective pattern, that might have completed at 1.3176 (2023 low) already. Firm break of 1.3976 will confirm resumption of whole up trend from 1.2005 (2021 low). Next target is 61.8% projection of 1.2401 to 1.3976 from 1.3176 at 1.4149. This will be the favored case as long as 1.3588 support holds, in case of pullback.
EUR/CHF Daily Outlook
Daily Pivots: (S1) 0.9526; (P) 0.9566; (R1) 0.9587; More....
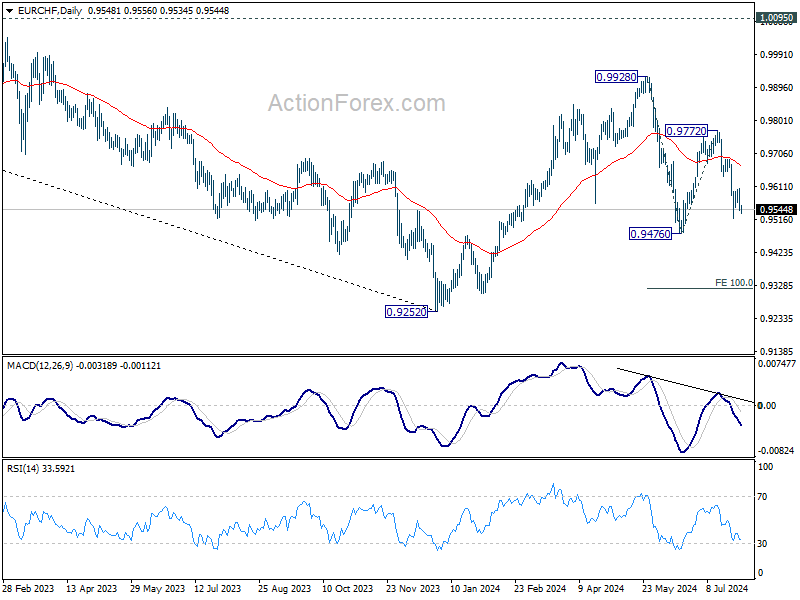
Intraday bias in EUR/CHF remains neutral and outlook is unchanged. While more consolidations could be seen, further decline is expected as long as 0.9641 support turned resistance holds. Rebound from 0.9476 should have completed as a corrective move at 0.9772. Below 0.9519 will bring retest of 0.9476. Firm break there will resume whole fall from 0.9928 to 100% projection of 0.9928 to 0.94767 from 0.9772 at 0.9320.
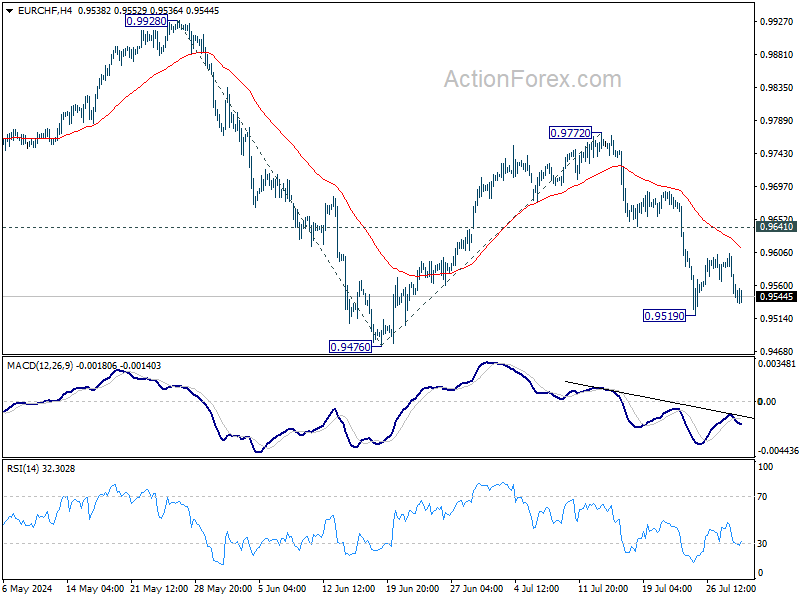
In the bigger picture, with 1.0095 key medium term resistance intact, price actions from 0.9252 (2023 low) are seen as a corrective pattern. Fall from 0.9928 might be the second leg and break of 0.9476 would bring deeper decline to retest 0.9252 low. But strong support should be seen there to extend the corrective pattern with another rising leg. In any case, medium term outlook will be neutral at best as long as 1.0095 structural resistance holds.