Sample Category Title
Canadian GDP grows by 0.2% mom in May, exceeds expectations
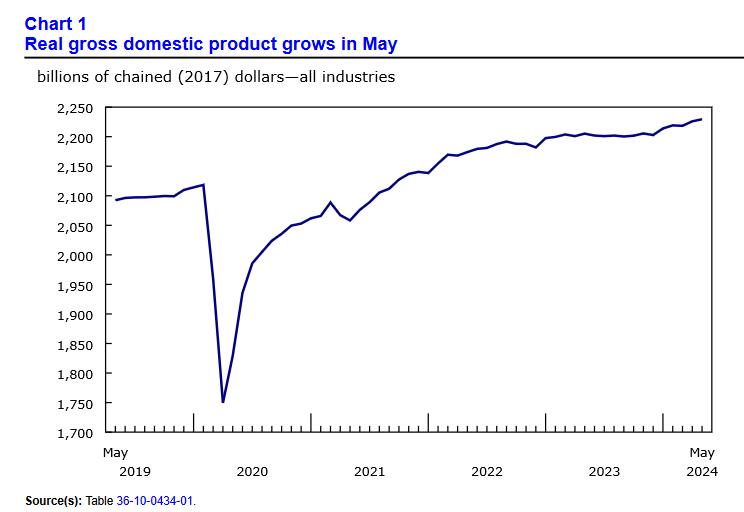
Canada's GDP grew by 0.2% mom in May, surpassing the expected 0.1% mom growth. The primary driver of this growth was the goods-producing industries, which saw a 0.4% increase with four out of five sectors expanding. The services-producing industries also contributed, albeit modestly, with a 0.1% rise. Overall, 15 out of 20 sectors experienced growth.
Advance information suggests that real GDP increased by 0.1% mom in June. Gains in construction, real estate and rental and leasing, and finance and insurance were partially offset by declines in manufacturing and wholesale trade.
US ADP employment grows only 122k, wages growth slows further
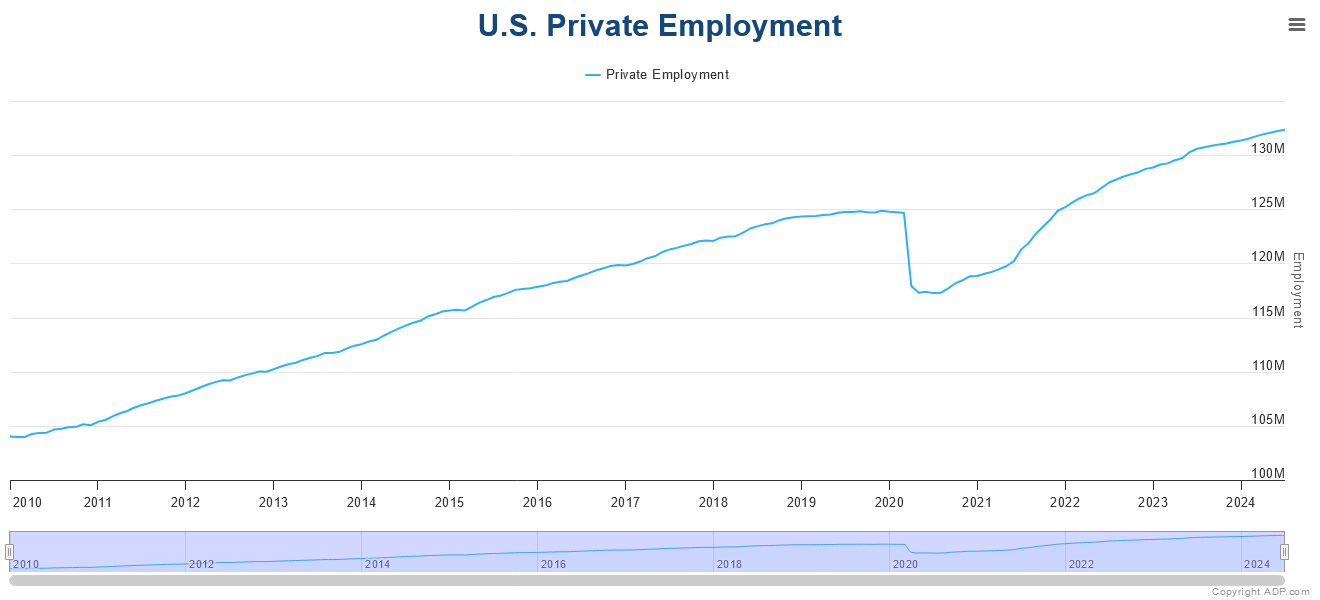
In July, US ADP private employment grew by 122k, significantly below the expected 166k. Breaking it down by sector, goods-producing jobs increased by 37k, while service-providing jobs rose by 85k. By establishment size, small companies lost -7,000k, medium-sized companies added 70k jobs, and large companies added 62k jobs.
Annual pay gains for job-stayers slowed to 4.8% yoy, the lowest rate in three years. Annual pay growth for job-changers also dropped significantly from 7.7% yoy to 5.2% yoy.
Nela Richardson, chief economist at ADP, commented, "With wage growth abating, the labor market is playing along with the Federal Reserve's effort to slow inflation. If inflation goes back up, it won't be because of labor."
Gold, Crude Oil Prices Soar on Rising Middle East Tensions, FOMC Next
- Gold and oil prices have surged due to rising tensions in the Middle East.
- Gold with a trendline break as bulls eye $2480/oz, FOMC meeting next.
- Brent crude oil found support around the 78.00 handle and is currently trading at 80.82 a barrel, with potential for further upside due to geopolitical risks.
Gold and oil have both surged due to rising tensions in the Middle East, which began during the US session yesterday. An airstrike on Lebanon followed by an airstrike on Tehran targeting senior Hamas leader Ismail Haniyeh has significantly increased safe haven demand.
These events set the stage for an interesting few days from a geopolitical standpoint, with tensions expected to escalate as Iran’s incoming President, Masoud Pezeshkian, is anticipated to respond.
World leaders have already called for calm amid growing fears of regional spillover, which could have widespread consequences. Any hope for a ceasefire will likely be sidelined, leading to increased safe haven demand flows, with gold and potentially the US dollar benefitting.
As the US session approaches and with the FOMC meeting scheduled later in the day, markets may calm down. This could lead to some consolidation and potentially a pause in the recent rally in gold and oil prices.
Surprisingly, despite benefiting from safe haven demand on Monday, the US dollar has struggled this morning. This could be due to market participants’ apprehension ahead of the FOMC meeting.
Brent Crude Technical Outlook
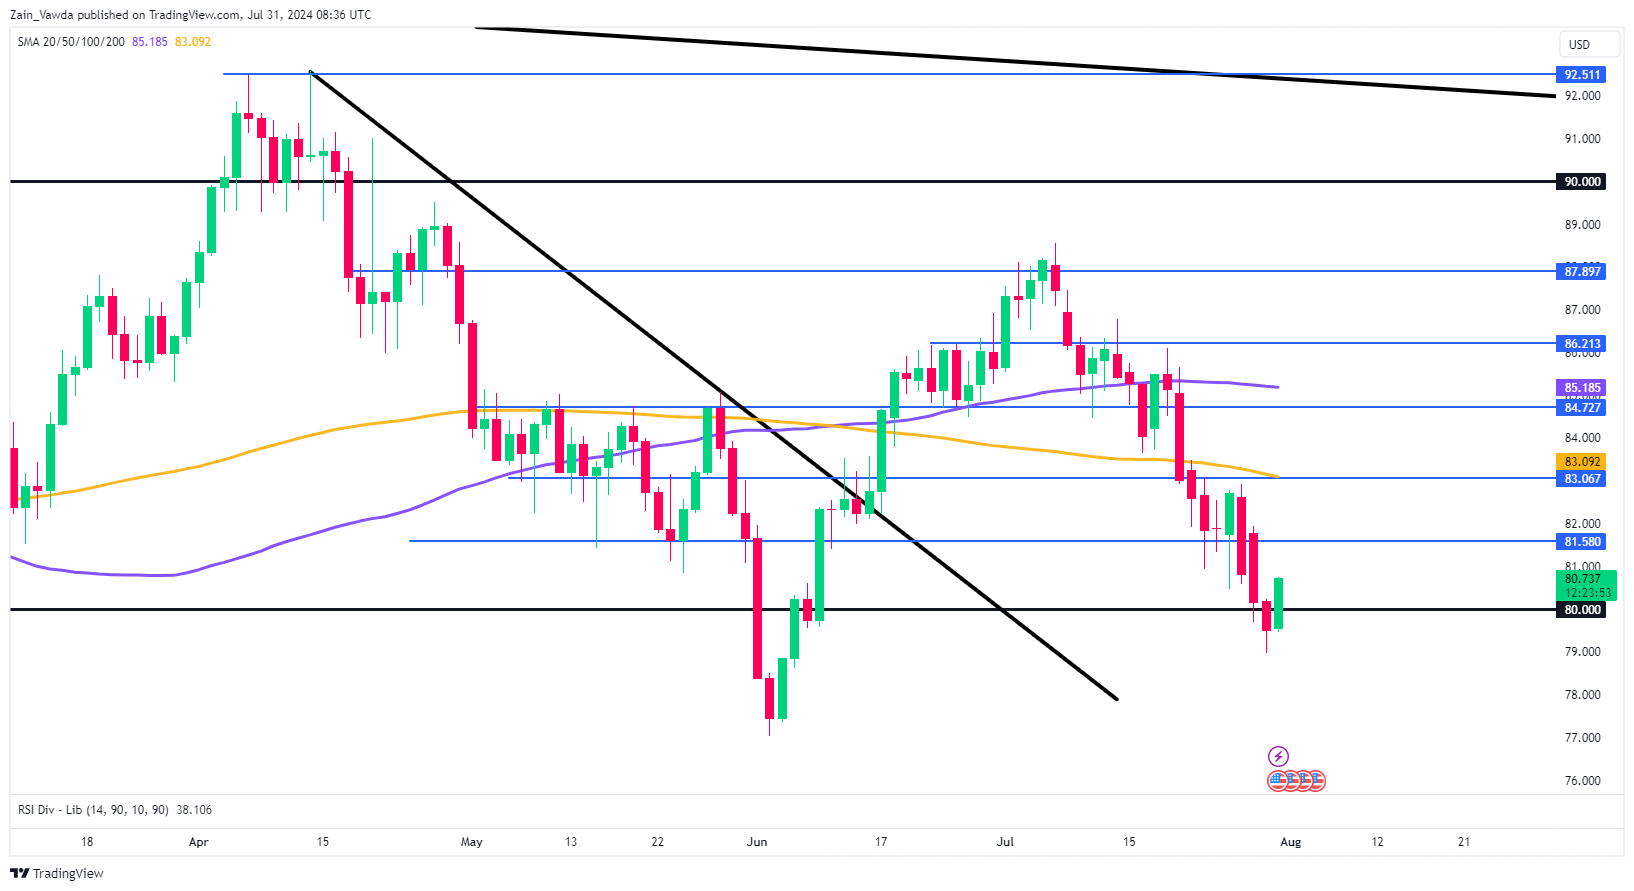
Market participants may fear supply disruptions if a wider conflict breaks out in the Middle East. This has led to a rebound with Brent finding support around the 78.00 handle, up around 1.6% at the time of writing to trade at 80.82 a barrel.
From a technical standpoint, the daily candle close below the 80.00 mark yesterday hinted at the potential for further downside. The external threat posed by geopolitical risks have scuppered that move for now at least.
The concerns around Oil prices are mixed at the moment, with concerns around depleted stockpiles countered by the growth concerns out of China.
Later in the North American session, the US Energy Information Administration (EIA) will release the Crude Oil Stocks Change report. The market expects a decline of 1.60 million barrels for the week ending July 26, following the previous week’s decrease of 3.741 million barrels.
Tomorrow’s OPEC+ meeting is not expected to result in significant changes to oil output levels. While further reductions are unlikely, there seems to be little chance of an increase in production.
Market participants hope that this meeting will provide clarity from OPEC, allowing attention to shift toward supply risks stemming from Middle East conflicts.
Brent Crude Oil Daily Chart, July 31, 2024
Source:TradingView.com
Support
- 80.00
- 79.00
- 77.50
Resistance
- 81.58
- 83.00
- 84.72
Gold (XAU/USD) Technical Analysis
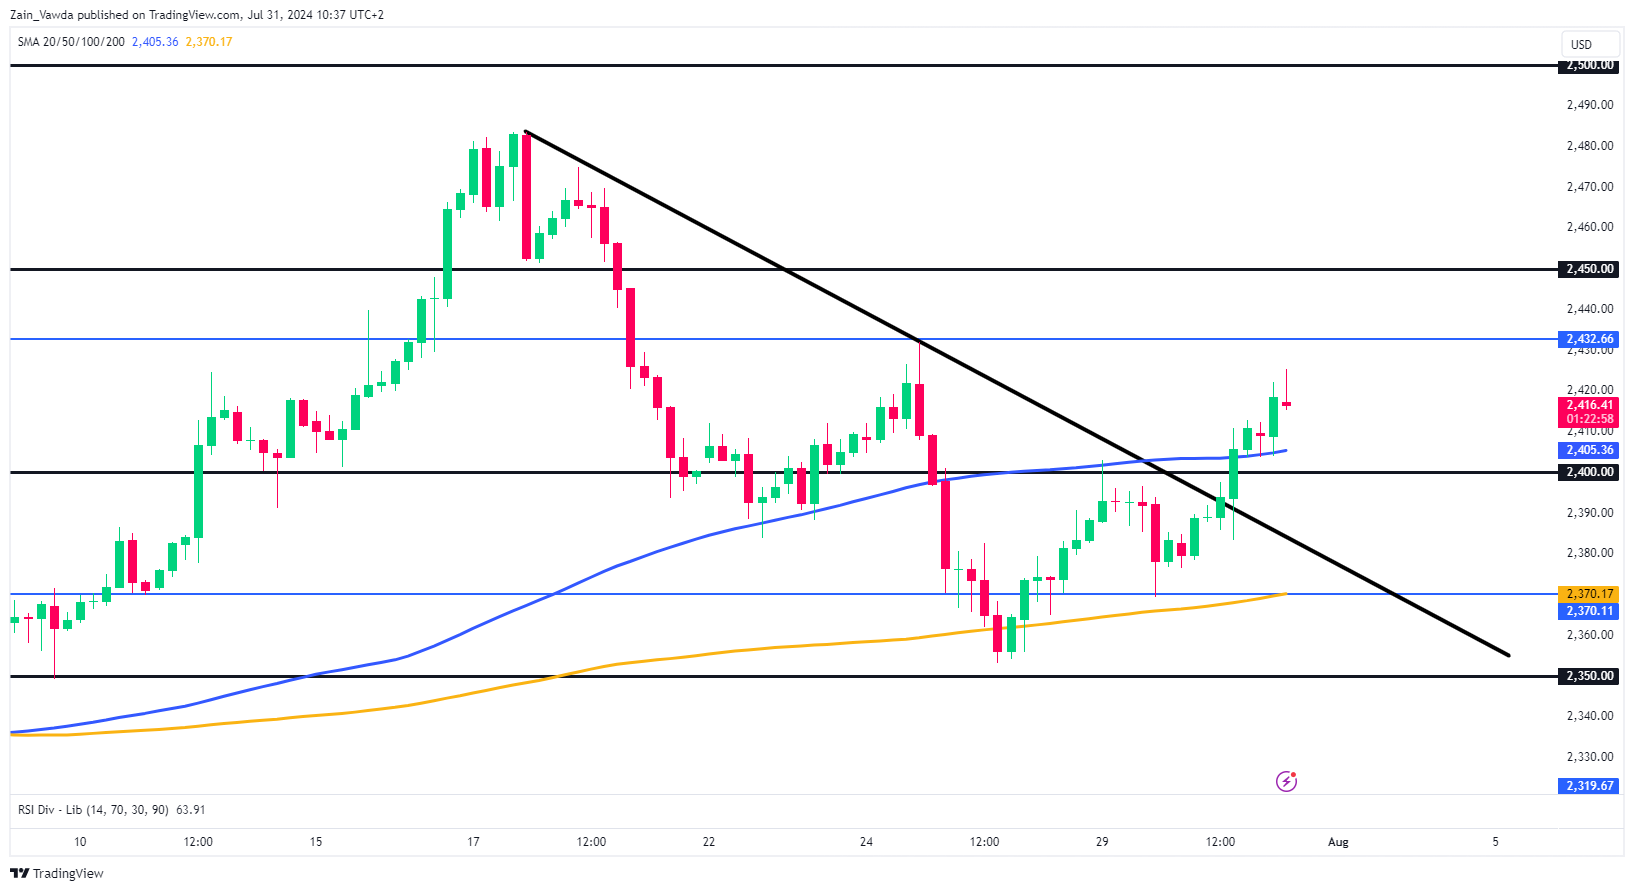
From a technical standpoint, gold has surpassed the descending trendline that has been in place since the July 17 high around the 2481.00 level.
The breakout has gained momentum without any retest of the trendline, thus not offering a better risk-to-reward entry point. The 100-day moving average provides support around the 2405.00 level.
Immediate resistance is at 2432, followed by the 2450 mark. Based on the rules of a trendline break, in theory the break should lead prices toward the previous highs at 2481.00.
With the FOMC meeting scheduled for later today, it will be interesting to see if bulls continue to drive gold prices higher.There is a strong possibility that markets might enter a period of consolidation ahead of the meeting later in the day.
GOLD (XAU/USD) Four-Hour Chart, July 31, 2024
Source: TradingView (click to enlarge)
Support
- 2405
- 2394
- 2378
Resistance
- 2432
- 2450
- 2467
USD/JPY Plummets as Bank of Japan Tightens Policy
The USD/JPY pair has experienced a sharp decline, currently at 152.79, following decisive monetary policy adjustments by the Bank of Japan (BoJ). In a significant shift, the BoJ raised its interest rate to 0.25% per annum and unveiled plans to scale back monthly bond purchases to approximately 3 trillion yen by Q1 2026. Further interest rate hikes and monetary policy adjustments are on the table if economic activities and inflation pressures align with projections.
This move comes as the BoJ faces increasing pressure from government and financial authorities to mitigate the yen's weakness and curb rising inflation. The yen's devaluation has been a pressing concern, intensifying inflationary pressures within the country.
Recent data from Japan provided mixed signals: retail sales reached a four-month high in June, indicating robust consumer activity, whereas industrial production showed a smaller-than-expected decline.
As the market continues to digest the BoJ's new stance, the USD/JPY pair shows potential for further declines, especially if the market fully assimilates these recent adjustments from the Japanese central bank.
Technical Analysis: USD/JPY
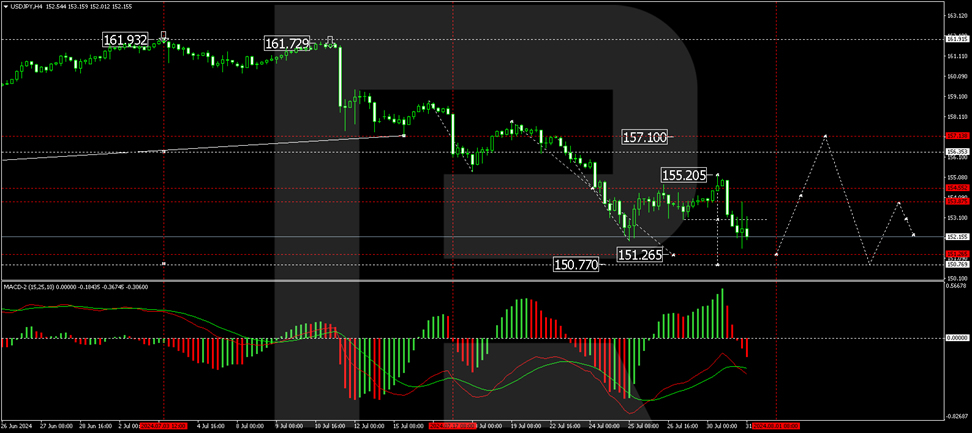
The pair formed a consolidation range around 153.03, extending between 155.20 and 152.10. Following a breakout below this range, there is a visible downward trajectory towards 151.26, potentially extending to 150.77. The MACD indicator, positioned below zero with a downward trajectory, supports this bearish outlook.
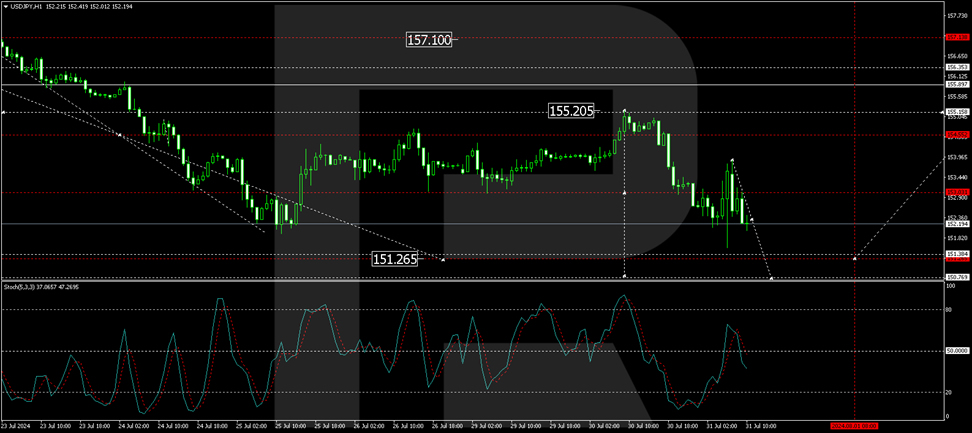
After completing a decline to 151.57 and a subsequent correction to 153.88, the market is poised for another downward movement towards 151.35, potentially continuing to 150.77. This bearish forecast is bolstered by the Stochastic oscillator, below the 50 mark and trending downwards, indicating continued selling pressure.
NZDUSD Poised for Bullish Rotation
- NZDUSD rotates higher after touching familiar support zone
- Technical signals increase the odds for upside reversal
- FOMC policy announcement might affect USD at 18:00 GMT
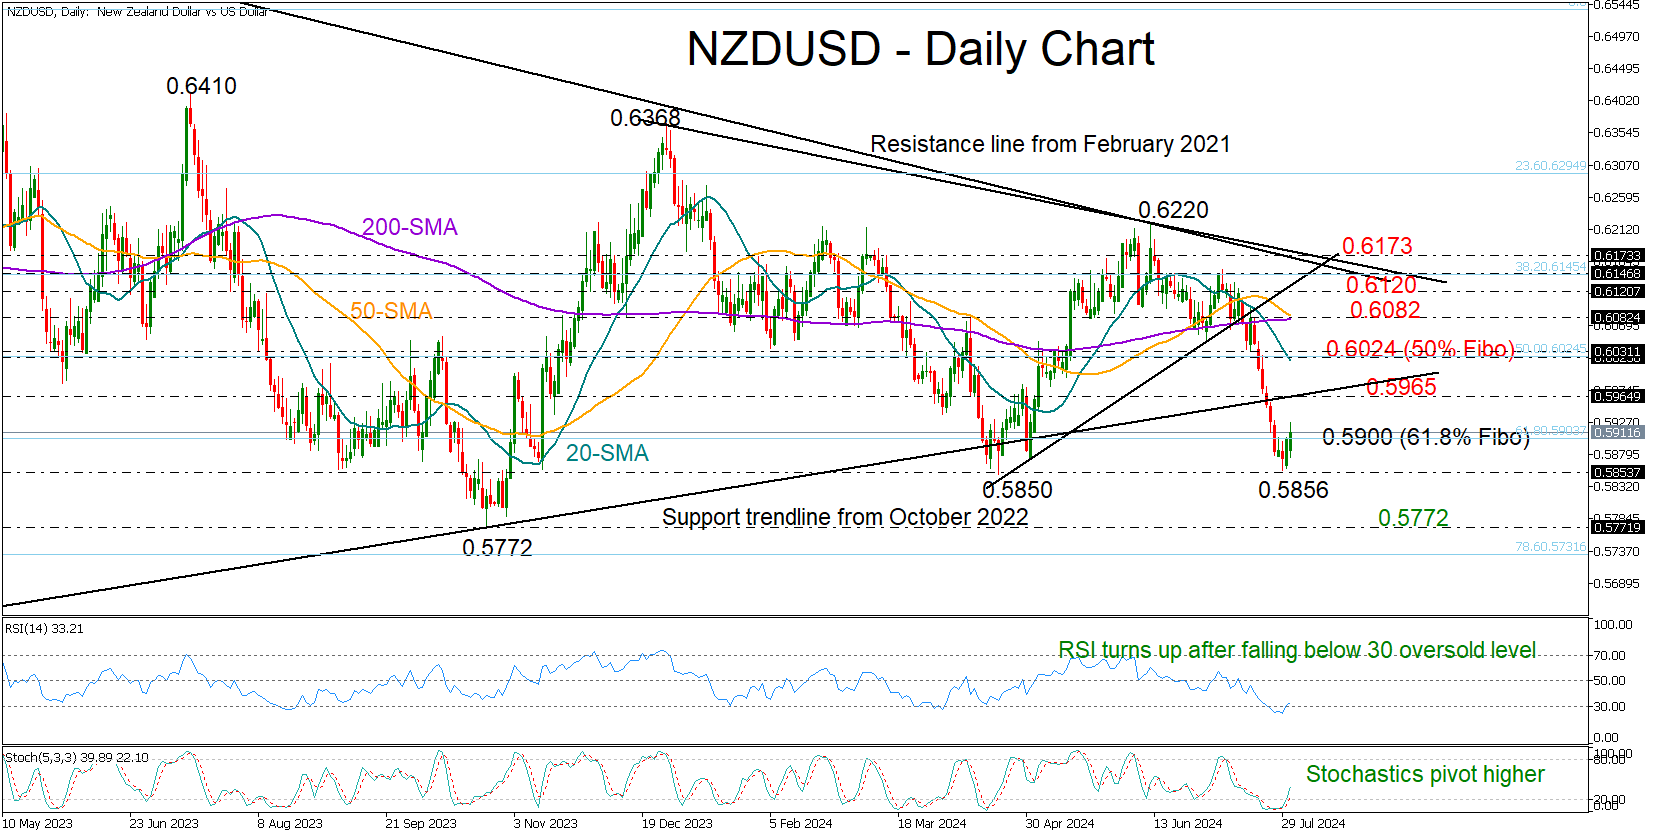
NZDUSD has had a terrible month, but a bullish rotation this week has brought hope that the bearish phase could be over.
The pair changed direction and moved north after reaching April’s pivotal zone of 0.5850, creating a bullish engulfing candlestick pattern. This is usually a sign of a positive reversal, with the RSI and stochastic oscillator endorsing the idea as they are both emerging from oversold territory.
Confirming further gains may require a close above the 61.8% Fibonacci retracement of the October-February 2023 upleg at 0.5900. However, a significant challenge for the bulls could be the 0.5965 area, where the broken support trendline from October 2022 is located. Breaching that bar, the price could rise straight to the 20-day simple moving average (SMA) and the 50% Fibonacci of 0.6024, while higher, a new barrier could emerge somewhere between the 50- and 200-day SMAs at 0.6082.
Still, only a sustainable increase above the resistance zone of 0.6120-0.6173 would brighten the long-term outlook given that the tough 2021 descending trendline, which has been capping bullish actions since the 2021 top, is within the region.
Should the 0.5850 floor crack, the spotlight will fall on the 2023 low of 0.5772. An extension lower would violate the 2023-2024 wide range, likely prompting a sharp decline towards the 0.5590 constraining zone taken from October 2022.
In a nutshell, NZDUSD could potentially embark on a new positive cycle following a significant decline. Yet, traders may need a signal above the level of 0.5965 to drive the pair higher.
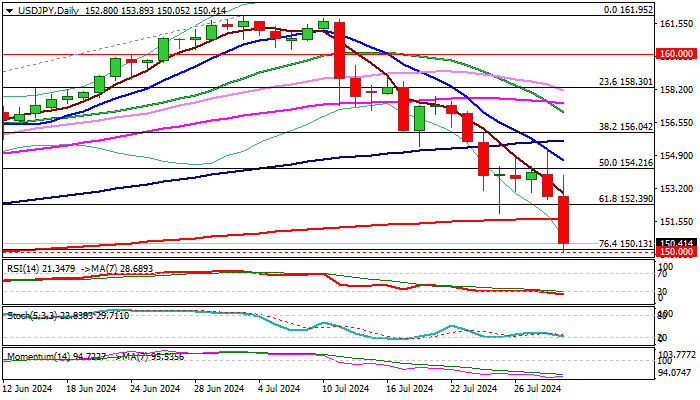
USD/JPY Outlook: Cracks Key 150 Support Zone on Fresh Post-BoJ Acceleration Lower
USDJPY accelerated lower in early European trading on Wednesday, following a mixed immediate reaction on BoJ’s decision to raise interest rate from 0.10% to 0.25% and unveil plan to halve bond buying.
The decision was positive for yen and added to currency’s broader strength, sparked by recent interventions by Japan’s authorities.
Fresh weakness pushed the price to the lowest in almost 4 ½ months, after break of significant supports at 152.39 (Fibo 61.8% of 146.48/161.95) and 151.66 (200DMA), generating fresh bearish signal, which looks for confirmation on close below these levels.
Bears crack targets at 150.13/00 (Fibo 76.4%/psychological) violation of which to open way for deeper correction of larger uptrend from 127.22 (2023).
Meanwhile, oversold daily studies may provide headwinds to bears and pause the fall for consolidation above pivotal 150 support zone, with limited upticks to provide better selling levels.
Adding to bearish picture is formation of reversal pattern on monthly chart, as the pair is on track for the biggest monthly fall since Oct 1998.
Res: 151.66; 152.39; 153.00; 153.89.
Sup: 150.00; 148.90; 147.42; 146.48.
Eurozone CPI rises to 2.6% yoy in Jul, core CPI unchanged at 2.9% yoy
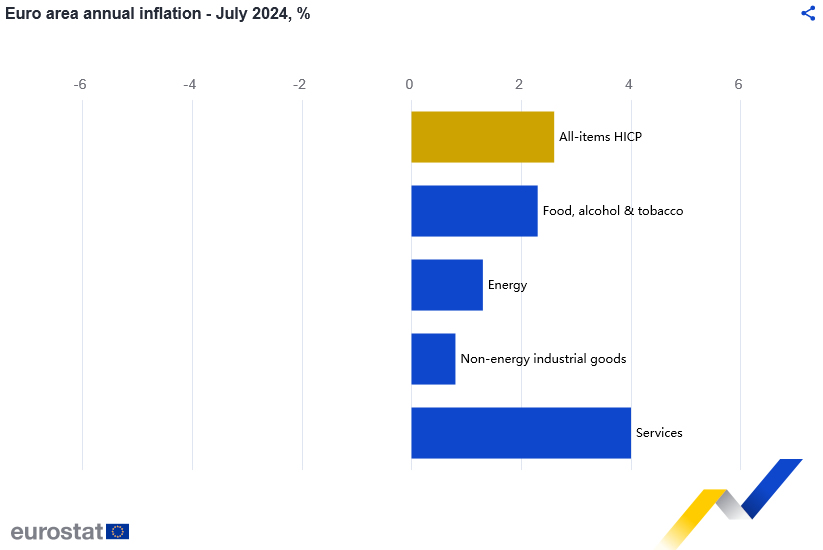
Eurozone CPI rose from 2.5% yoy to 2.6% yoy in July, above expectation of 2.4% yoy. Core CPI (ex-energy, food, alcohol & tobacco) was unchanged at 2.9% yoy, above expectation of 2.8% yoy.
Looking at the main components, services is expected to have the highest annual rate in July (4.0%, compared with 4.1% in June), followed by food, alcohol & tobacco (2.3%, compared with 2.4% in June), energy (1.3%, compared with 0.2% in June) and non-energy industrial goods (0.8%, compared with 0.7% in June).
USD/JPY Technical: JPY Strength Halted Right at 151.70 Support as BoJ Hiked Interest Rate. What’s Next for JPY?
- BoJ hiked its overnight interest rate to 0.25% and announced its “Quantitative Tightening” plan, without much major surprises.
- USD/JPY sold off but still hovering above its 151.70 key short-term support.
- Cannot rule out the possibility of another minor mean reversion rebound in USD/JPY before a bearish impulsive down move sequence unfolds with next medium-term support supports coming in at 149.50 and 146.20/144.60.
Since our last publication, the USD/JPY has shaped the expected mean reversion rebound right above the 151.70 key pivotal support and rallied to hit an intraday high of 155.22 on Tuesday, 30 July, just a whisker away from the lower boundary of the short-term mean reversion rebound resistance zone of 155.80/156.50.
Thereafter, the Japanese yen started to strengthen against the US dollar as the USD/JPY shaped an intraday decline of 1.6%/245 pips to close Tuesday, 30 July US session at 152.76. The reason for this abrupt intraday decline has been a “breaking news” release from a Japanese media outlet that stated Bank of Japan (BoJ) was considering an interest rate hike today to increase its overnight policy interest rate to 0.25% from 0% to 0.1% ahead of today’s BoJ monetary policy decision.
BoJ does not surprise (again) and maintained its inflation trend outlook
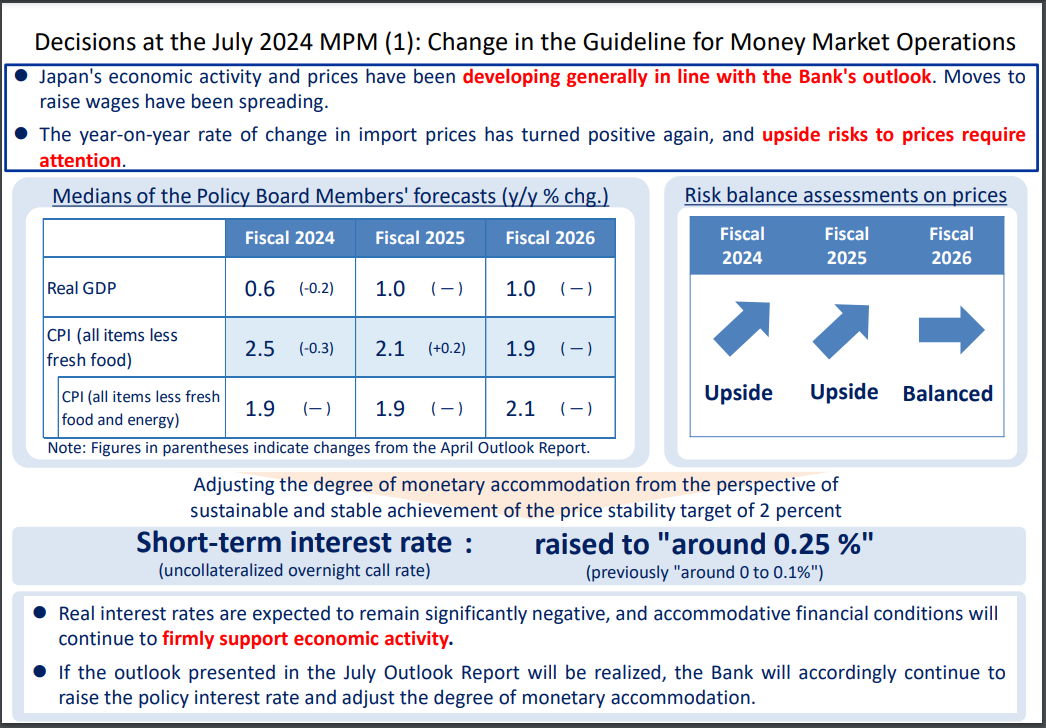
Fig 1: BoJ monetary policy decision and latest quarterly outlook as of 31 Jul 2024 (Source: BoJ website, click to enlarge chart)
These type of “breaking news” leaks ahead of key BoJ’s monetary policy decision seems to be a “modus operandi” to prep markets and reduces the risk of high volatility moments inflicted on the global markets via the process of messy unwinding of positions that can trigger significant feedback loops in difference cross assets when the actual announcement takes place; a similar approach was utilized in March when BoJ abolished its “yield curve control” programme on the 10-year Japan Government Bond (JGB) yield and increase its overnight interest rate from a negative level; its first hike since 2007.
The USD/JPY dropped further to test the 151.70 key support (printed an intraday low of 51.60) right after the BoJ’s monetary policy announcement to hike its overnight interest rate for the second time this year and managed to stage a bounce thereafter to print an ex-post BoJ session intraday high of 153.90 at this time of the writing.
In addition, BoJ’s latest quarterly outlook on inflationary trend in Japan remained the same as the previous April quarter where officials maintained their median forecasts for core-core CPI (excluded fresh food and energy) at 1.9% for fiscal years of 2024 to 2025 and 2.1% for fiscal year of 2026 (see Fig 1).
BoJ has expressed concerns on imported inflation where upside risks for import prices have increased for fiscal years of 2024 and 2025 on a year-on-year rate of change basis (see Fig 1) which in turns suggest that that on a medium-term horizon, BoJ has implied indirectly that a further Japanese yen weakness is not desirable as its adverse effects on consumer confidence and spending outweighs its benefits. That’s a likely driver to see a further weakening of the USD/JPY in the medium-term horizon.
Gradual quarterly reduction of JGBs monthly purchases
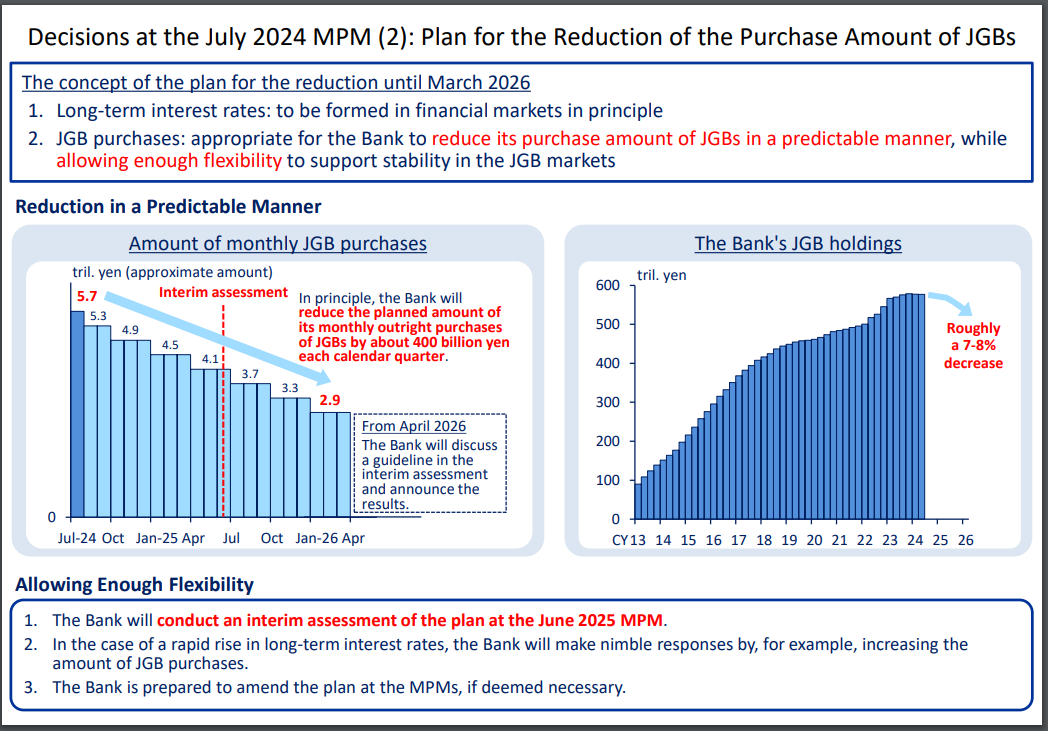
Fig 2: BoJ plan for the reduction of JGBs monthly purchases as of 31 Jul 2024 (Source: BoJ website, click to enlarge chart)
Also, without any major surprise, BoJ has “officially” announced its “Quantitative Tightening” programme to reduce its monthly JGBs purchase of 5.7 trillion yen by 50 percent to around 3 trillion yen by Q1 2026 through gradual reduction by about 400 billion yen each calendar quarter (see Fig 2).
This process is likely to see a decrease of around 7% to 8% in the current huge JGBs holdings that is coming close to 600 trillion yen in BoJ’s balance sheet and allow market forces to play a more significant role in the determination of long-term interest rates in Japan.
Overall, also a medium-term factor that may led to lower levels of USD/JPY going forward.
Technical factors are supporting of a minor mean reversion rebound within a medium-term downtrend in USD/JPY
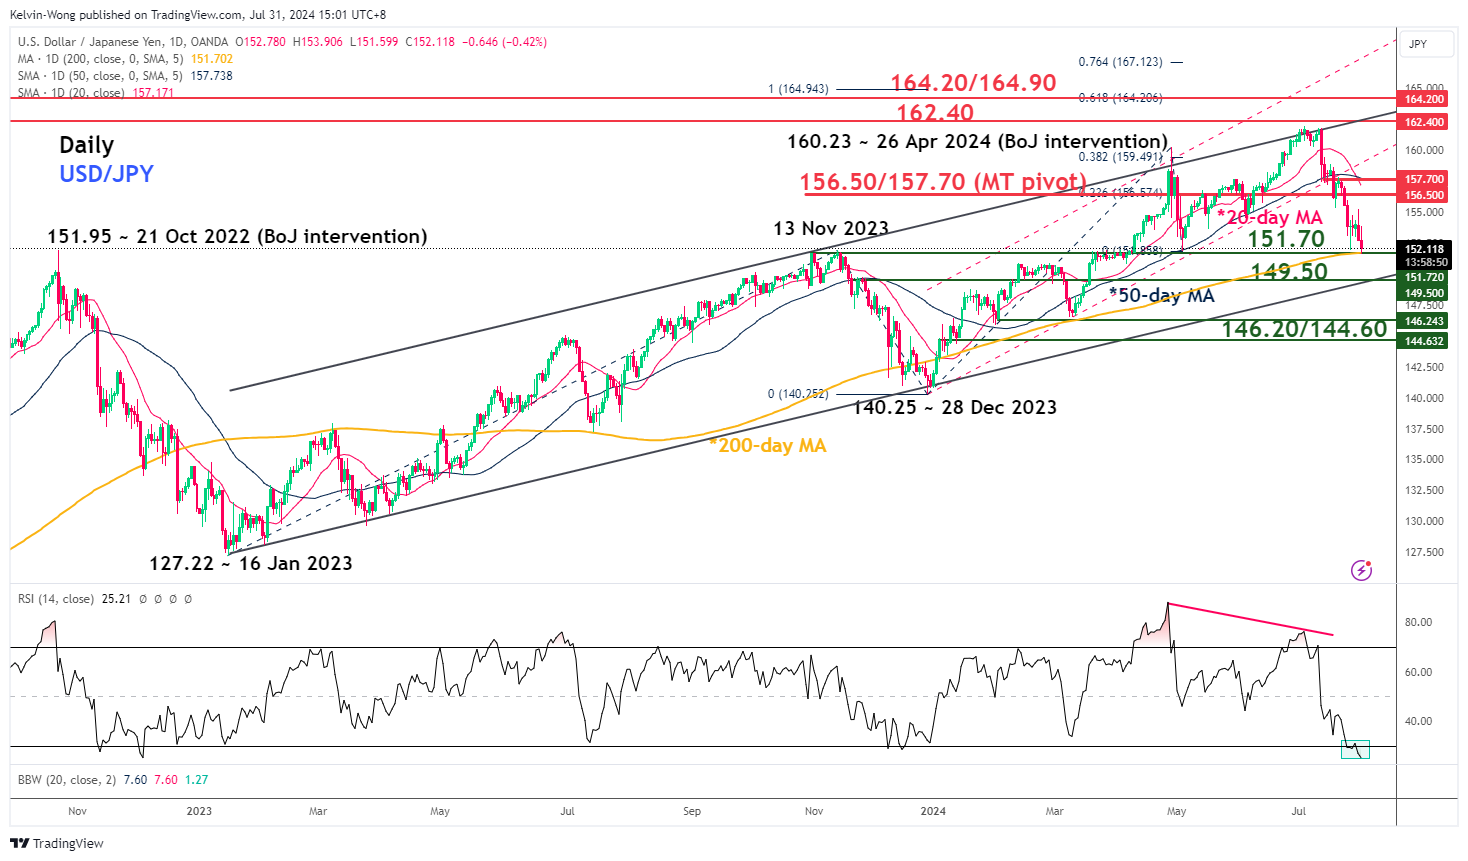
Fig 3: USD/JPY medium-term & major trend phases as of 31 Jul 2024 (Source: TradingView, click to enlarge chart)
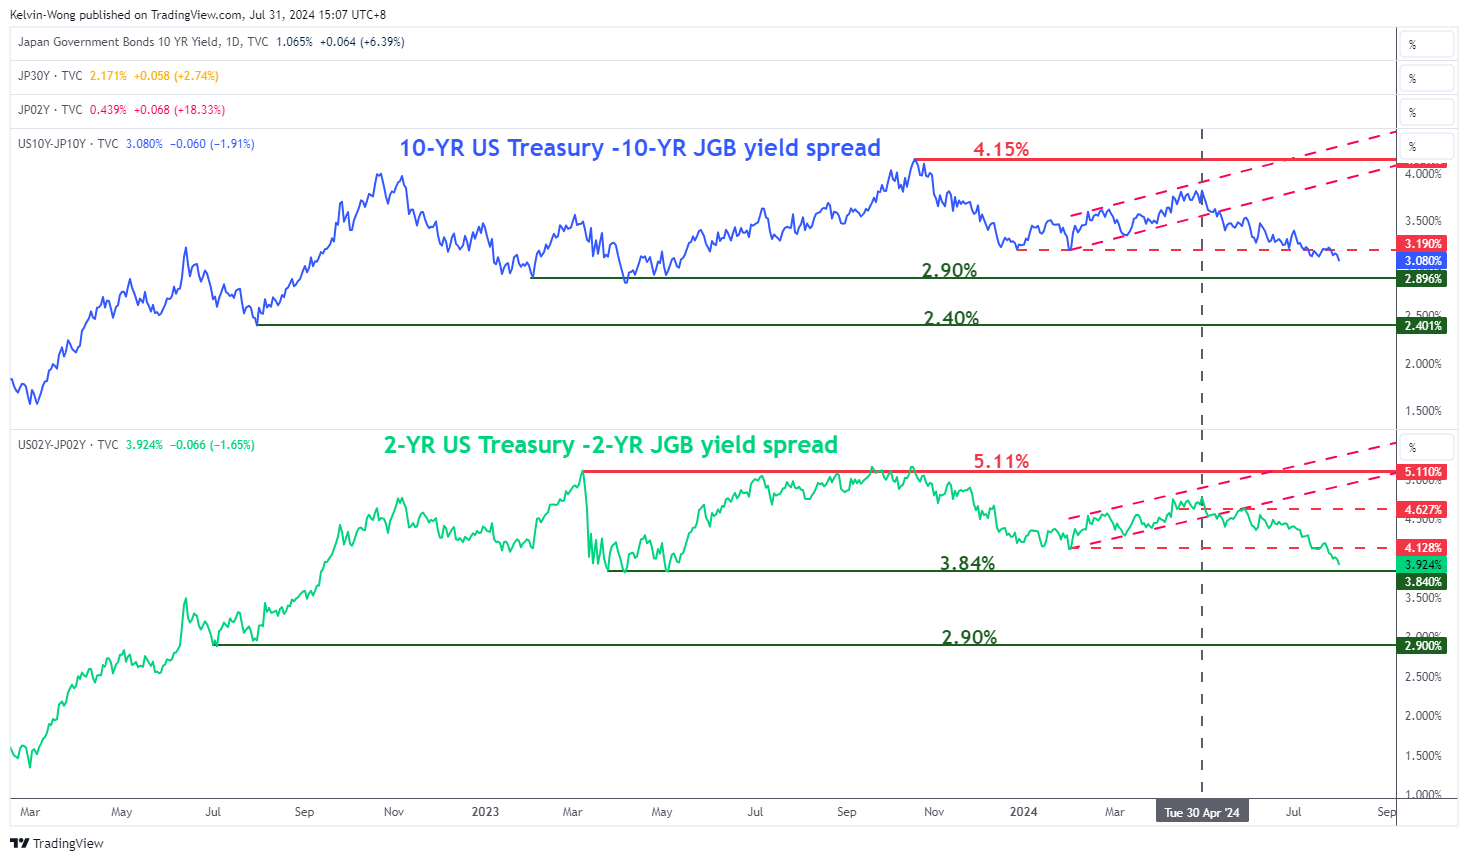
Fig 4: US Treasuries-JGBs yield spreads medium-term trend as of 31 Jul 2024 (Source: TradingView, click to enlarge chart)
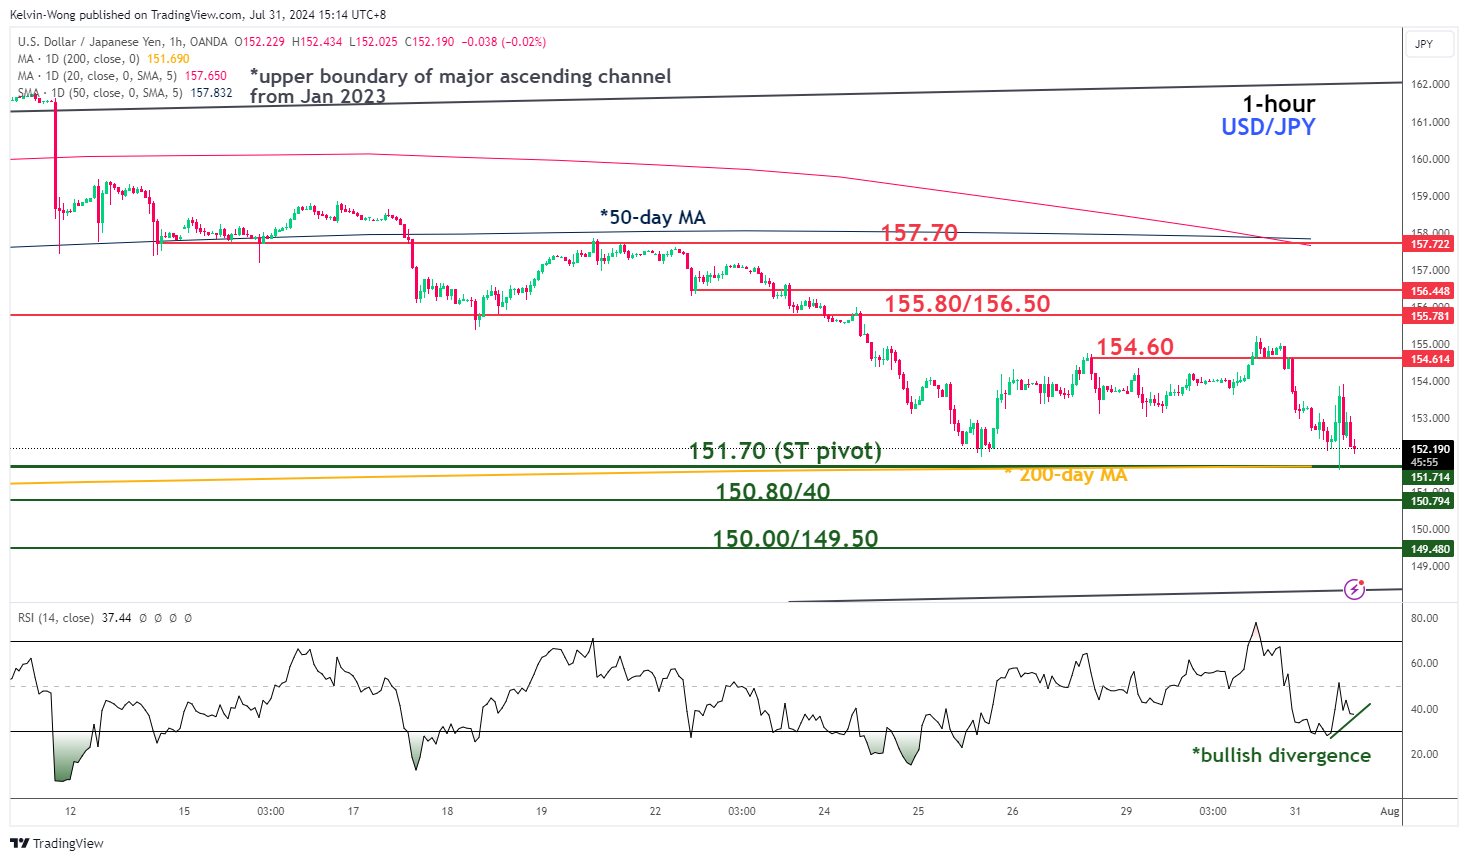
Fig 5: USD/JPY short-term trend as of 31 Jul 2024 (Source: TradingView, click to enlarge chart)
In the lens of technical analysis, price actions of highly liquid tradable financial instruments do not move in a vertical fashion but oscillate within longer-term trend phases.
At this juncture as seen on the daily chart of the USD/JPY, the medium-term trend of the USD/JPY has turned bearish as it has broken below its 50-day moving average recently on 17 July after it held prior dips in price actions since 14 March 2024 (see Fig 3).
In addition, the positive yield premium (2-year and 10-year) of US Treasuries over JGBs have continued to shrink with in turns supports the medium-term downtrend of USD/JPY from unfolding with the next medium-term supports coming in at 149.50 and 146.20/144.60 (see Fig 4).
The on-going slide in the USD/JPY (20 days so far) in place its 03 July 2024 high of 161.95 has reached an oversold condition on the daily RSI momentum indicator.
Coupled with a potential bullish divergence condition being flashed out on the hourly RSI momentum at its oversold region after a test on the 151.70 key short-term pivotal support (also the 200-day moving average), we cannot rule out another leg of minor reversion rebound scenario to occur, a clearance above 154.60 near-term resistance may see an extension of the rebound to expose the 155.80/156.50 resistance zone before another bearish impulsive downmove sequence unfolds (see Fig 5).
USDJPY’s Decline Faces 200-Day SMA
- USDJPY extends its retreat from recent 38-year high
- The bears tested 200-day SMA for first time since January 9
- Momentum indicators start to warn of oversold conditions
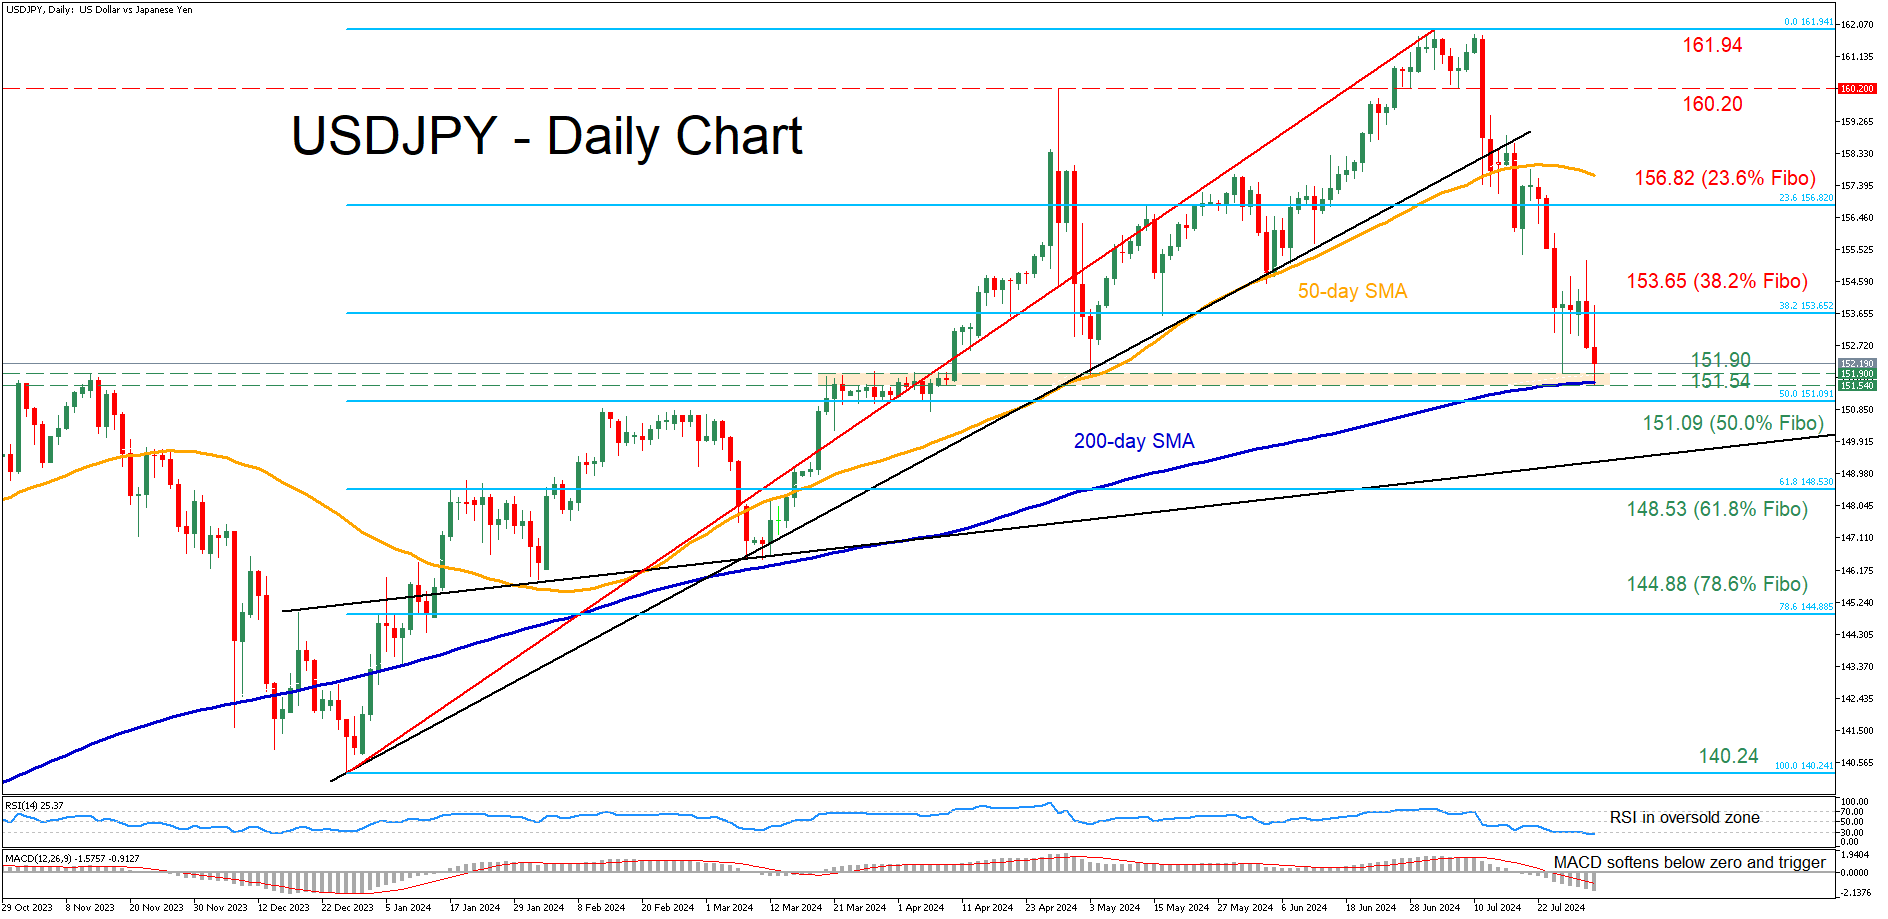
USDJPY has been in a steady retreat from its 38-year peak of 161.94, falling to an almost three-month low on Wednesday. Meanwhile, the pair has reached a tipping point as it challenged the 200-day simple moving average (SMA) for the first time since January 9, where a downside violation could suggest the beginning of a sustained downtrend.
Should bearish pressures persist, the price may face the congested 151.90-151.54, which includes the May low, a June support and the 200-day SMA. Lower, the bears may attack 151.09, which is the 50.0% Fibonacci retracement of the 140.24-161.94 upleg. Further retreats could then cease at the 61.8% Fibo of 148.53.
Alternatively, bullish actions could propel the price towards the 38.2% Fibo of 153.65. Failing to halt there, the pair might advance towards the 23.6% Fibo of 156.82 ahead of the April peak of 160.20. A decisive break above the latter could set the stage for the 38-year high of 161.94.
In brief, USDJPY remains under selling pressure in the short term, while the BoJ’s hike on Wednesday acted as an additional tailwind. That said, a downside violation of the 200-day SMA could signal the start of a trend reversal.
Gold Fights With 2,420 Level Within Ichimoku Cloud
- Gold rebounds off 2,370 support
- Prices penetrate short-term downtrend line
- But momentum oscillators look overstretched
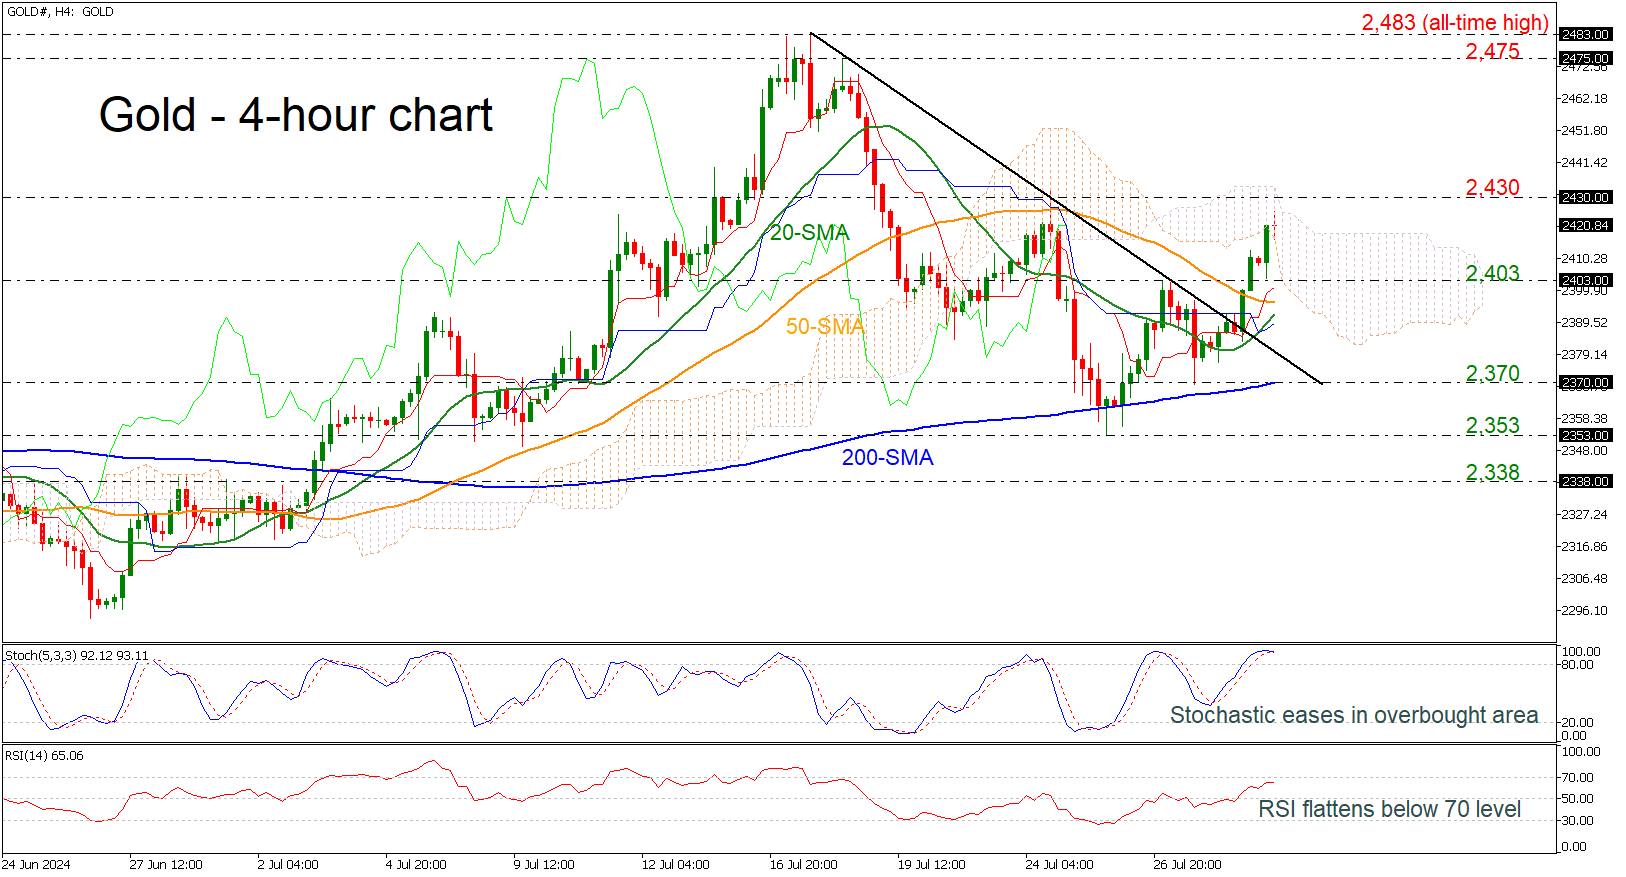
Gold prices have been in a bullish corrective mode during the week, paring/reversing some of its losses from July 24. The price has now surpassed the short-term downtrend line and the simple moving averages (SMAs), testing the 2,420 level.
Over the past week, the bulls have struggled to enter the 2,400 area, and they may face another challenging obstacle near the 2,430 resistance. The technical indicators suggest that the bulls may lose this battle. Specifically, the RSI is moving horizontally slightly below the 70 level, while the stochastic oscillator is ready for a bearish crossover between its %K and %D lines in the overbought territory.
In the event the commodity continues its ascending move above the Ichimoku cloud and the 2,430 barricade, the next target will be the 2,475 resistance.
On the downside, the 2,403 support and the 50- and 20-period SMAs at 2,395 and 2,392, respectively, could be the immediate levels for traders to watch. Hence, a step beneath these lines and the 2,370 level, which coincides with the 200-period SMA, might produce fresh negative volatility.
Overall, the precious metal is sustaining an upward trend above 2,400 in the four-month picture. To attract new buyers, the pair will need to pierce through the 2,475-2,483 bar.