Sample Category Title
GBP/USD Mid-Day Outlook
Daily Pivots: (S1) 1.2851; (P) 1.2866; (R1) 1.2883; More...
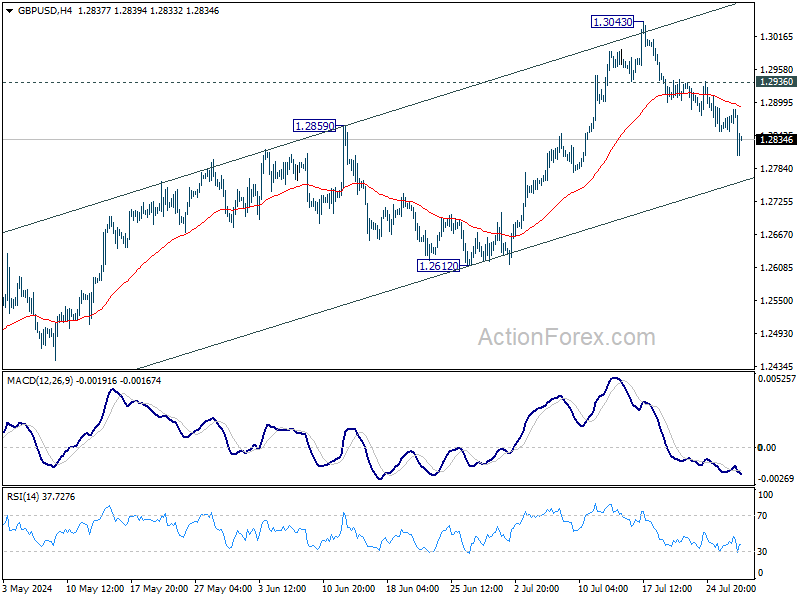
GBP/USD's fall from 1.3043 extends lower today and intraday bias is back on the downside with break of 1.2859 resistance turned support. Decisive break of 55 D EMA (now at 1.2776) will suggest that rise from 1.2298 has completed with three waves up to 1.3043 Deeper fall would be seen to 1.2612 support and below. On the upside, above 1.2936 resistance will bring retest of 1.3043 resistance instead.
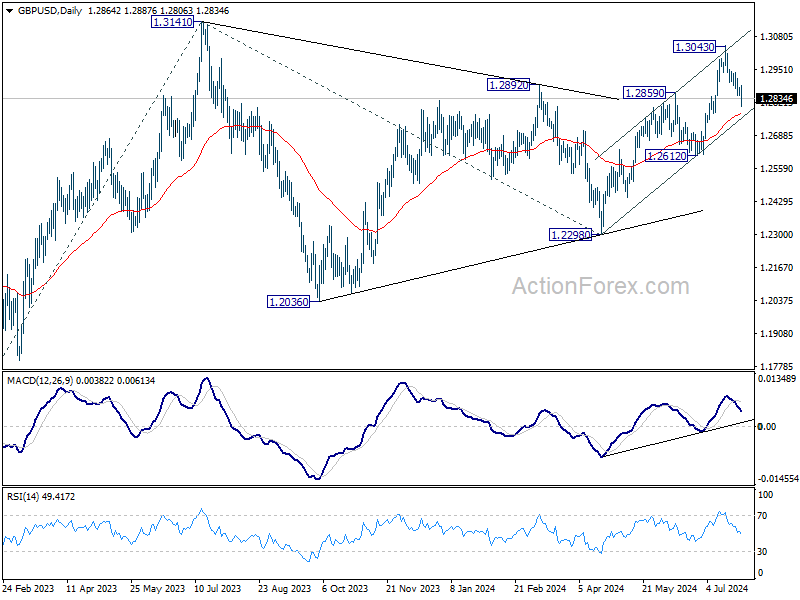
In the bigger picture, corrective pattern from 1.3141 medium term top (2023 high) could have completed with three waves to 1.2298 already. This will now remain the favored case as long as 1.2612 support holds. Firm break of 1.3141 will target 61.8% projection of 1.0351 (2022 low) to 1.3141 from 1.2298 at 1.4022. However, break of 1.2612 support argue that this corrective pattern is extending with another falling leg.
EUR/USD Mid-Day Outlook
Daily Pivots: (S1) 1.0843; (P) 1.0855; (R1) 1.0869; More.....
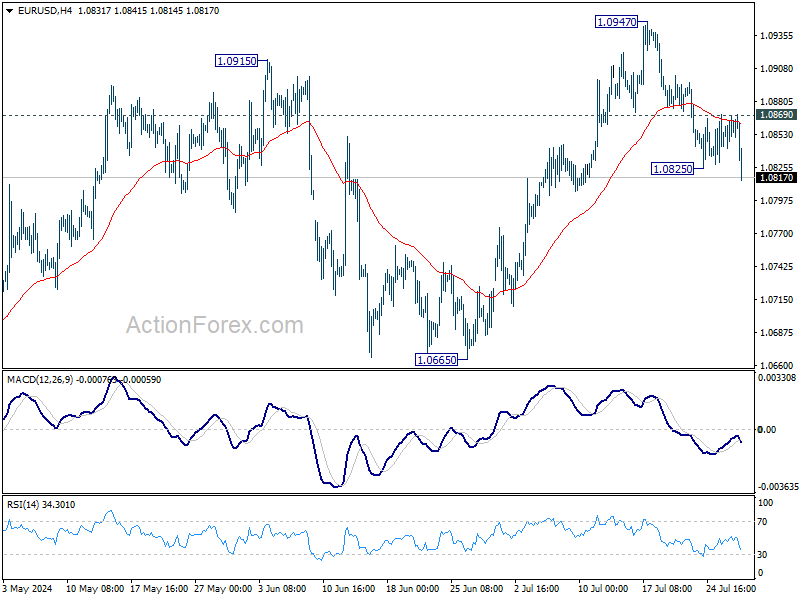
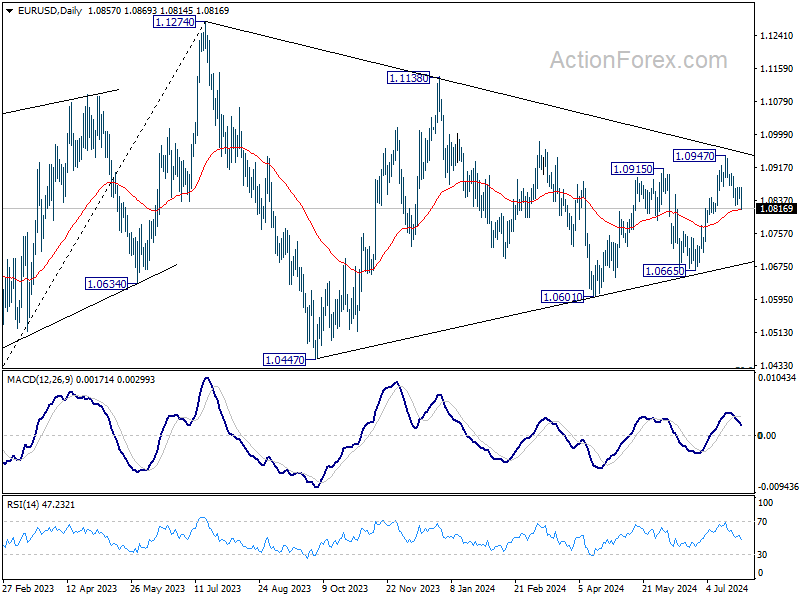
EUR/USD's fall from 1.0947 resumed by breaking 1.0825 temporary low and intraday bias is back on the downside. Sustained break of 55 D EMA (now at 1.0815) will argue that whole rebound from 1.0601 has completed with three waves up to 1.0947. Deeper decline should then be seen to 1.0601/0665 support zone next. Nevertheless, break of 1.0869 will bring retest of 1.0947 resistance instead.
In the bigger picture, price actions from 1.1274 are viewed as a corrective pattern that's still be in progress. Break of 1.1138 resistance will be the first signal that rise from 0.9534 (2022 low) is ready to resume through 1.1274 (2023 high). However, break of 1.0665 support will extend the correction with another falling leg back towards 1.0447 support.
Dollar Rally Gains Momentum as European Majors Falter
Dollar's rally is gaining significant traction today, as major European currencies face increasing selling pressure. The break of last week's lows in both EUR/USD and GBP/USD pairs suggests that the greenback's rise is poised to extend further in the near term. However, the sustainability of this rally will largely depend on market reactions to critical upcoming events, including FOMC rate decision and pivotal economic indicators like ISM manufacturing index and non-farm payrolls.
Investors are keenly anticipating Fed's next moves, with expectations high that Fed will signal impending rate cuts in September. Moreover, there is growing speculation that Fed might indicate the openness to implement back-to-back rate cuts in September, November, and December. However, if Fed Chair Jerome Powell adopts a more cautious tone, it could lead to investor disappointment, resulting in a decline in stock markets and a stronger Dollar as a safe-haven asset.
As of today, Dollar is the strongest performing currency followed by Loonie and Aussie. On the other hand, Euro is the worst performer. Kiwi and Sterling are also underperforming. In the middle of the performance spectrum, Swiss Franc and Yen are Holding Steady.
In Europe, at the time of writing, FTSE is up 0.88%. DAX is up 0.29%. CAC is down -0.35%. UK 10-year yield is down -0.072 at 4.032. Germany 10-year yield is down -0.051 at 2.357. Earlier in Asia, Nikkei rose 2.13%. Hong Kong HSI rose 1.28%. China Shanghai SSE rose 0.03%. Singapore Strait Times rose 0.52%. Japan 10-year JGB yield fell -0.0333 to 1.029.
Nikkei rebounds on short covering, but downside threats remain
Nikkei rebounded strongly during Asian session, closing up by more than 800 points or 2.13%. This marked the index's first day of gains in nine sessions, following a three-month low last week. The stabilization in US tech stocks on Friday helped calm investor sentiment, while Nikkei also found stability as Yen consolidated its recent gains ahead of BoJ meeting later this week.
However, today's bounce appears to be driven largely by short covering in anticipation of key events. There is a risk that BoJ may raise interest rates this week, which could strengthen Yen and subsequently pressure Nikkei. Meanwhile, Fed might start signaling a rate cut in September, but market reactions remain uncertain as this is already largely priced in.
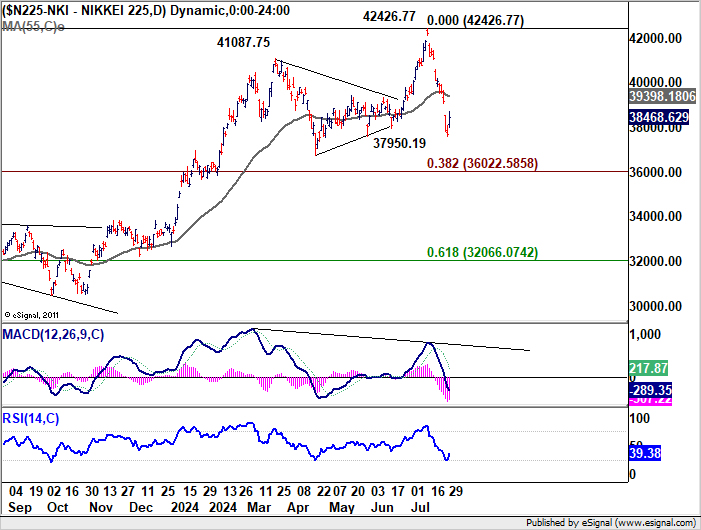
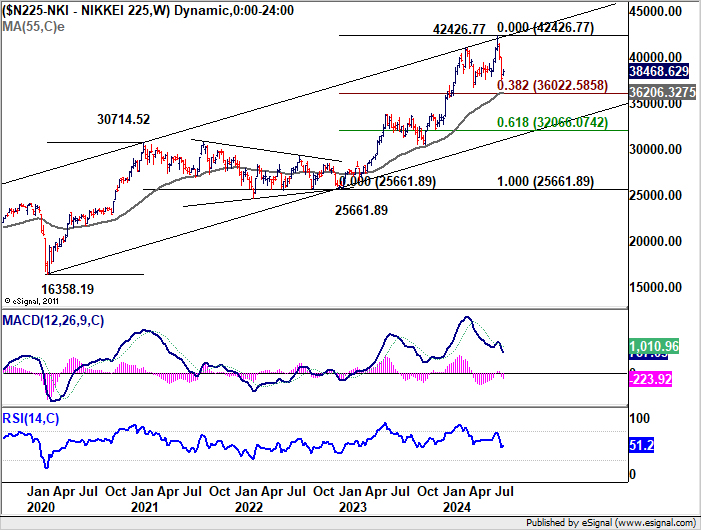
Technically, Nikkei is probably just trying to fill the gap left on last Thursday. Near term risk will stay on the downside as long as 55 D EMA (now at 39398.18) holds. Further fall is expected to 38.2% retracement of 25661.89 to 42426.77 at 36022.58, which is close to 55 W EMA (now at 36206.32) before having enough support for a sustainable rebound to set the range for medium term consolidations.
EUR/USD Mid-Day Outlook
Daily Pivots: (S1) 1.0843; (P) 1.0855; (R1) 1.0869; More.....
EUR/USD's fall from 1.0947 resumed by breaking 1.0825 temporary low and intraday bias is back on the downside. Sustained break of 55 D EMA (now at 1.0815) will argue that whole rebound from 1.0601 has completed with three waves up to 1.0947. Deeper decline should then be seen to 1.0601/0665 support zone next. Nevertheless, break of 1.0869 will bring retest of 1.0947 resistance instead.
In the bigger picture, price actions from 1.1274 are viewed as a corrective pattern that's still be in progress. Break of 1.1138 resistance will be the first signal that rise from 0.9534 (2022 low) is ready to resume through 1.1274 (2023 high). However, break of 1.0665 support will extend the correction with another falling leg back towards 1.0447 support.
Economic Indicators Update
| GMT | Ccy | Events | Actual | Forecast | Previous | Revised |
|---|---|---|---|---|---|---|
| 08:30 | GBP | M4 Money Supply M/M Jun | 0.50% | 0.20% | -0.10% | |
| 08:30 | GBP | Mortgage Approvals Jun | 60K | 60K | 60K |
Nikkei rebounds on short covering, but downside threats remain
Nikkei rebounded strongly during Asian session, closing up by more than 800 points or 2.13%. This marked the index's first day of gains in nine sessions, following a three-month low last week. The stabilization in US tech stocks on Friday helped calm investor sentiment, while Nikkei also found stability as Yen consolidated its recent gains ahead of BoJ meeting later this week.
However, today's bounce appears to be driven largely by short covering in anticipation of key events. There is a risk that BoJ may raise interest rates this week, which could strengthen Yen and subsequently pressure Nikkei. Meanwhile, Fed might start signaling a rate cut in September, but market reactions remain uncertain as this is already largely priced in.
Technically, Nikkei is probably just trying to fill the gap left on last Thursday. Near term risk will stay on the downside as long as 55 D EMA (now at 39398.18) holds. Further fall is expected to 38.2% retracement of 25661.89 to 42426.77 at 36022.58, which is close to 55 W EMA (now at 36206.32) before having enough support for a sustainable rebound to set the range for medium term consolidations.
US 500 Index Bounces Off Long-Term Uptrend Line
- US 500 bearish correction in short-term is not enough for retracement
- Momentum oscillators turn up
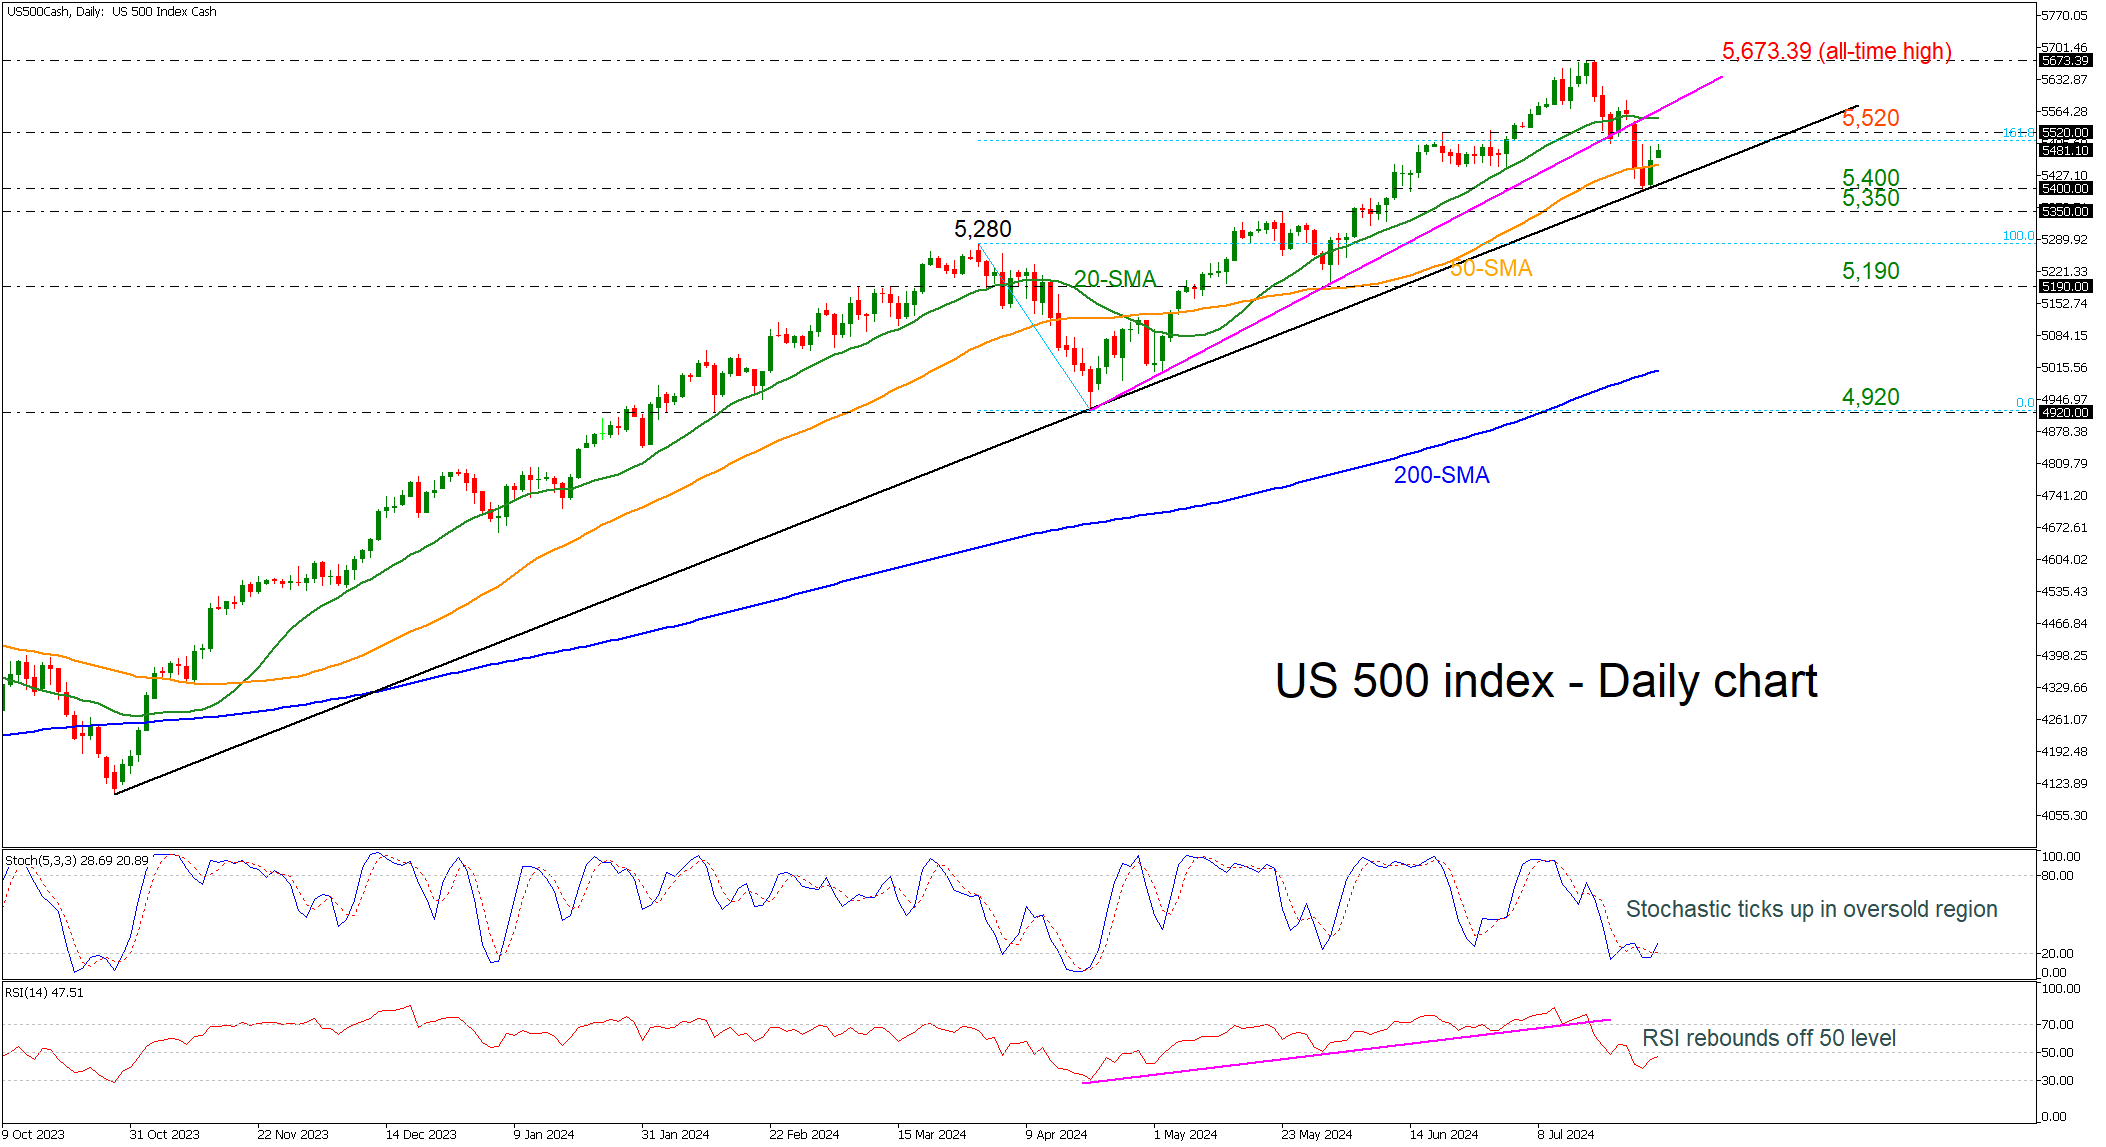
The US 500 (cash) index rebounded significantly off the long-term ascending trend line and surpassed beyond the 50-day simple moving average (SMA). The bearish correctio in the short-term view may came to an end as the technical oscillators are also sloping up. The stochastic recorded a bullish crossover within its %K and %D lines, while the RSI is heading north marginally beneath 50 level.
Immediate resistance could come from the 5,520 barrier before resting near the all-time high at 5,673.39 again.
On the other hand, a plunge below the uptrend line could send the index towards the support region of 5,350-5,400. More downside correction could lead the market until the 5,190 barricade.
Summarizing, the US 500 index penetrated the short-term rising trend line to the downside but the broader outlook is still strongly positive.
News of the Week (July 29— August 2): GBPJPY Review
The GBPJPY pair, representing the exchange rate between the British Pound and the Japanese Yen, is a pivotal gauge of economic interactions between the United Kingdom and Japan. The British Pound is influenced by domestic factors such as political stability, financial data, and decisions of the Bank of England, particularly in terms of interest rate changes. Conversely, the Japanese Yen is impacted by Japan’s economic policies, investor sentiment towards Asian markets, and its status as a 'safe-haven' currency. These dynamics make the GBPJPY pair particularly sensitive to shifts in monetary policy and economic outlooks in both nations.
Japan Interest Rate Decision, July 31, 05:00 (GMT+2)
The upcoming decision on Japan's interest rates, forecasted to remain at 0.10%, is critical. If the rate is held as expected, it may stabilize the Yen, keeping the GBPJPY relatively unchanged if no new policies are introduced. However, should the Bank of Japan opt for a surprise cut below the forecast, aiming to stimulate the economy further, it could lead to a depreciation of the Yen against the Pound, thereby increasing the GBPJPY rate. Conversely, if the decision exceeds expectations with a rate increase, it would likely strengthen the Yen, decreasing the GBPJPY rate as investors flock to the newfound higher yields of the Yen.
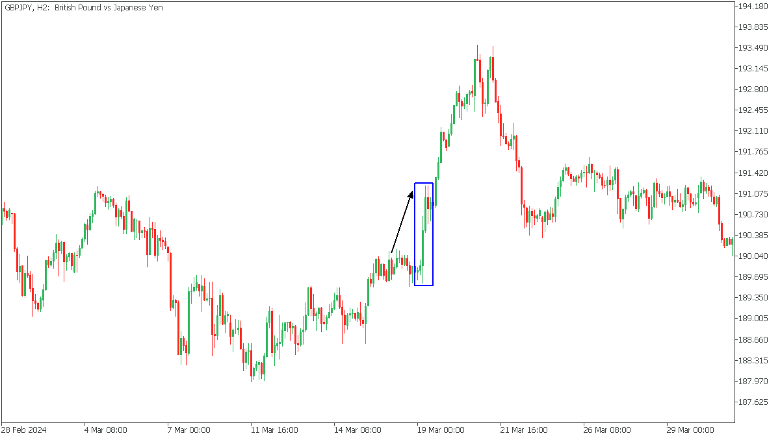
In March 2024, the Bank of Japan was the last to abolish negative interest rates, causing GBPJPY to rise!
UK Interest Rate Decision, Aug 01, 13:00 (GMT+2)
The UK central bank is predicted to cut the interest rate from 5.25% to 5.0%. If such a cut occurs, it could lead to a weaker Pound Sterling due to lower yields on Pound-denominated assets, which could start the GBPJPY pair falling. Conversely, the Pound Sterling will likely strengthen if the Bank of England surprises the market by keeping rates unchanged or raising them. This strengthening could lead to GBPJPY appreciation, as higher rates will attract more investors to the Pound due to its higher yields than the Yen.
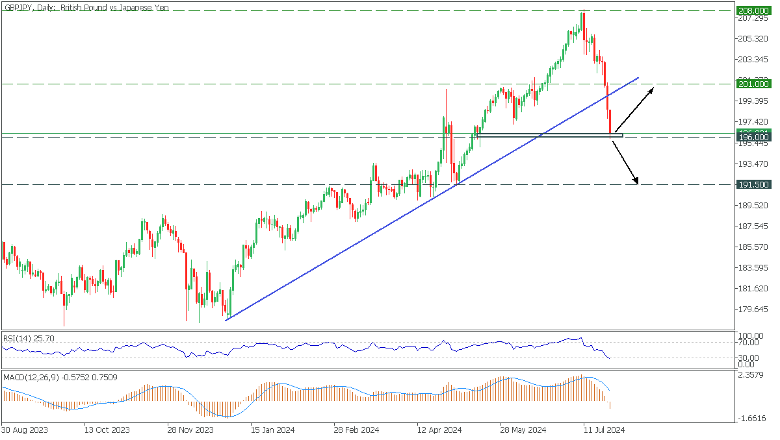
In the Daily timeframe, GBPJPY, after a long-term rise, broke the trend line and fell to critical support. Despite the trendline breakdown, RSI indicates a significant oversold condition. However, MACD shows further downside opportunities.
If the bears push the price below the 196.000 support, the downside target will be 191.500;
A rebound from support will bring GBPJPY back to resistance at 201.000;
USD/JPY Technical: Potential Mean Reversion Rebound in Progress Above 200-day MA
- Last week’s drop of 2.8% seen in the USD/JPY has almost reached a key support of 151.70.
- An overstretched decline with high volatility on top of an oversold condition increases the odds of a mean reversion rebound scenario for USD/JPY.
- Watch the potential upside trigger of 154.10 on the USD/JPY.
The price actions of the Japanese yen have indeed strengthened against the US dollar as highlighted in our analysis. The USD/JPY broke below 156.50 support last Tuesday, 23 July, and plummeted by 2.8%/435 pips to hit an intraday low of 151.94, just a whisker away from the next key support of 151.70 (also the 200-day moving average).
Right now, several technical factors are potentially advocating for at least a mean reversion rebound scenario to unfold ahead of this week’s major key risk events; the monetary policy decisions of the US Federal Reserve and Bank of Japan that will take place on Wednesday, 31 July.
Overstretched decline with high volatility condition
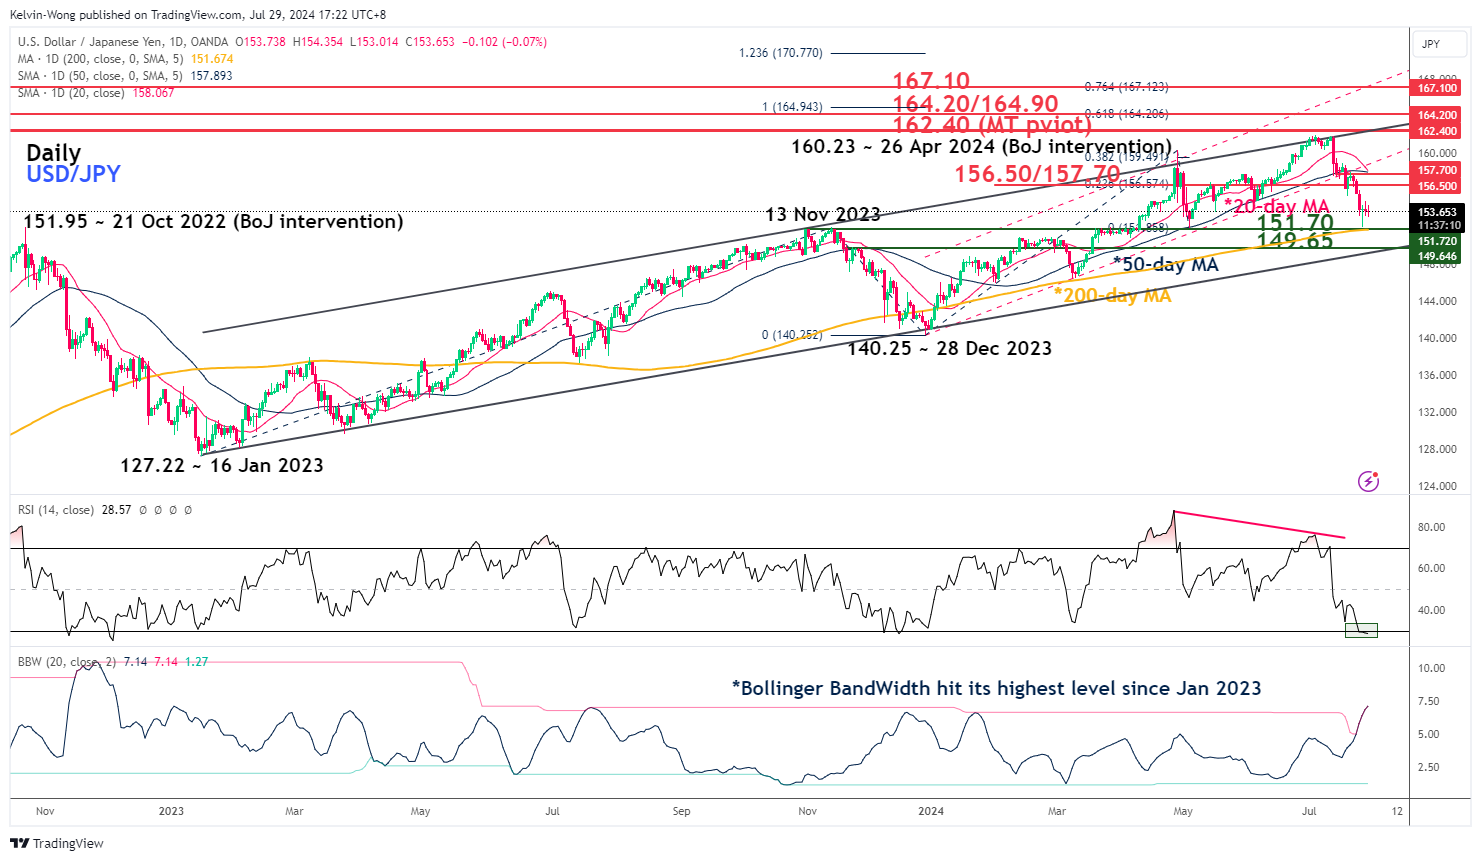
Fig 1: USD/JPY medium-term & major trend phases as of 29 Jul 2024 (Source: TradingView, click to enlarge chart)
The recent three consecutive weekly losses inflicted on the USD/JPY since its 52-week high of 161.95 printed on the week of 1 July has reached a high volatility overstretched condition as depicted by the Bollinger Band Width indicator (that measures the distance of the Bollinger Upper Bands and Lower Bands).
Based on its recent speed of decline seen in the USD/JPY, it has led the Bollinger Band Width to hit a significantly high level of 7.14 at this time of the writing, its highest level since early January 2023 which also implied that the price actions of USD/JPY have hit more than two standard deviations below its 20-day moving average.
In addition, the daily RSI oscillator has remained in an oversold condition of below 30 since last Wednesday, 24 July (see Fig 1).
These observations suggest that from a statistical standpoint, the odds have skewed toward a potential minor mean reversion rebound scenario within an ongoing medium-term downtrend phase of the USD/JPY as its price actions have breached below the 50-day moving average that supported prior dips since 15 March 2024.
Large speculators have trimmed extreme short positions on the JPY futures
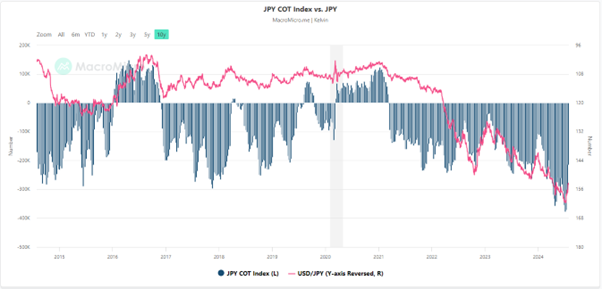
Fig 2: Commitments of Trader large speculators’ net positioning in JPY futures as of 22 Jul 2024 (Source: Macro Micro, click to enlarge chart)
Based on the Commitments of Traders data as of 22 July 2024 (compiled by Macro Micro), the aggregate net bearish open positions of large speculators in the JPY futures market after offsetting the aggregate positions of large commercial hedgers have been reduced by 43 percent to -215,876 contracts from a historical low of -378,768 as of 1 July 2024 (see Fig 2).
Given the reduction of large speculators’ net bearish open positions on the JPY futures from a prior extremely high level, the “fuel tanker” for another potential short squeeze has not been replenished yet which in turn lowers the odds of another leg of rally in the JPY against US dollar at this juncture.
Watch the 154.10 near-term resistance on the USD/JPY
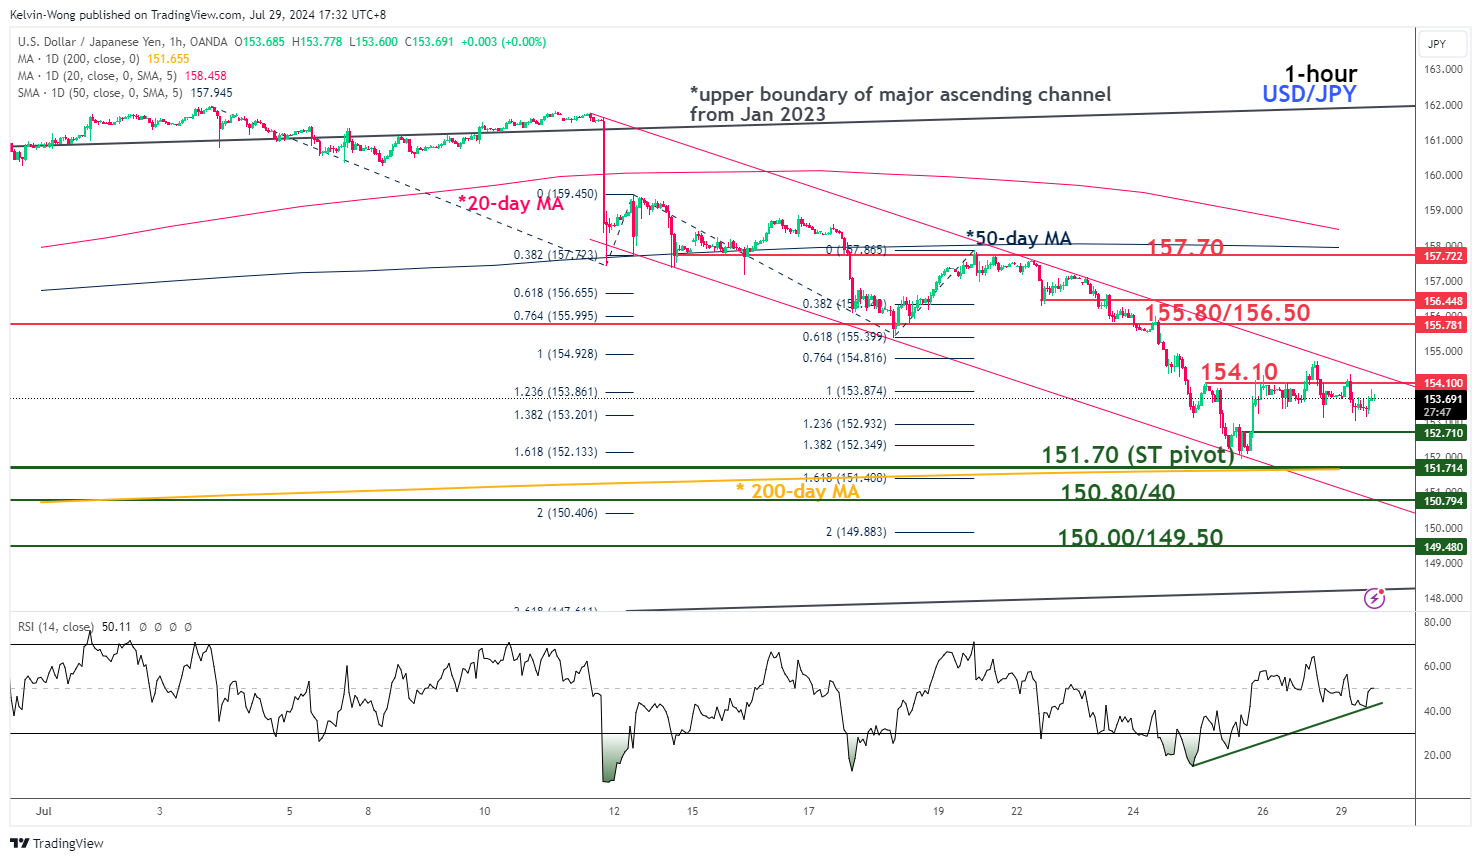
Fig 3: USD/JPY short-term trend as of 29 Jul 2024 (Source: TradingView, click to enlarge chart)
In the hourly chart of the USD/JPY, the recent two days of bounce since last Thursday, 25 July have faced a near-term ceiling at 154.10 (also the upper boundary of the minor descending channel from 11 July 2024 high) (see Fig 3).
A clearance above 154.10 increases the odds of the mean reversion rebound scenario for the next intermediate resistances to come in at 155.80/156.50 and 157.70.
However, a break below the 151.70 pivotal support invalidates the mean reversion rebound scenario for the continuation of the impulsive downmove sequence of the medium-term downtrend phase to expose the next intermediate supports of 150.80/40 and 150.00/149.50 in the first step.
USD/JPY Looking for Direction
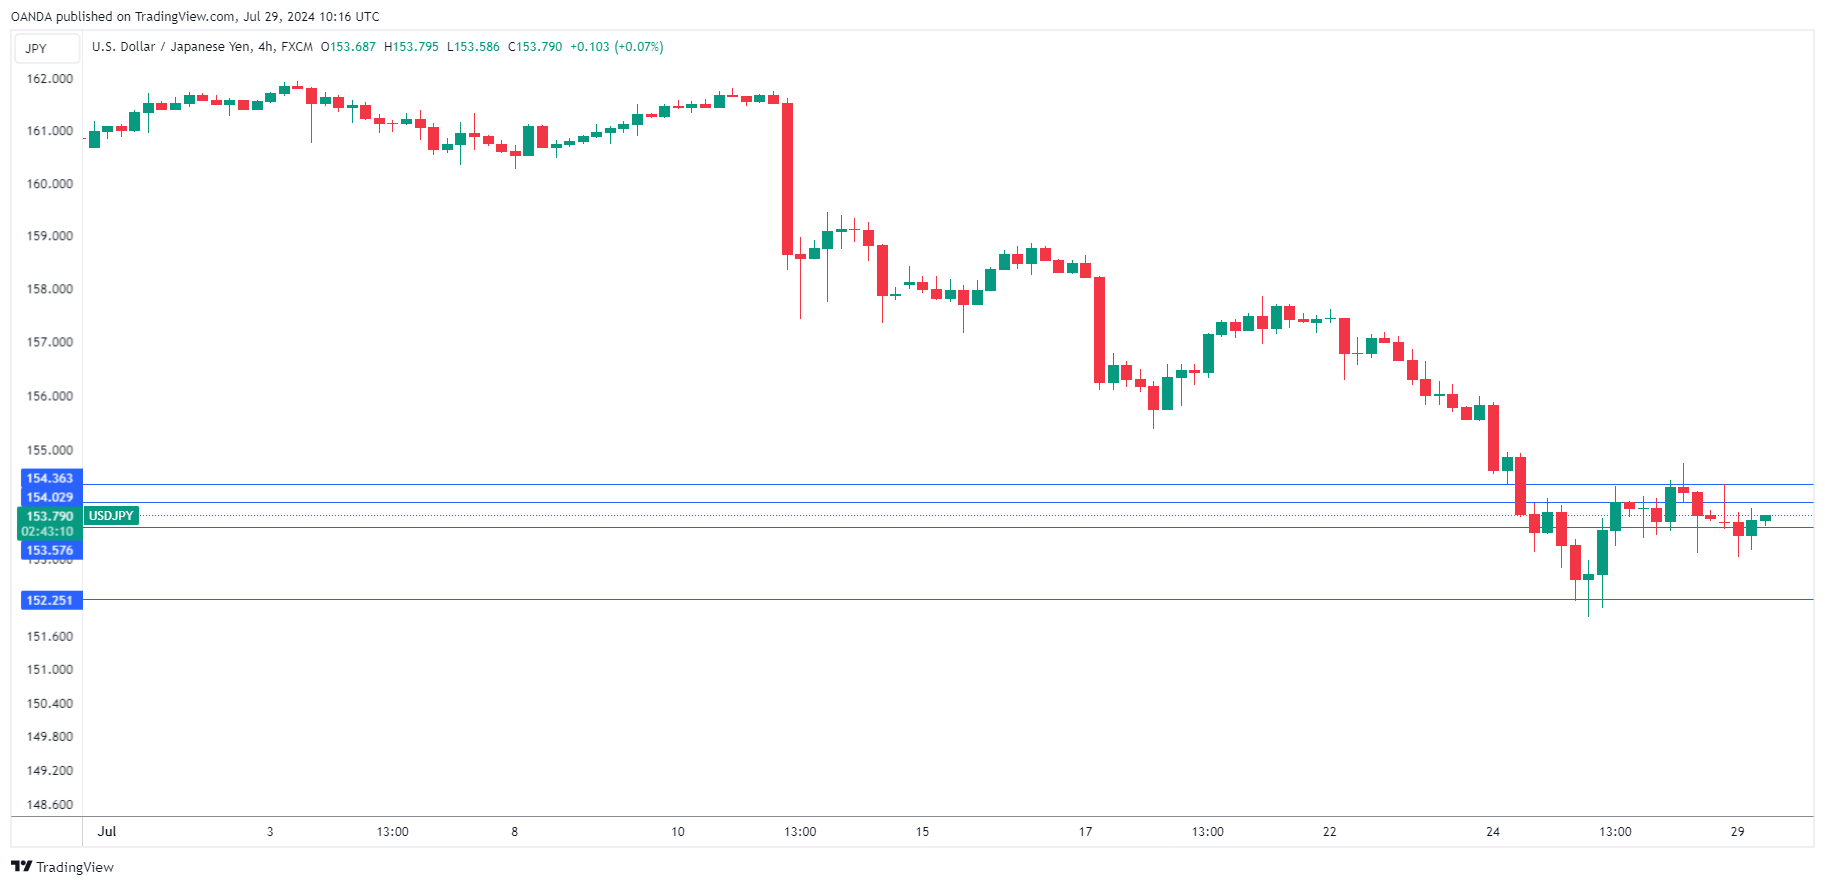
The Japanese yen continues to show volatility but has closed right where it started over the past few sessions. USD/JPY is trading at 153.65 in the European session, up 0.04% on the day. The yen is coming off an excellent week, surging 2.3% against the US dollar.
We’re unlikely to see much movement from the yen today, as there are no US releases on the calendar and only one minor release out of Japan.
The Federal Reserve meets later this week but the buzz in the market is around the September meeting. The Fed will meet on Wednesday and there have been a few voices calling for a rate cut, but it’s a virtual certainty that the policy makers will maintain the benchmark of between 5.25% and 5.50%.
The markets have priced in a rate hike in September for weeks but things have become interesting with the latest inflation release this past Friday. The PCE Price index ticked lower to 2.5% y/y in June, down from 2.6% in May and in line with expectations. Core PCE remained at 2.6%, just above the market estimate of 2.5%. Monthly, the news was very positive – the PCE Price index rose 0.1% and the core rate climbed 0.2%. As well, personal spending and income both eased in July.
The data shows that inflation is on a downtrend and that the spike in the first quarter was an aberration. As well, consumer spending is slowing. The markets have responded by raising expectations for a 50-basis point cut in September to 11.9%, compared to 3.8% one week ago, according to the CME’S FedWatch. A quarter-point cut is very likely, with a probability of 87.7%. The Fed could use this week’s meeting to set the stage for a cut at the September meeting, which means the markets will be closely monitoring the rate statement and Jerome Powell’s rate conference.
USD/JPY Technical
- USD/JPY has pushed past resistance at 154.03 and put pressure 154.36 before retreating
- 153.58 and 153.25 are the next support levels
USDSGD Elliott Wave: Calling the Decline From the Extreme Zone
Hello fellow traders. In this technical article we’re going to take a quick look at the Elliott Wave charts of USDSGD Forex pair , published in members area of the website. As our members know, USDSGD has recently given us 3 waves recovery against the 1.36703 peak. The pair has made a bounce in a 3-wave pattern, when sellers appeared right at the equal legs zone. Let’s break down our Elliott Wave forecast further in this article.
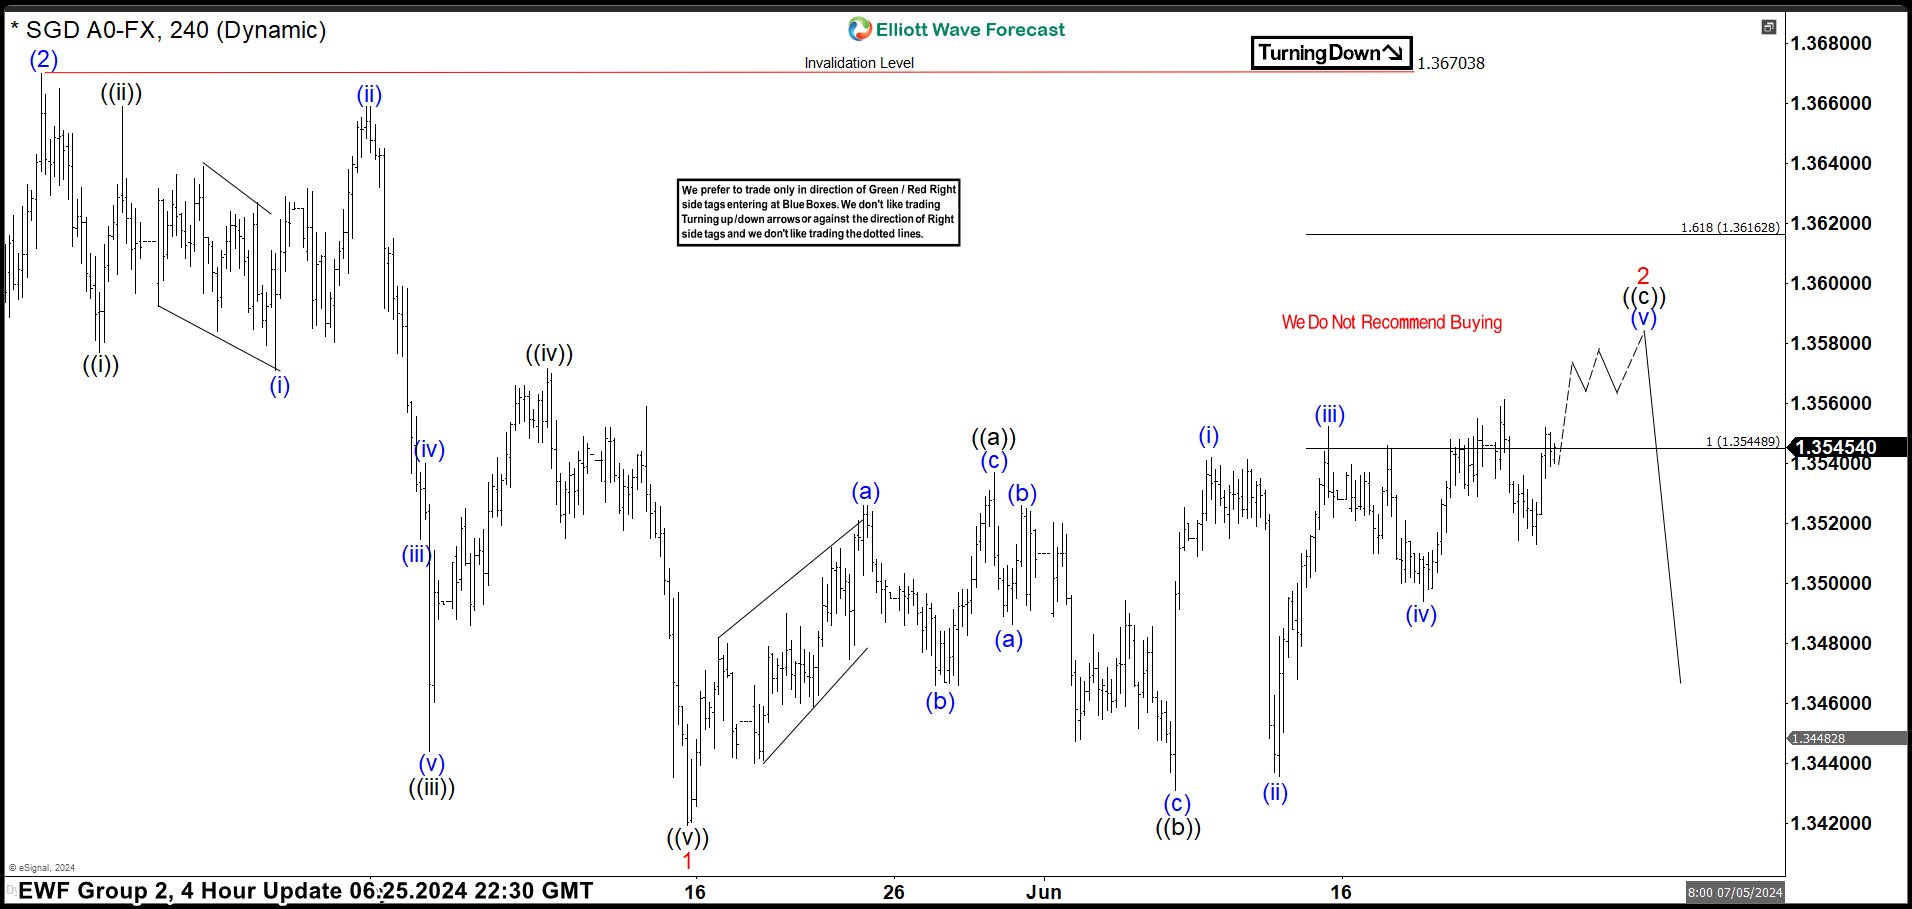
USDSGD H4 Update 06.25.2024
The current view suggests that USDSGD pair is doing a 2 red recovery, which is correcting the cycle from the 1.36703 peak. Proposed recovery can be unfolding as a Elliott Wave Flat Pattern . The price has already reached important technical area at 1.35448-1.36162. We expect potential sellers to appear in this area, which could lead to a further decline towards new lows or a three-wave pull back at least. We do not recommend buying this pair. Instead, we favor short positions from the marked area.
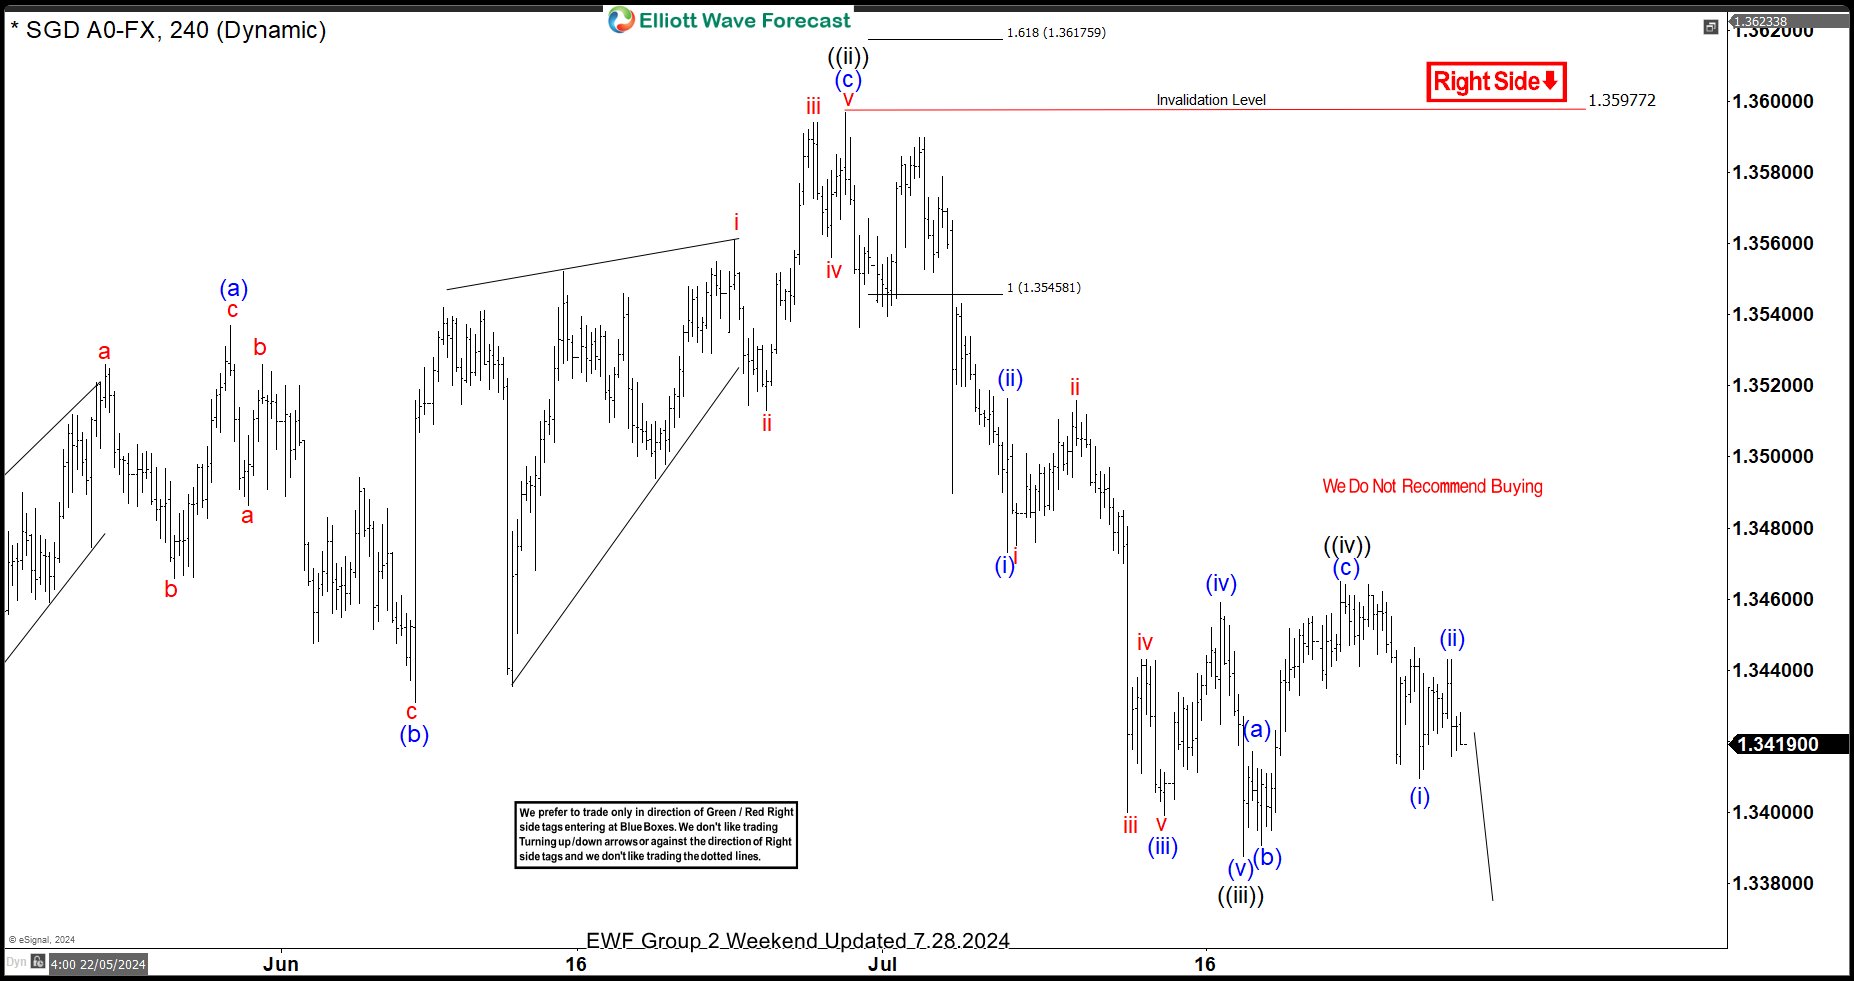
USDSGD H4 Update 07.28.2024
USDSGD has encountered sellers as expected, resulting in a significant decline from the Equal Legs zone. We believe the wave ((ii)) correction concluded at the 1.35977 high. The pair has broken the previous low, confirming that the next leg down is in progress. We advise against buying USDSGD during any suggested bounce and recommend favoring the short side. The optimal strategy is to sell the rallies in 3, 7, or 11 swings against the 1.35977 pivot.
GBP/USD Outlook: Bears Resume After a Brief Consolidation
Cable fell further at the beginning of the week, after larger bears paused for consolidation on Friday.
Current bets show 60% chance of BoE rate cut at Thursday’s policy meeting, which continues to weigh on sterling.
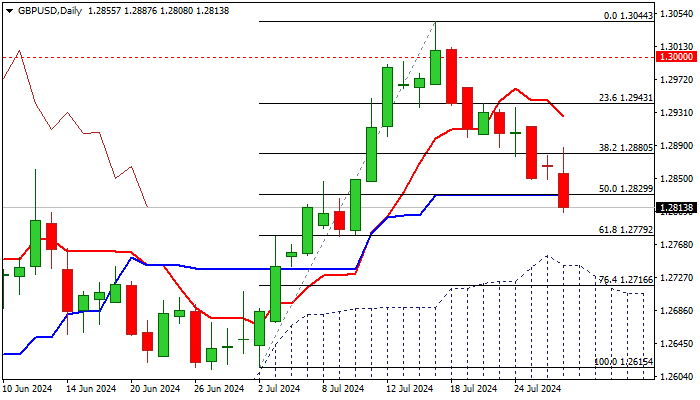
Technical picture on daily chart weakened further after Monday’s acceleration broke below 1.2830 pivot (50% retracement of 1.2615/1.3044 / daily Kijun-sen) with daily close below here to confirm fresh negative signal.
Targets at 1.2779 (Fibo 61.8%) and 1.2741 (daily Ichimoku cloud top) are now in focus, with south-heading daily indicators showing further space for extension lower, though limited correction to be anticipated in coming sessions as stochastic is deeply oversold.
Upticks should be capped under 1.2850/70 barriers, to offer better selling opportunities.
Res: 1.2830; 1.2880; 1.2910; 1.2943.
Sup: 1.2800; 1.2779; 1.2741; 1.2716.