Sample Category Title
Natural Gas Finds Support. But for How Long?
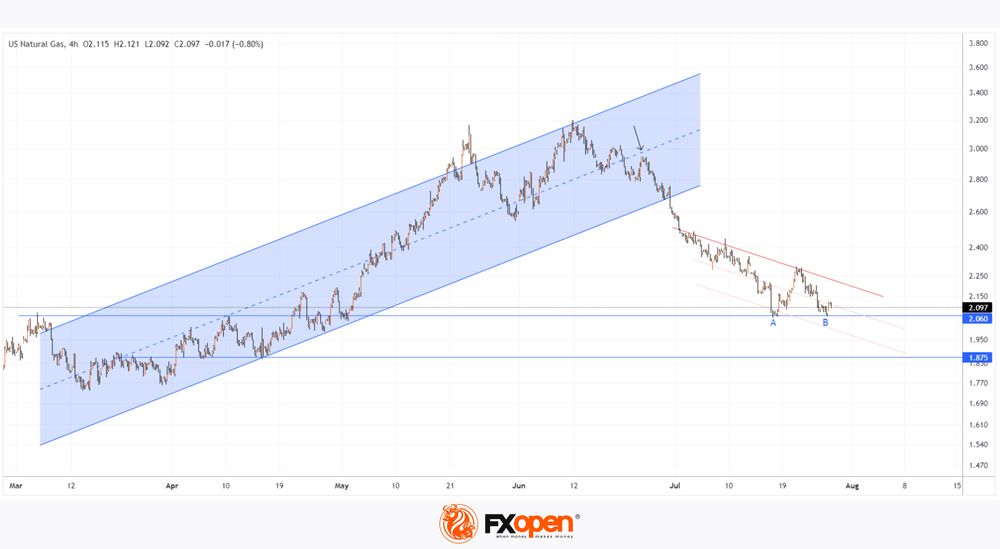
On 21 June, we wrote that the trend in the market was weakening, noting that:
→ Forecasts of a hotter summer, published during April-May, led to a sustained bullish trend in the natural gas market.
→ According to the technical analysis of the 4-hour XNG/USD chart and the signs of weakness that have formed on it, the level of 3.160 appears to sufficiently account for the risks of an extremely hot summer.
→ Bears might push the price to the lower boundary of the ascending trend channel.
Since then, the price of natural gas has:
→ tested the median of the ascending channel (shown by an arrow), which acted as resistance;
→ broken the lower boundary of the channel;
→ dropped to the level of 2.06 amid news of sufficient natural gas reserves in storage.
And, as the XNG/USD chart shows today, it is this level that is now forming signs of support for the market:
→ the lows A-B appear to be elements of an incomplete double bottom pattern;
→ the level of 2.06 acted as resistance in March-April, so support here is anticipated by technical analysts.
But can the bulls reverse the trend?
In the near future, the price of natural gas may consolidate within a narrowing triangle, formed by the support at 2.06 and the descending trend line (shown in red). It is possible that failures in any attempts to break through the red line will lead to a resumption of the downward trend and a subsequent decline in price towards the support at 1.875.
Start trading commodity CFDs with tight spreads. Open your trading account now or learn more about trading commodity CFDs with FXOpen.
This article represents the opinion of the Companies operating under the FXOpen brand only. It is not to be construed as an offer, solicitation, or recommendation with respect to products and services provided by the Companies operating under the FXOpen brand, nor is it to be considered financial advice.
BTC/USD Analysis: Price Rises Following Trump’s Statements
In our analysis of the long-term BTC/USD chart on 22 July, we noted that:
→ From a long-term perspective, Bitcoin's price is moving within an ascending channel (shown in blue);
→ On a shorter-term scale, the price has dropped from the upper to the lower boundary of the channel, forming a channel shown in red.
→ From a technical analysis standpoint, this red channel looks like a correction within the larger ascending channel.
→ Therefore, a breakout above the upper boundary of the red channel would pave the way for a resumption of the upward trend.
Today, Bitcoin’s price slightly exceeds the upper boundary of the red channel, influenced by Trump’s statements at the Bitcoin 2024 conference in Nashville. According to him:
→ The US should become the capital of cryptocurrencies;
→ If elected, Trump plans to fire Gary Gensler, the head of the SEC, known for his negative stance on cryptocurrencies.
→ Regulation will be more lenient, with potential reductions in sentences for cases related to cryptocurrencies.
However, objectively:
→ These statements are, so far, just campaign promises;
→ It is still too early to say that Bitcoin’s price has firmly established itself above the red channel. The nearby psychological level of $70k could have a significant impact.
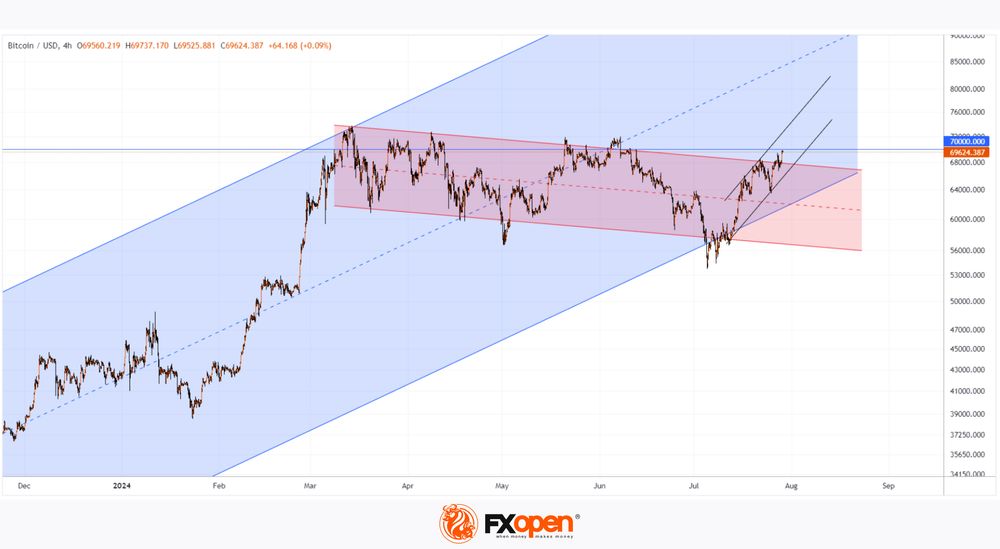
Technical analysis of the BTC/USD chart today shows that the price is moving upwards within a trajectory marked by black lines. How sustainable are these optimistic sentiments? Crucial information for analysis will come from Bitcoin’s price action during the week, which is filled with important events. Arguably, the most significant event is the Federal Reserve’s interest rate decision and subsequent comments from Powell, scheduled for Wednesday at 21:00 GMT+3.
FXOpen offers the world's most popular cryptocurrency CFDs*, including Bitcoin and Ethereum. Floating spreads, 1:2 leverage — at your service. Open your trading account now or learn more about crypto CFD trading with FXOpen.
*At FXOpen UK and FXOpen AU, Cryptocurrency CFDs are only available for trading by those clients categorised as Professional clients under FCA Rules and Professional clients under ASIC Rules respectively. They are not available for trading by Retail clients.
This article represents the opinion of the Companies operating under the FXOpen brand only. It is not to be construed as an offer, solicitation, or recommendation with respect to products and services provided by the Companies operating under the FXOpen brand, nor is it to be considered financial advice.
Crypto Market Gains on Heavyweights
Market picture
The crypto market cap has returned to its peak, which reached around $2.49 trillion a week ago, adding 3.3% in the last 24 hours. At this stage, the top coins are the lifting force for the market, with BTCUSD up 3.1%, Ethereum up 4.4%, and Solana up 5.5%.
Bitcoin’s price has reached $69.5K, its highest since mid-June. The Bitcoin 2024 conference tipped the scales in favour of the bulls. The technical picture speaks in favour of further upside, as the latest spurt came after a local shakeout that removed overbought conditions and broke the resistance of the descending channel.
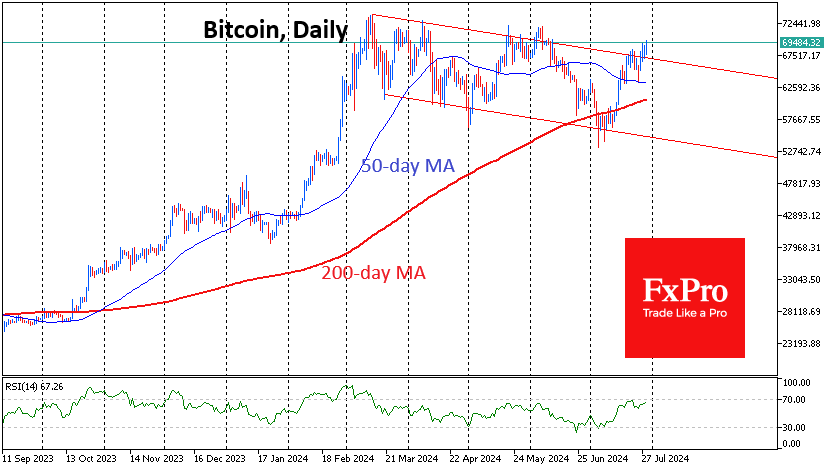
Ethereum is gaining momentum after pushing back from its 200-day moving average. Twice in the past month, the main altcoin got support on dips below this line. On Monday, the coin is testing the 50-day average, rising to $3380, the taking of which opens a fast route to $3500 and then $4000.
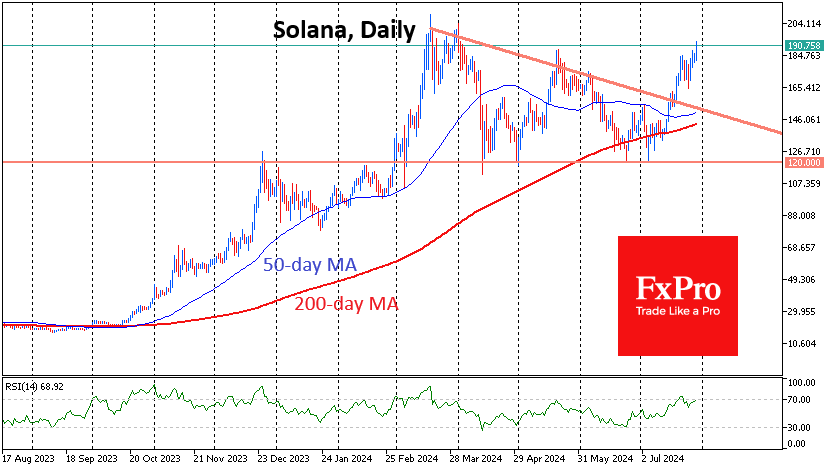
Solana is making steady progress upwards, reaching $192, its highest since early April. This shows a stronger recovery compared to Bitcoin and the broader market, where capitalisation is lower than the peak in early June.
News background
According to SoSoValue, net outflows from spot Ethereum-ETFs rose to $162.7 million on 26 July, continuing for a third day. Total assets under management (AUM) fell to $8.97 billion. In the three days since the ETF was approved, investors have withdrawn $1.6 billion or 17% of AUM from Grayscale’s ETHE.
Solana (SOL) surpassed BNB in market capitalisation and ranked fourth on CoinMarketCap.
Donald Trump, during a speech at the annual Bitcoin 2024 conference in Nashville, promised to fire SEC head Gary Gensler and create a strategic Bitcoin reserve if elected. He also said he would be a “pro-Bitcoin” president and would not allow any of the 213,239 BTC seized by authorities and held in US government wallets to be sold. According to Trump, the US will become the world’s cryptocurrency capital.
Former NSA and CIA employee Edward Snowden expressed serious concerns about BTC privacy issues during a speech at Bitcoin 2024. He reminded attendees that despite the common misconception, Bitcoin transactions are not completely anonymous because they can be traced back to specific individuals.
Hardware wallet maker Ledger unveiled its new Ledger Flex device at the Bitcoin 2024 conference. The Ledger Flex features an NFC and an E-Ink touchscreen.
AUD/USD Gains Amid Anticipation for Key Economic Data
The AUD/USD pair is climbing towards 0.6552 on Monday. The Australian dollar is bouncing back from a 12-week low as investors await Australian inflation data.
In the past two weeks, the AUD, in the currency pair with the USD, has fallen more than 3%. This happened amid a global sell-off in risky assets and also due to weak reports from China.
This week, the release of crucial price statistics will significantly influence the Reserve Bank of Australia's future course of action. Inflation is expected to have accelerated slightly in Australia in Q2 2024. For example, for April-June, inflation could have risen by 1.0% QoQ, the same as before. In annualised terms, it could accelerate to 3.8% from 3.6% previously. The data will be released on Wednesday.
This week, Australia's macroeconomic calendar will be particularly active. The release of reports on last quarter's retail sales, trade balance, exports and imports, and the producer price index will provide crucial insights into the economy. The stronger the data, the better – especially amid China's economic weakness, Australia's main economic partner. In this context, it is essential to remain resilient.
Currently, the market estimates the probability of the RBA interest rate hike in August to be 20%.
AUD/USD technical analysis
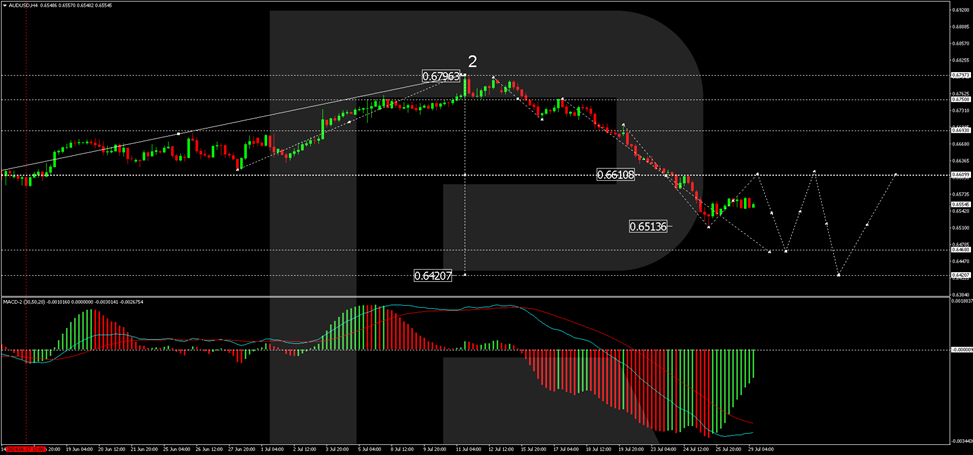
On the H4 chart of AUD/USD, the market performed a wave of decline to 0.6513. Today, it is relevant to consider the probability of correction development to the level of 0.6609. After the correction is completed, we will consider the likelihood of trend continuation to the level of 0.6468 with the prospect of trend continuation to the level of 0.6420. Technically, such a scenario is confirmed by the MACD indicator. Its signal line is under the zero mark and is directed strictly downwards.
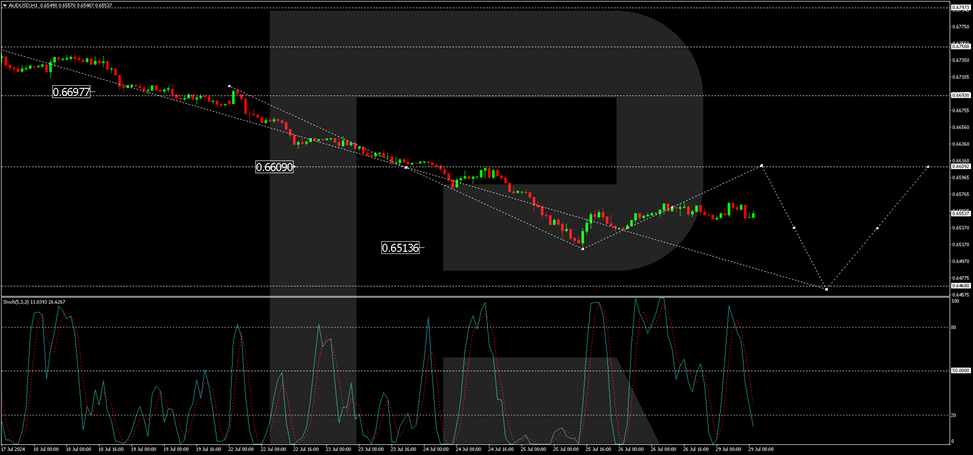
On the H1 AUD/USD chart, the market is forming a consolidation range around the level of 0.6561. In case of an upside exit, the potential of a wave to the level of 0.6609 will open. In case of a downward exit, we will consider the continuation of the wave to the level of 0.6468. The target is local. Technically, this scenario is confirmed by the Stochastic oscillator. Its signal line is under 50 and is directed strictly downwards to 20.
WTI Outlook: Oil Price Rises on Growing Geopolitical Tensions But Still Holding Under Key Resistances
WTI oil opened with gap higher on Monday, as supply worries rose after the latest escalation of the conflict in the Middle East, which threatens of deepening crisis.
The price bounced from last week’s low, retracing around 50% of Friday’s 2.4% drop, but so far holding within a narrow range.
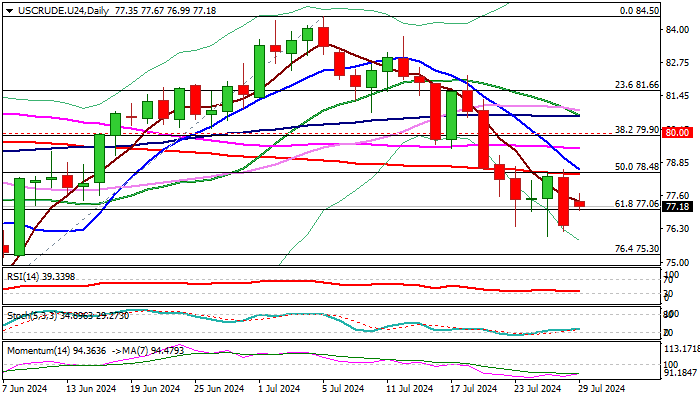
Bearish technical studies on daily chart suggest limited prospects for stronger recovery, with key barriers at $78.31/39 (daily cloud base / 200DMA) likely to cap extended upticks and keep near term bias with bears.
Oil was in a steep fall in past three weeks and on track for bearish monthly close in July, that adds to negative signals, with limited upticks to provide better selling opportunities.
Strong negative momentum on daily chart and MA’s in full bearish setup (converging 10/200DMA’s are likely to create a death-cross) support the notion, with repeated close below $77.06 (Fibo 61.8% of $72.46/$84.50) to confirm bearish signal and expose next targets at $75.30/00 (Fibo 76.4% / psychological).
Only firm break above 200DMA which capped the action in past five days, would harm larger bears and open way for stronger correction.
Res: 77.67; 78.39; 78.59; 79.13.
Sup: 77.06; 76.02; 75.30; 75.00.
Will Fed Signal a September Rate Cut?
- Fed sees inflation on a path to remain low
- Investors expect three 25bps rate cuts by January
- Fed to keep rates untouched, focus on guidance
- The decision is published on Wednesday at 18:00 GMT
Data bolster Fed’s confidence
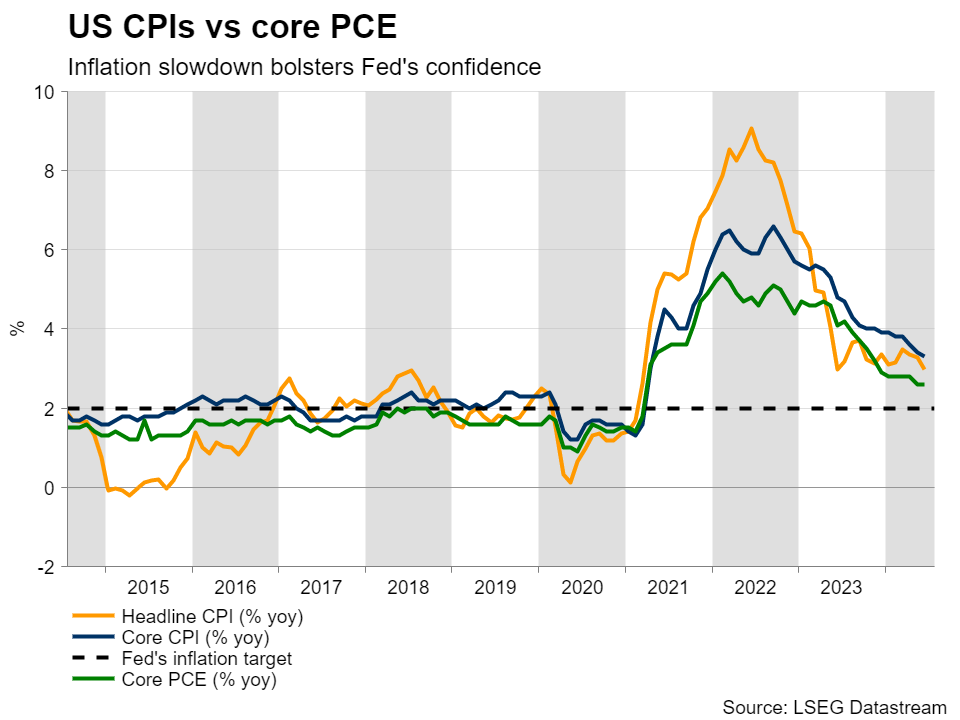
At its latest gathering in June, the FOMC appeared more hawkish than expected, revising its interest rate projections from three quarter-point reductions by the end of the year to just one. That said, the softer-than-expected CPI numbers for May a few hours ahead of the decision did not convince market participants about policymakers’ intentions.
Since then, the employment report for June revealed further softness in the labor market, while the CPI numbers for June also fell short of expectations, prompting several officials, including Chair Powell, to note that the data are bolstering their confidence that price pressures are on a sustainable path to remain low. Powell also said that they will not wait until inflation hits 2% to cut interest rates.
Are investors’ bets overly dovish?
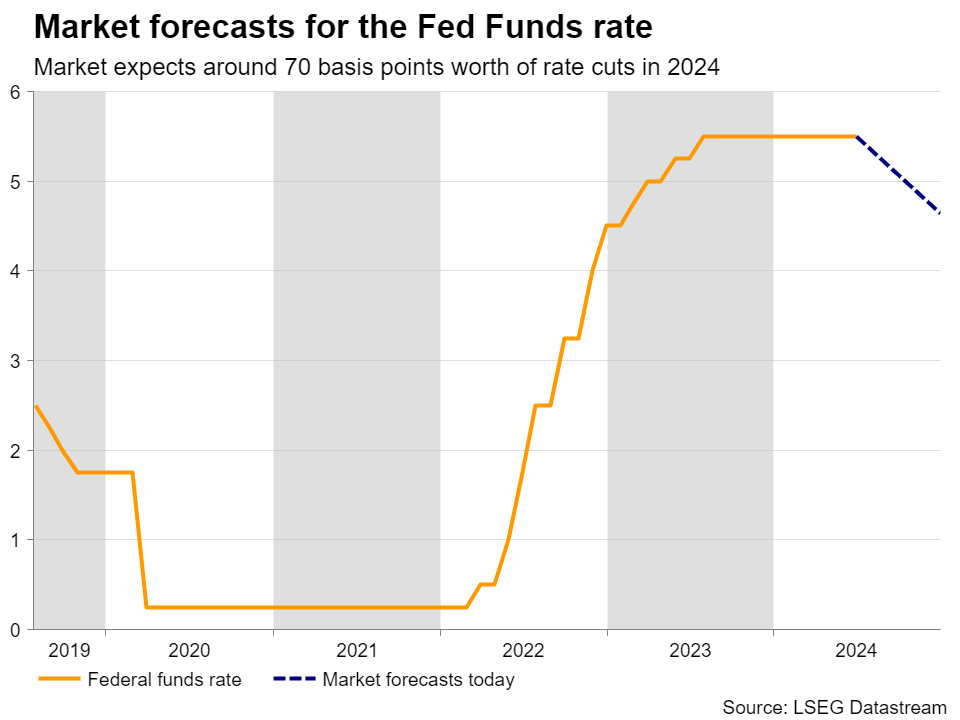
All these developments encouraged investors to fully price in a September quarter-point cut and more than two by the end of the year. Fed funds futures are pointing to a strong 80% chance for a third reduction, which is fully priced in for January.
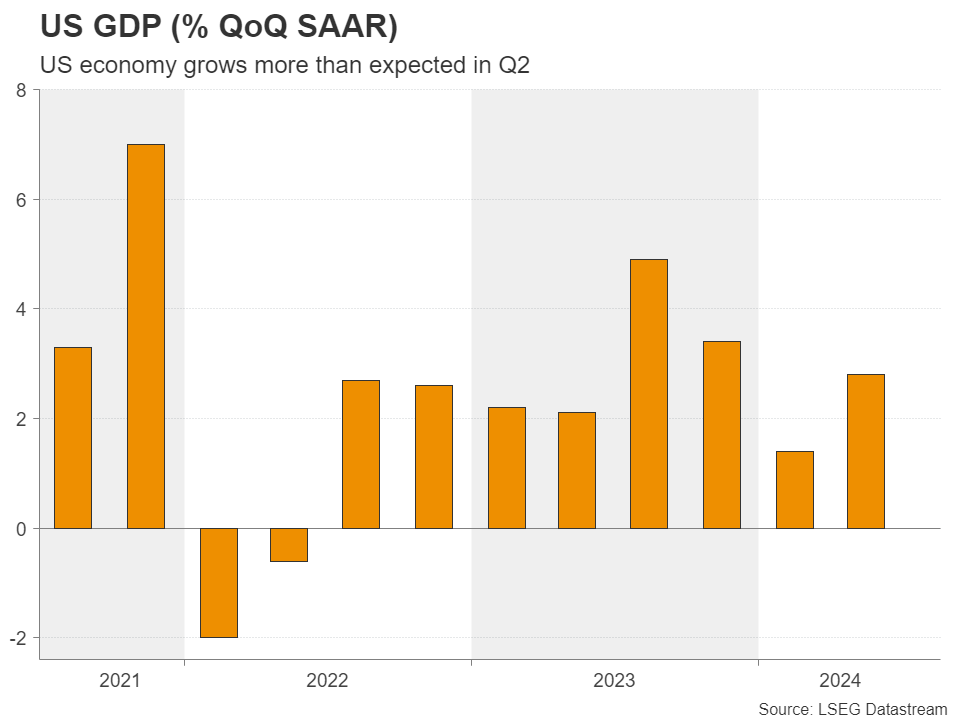
Nonetheless, with the flash PMIs for July pointing to further improvement in business activity, despite the manufacturing sector falling back into contraction, and the first estimate of GDP for Q2 suggesting that the economy fared much better than it did in Q1, investors’ rate cut bets may be overly dovish.
Fed meeting awaited for fresh clues
The next test for market participants’ views on the Fed’s future course of action may be next week’s Fed policy gathering. It will be one of the meetings that is not accompanied by updated economic projections and thus, bearing in mind that no policy action is expected at this meeting, the spotlight is likely to fall on the statement and Chair Powell’s conference on hints and clues about whether a September cut is indeed a done deal and what are their plans thereafter.
Former New York Fed President William Dudley, who was advocating for higher rates earlier this year, has had a change of heart, noting on Wednesday that the Fed should cut preferably at next week’s meeting. Although Dudley is not a Committee member anymore, his 180-degree turn may be some sort of indication that the July meeting may have a more dovish tilt than the one held in June.
Having said all that though, even if Powell and Co. appear more dovish, opening the door to a September reduction and perhaps hinting at another one in December, the dollar is unlikely to fall much as this scenario is already fully priced in. It could actually rebound if there is the slightest sign that a second rate cut this year is not a done deal and may depend on upcoming data.
Euro/dollar could resume slide
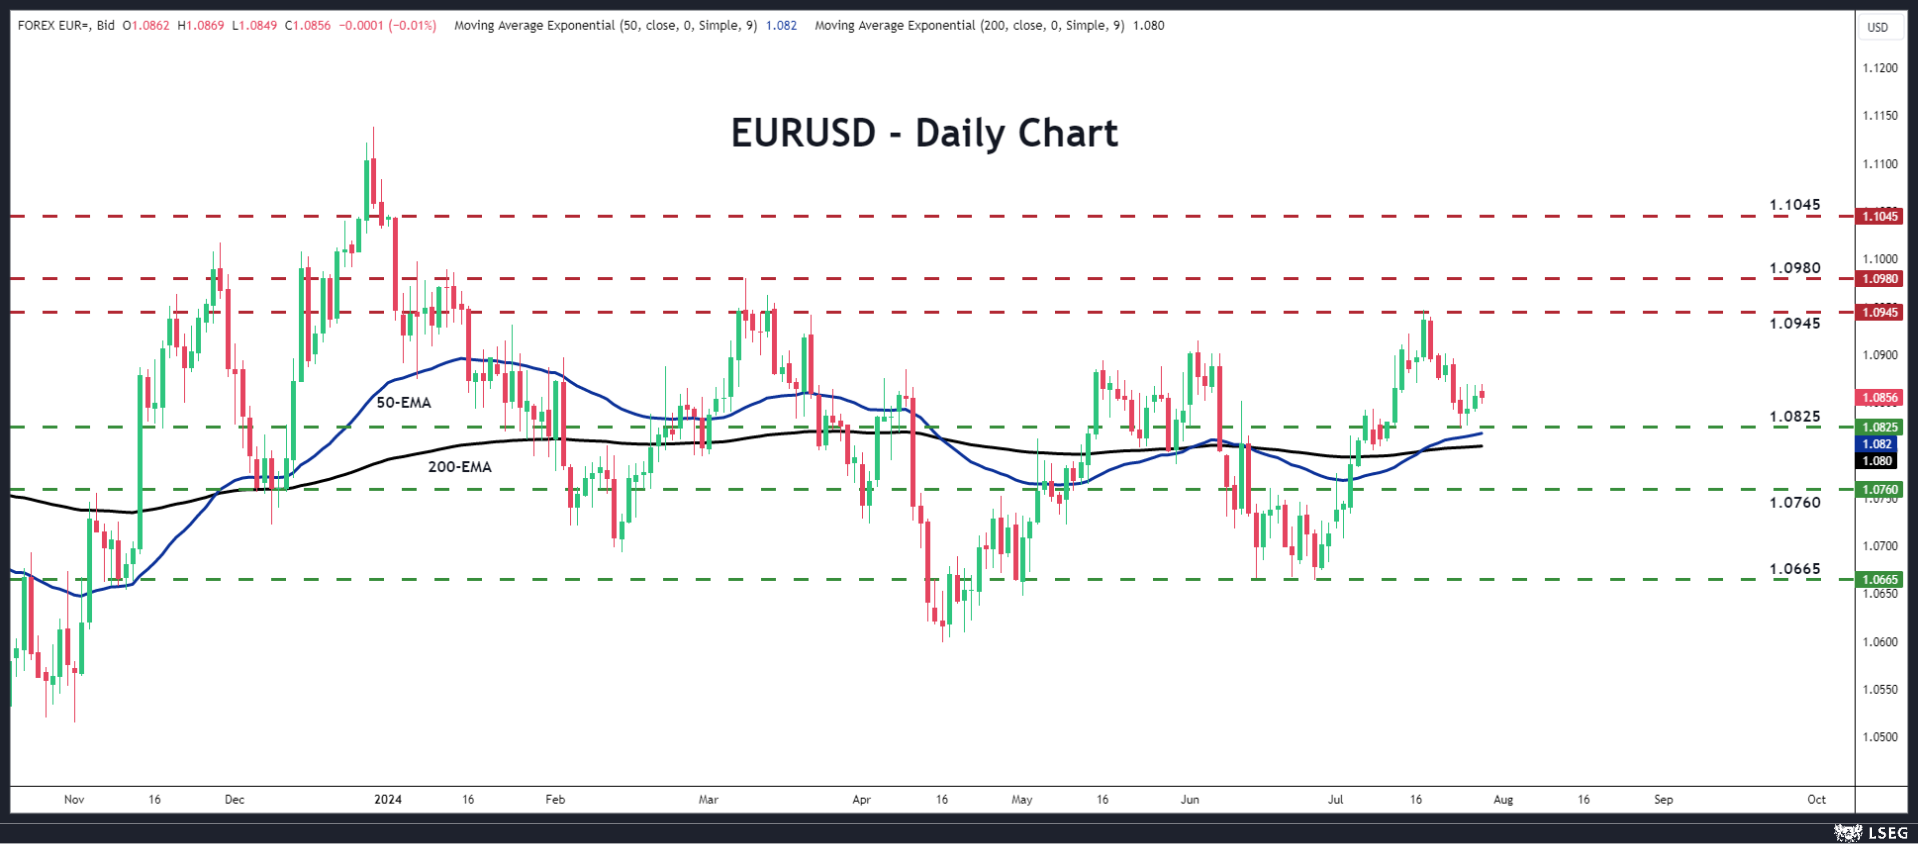
Should the upside risks materialise, euro/dollar is likely to come under renewed pressure, with the bears perhaps aiming for the 1.0760 zone. If there are no buyers to be found there, a break lower could encourage extensions towards the 1.0665 zone, which acted as a key support barrier on June 14 and 26.
For the outlook of euro/dollar to start being considered bullish, a decisive close above 1.0945 may be needed. This could encourage buyers to challenge the 1.0980 barrier, marked by the high of March 8, the break of which could allow advances towards the high of January 2, at 1.1045.
Gold Bounces Off 50-Day SMA
- Gold was retreating from its all-time high
- But the 50-day SMA prevented further declines
- Despite latest weakness, oscillators remain neutral-to-positive
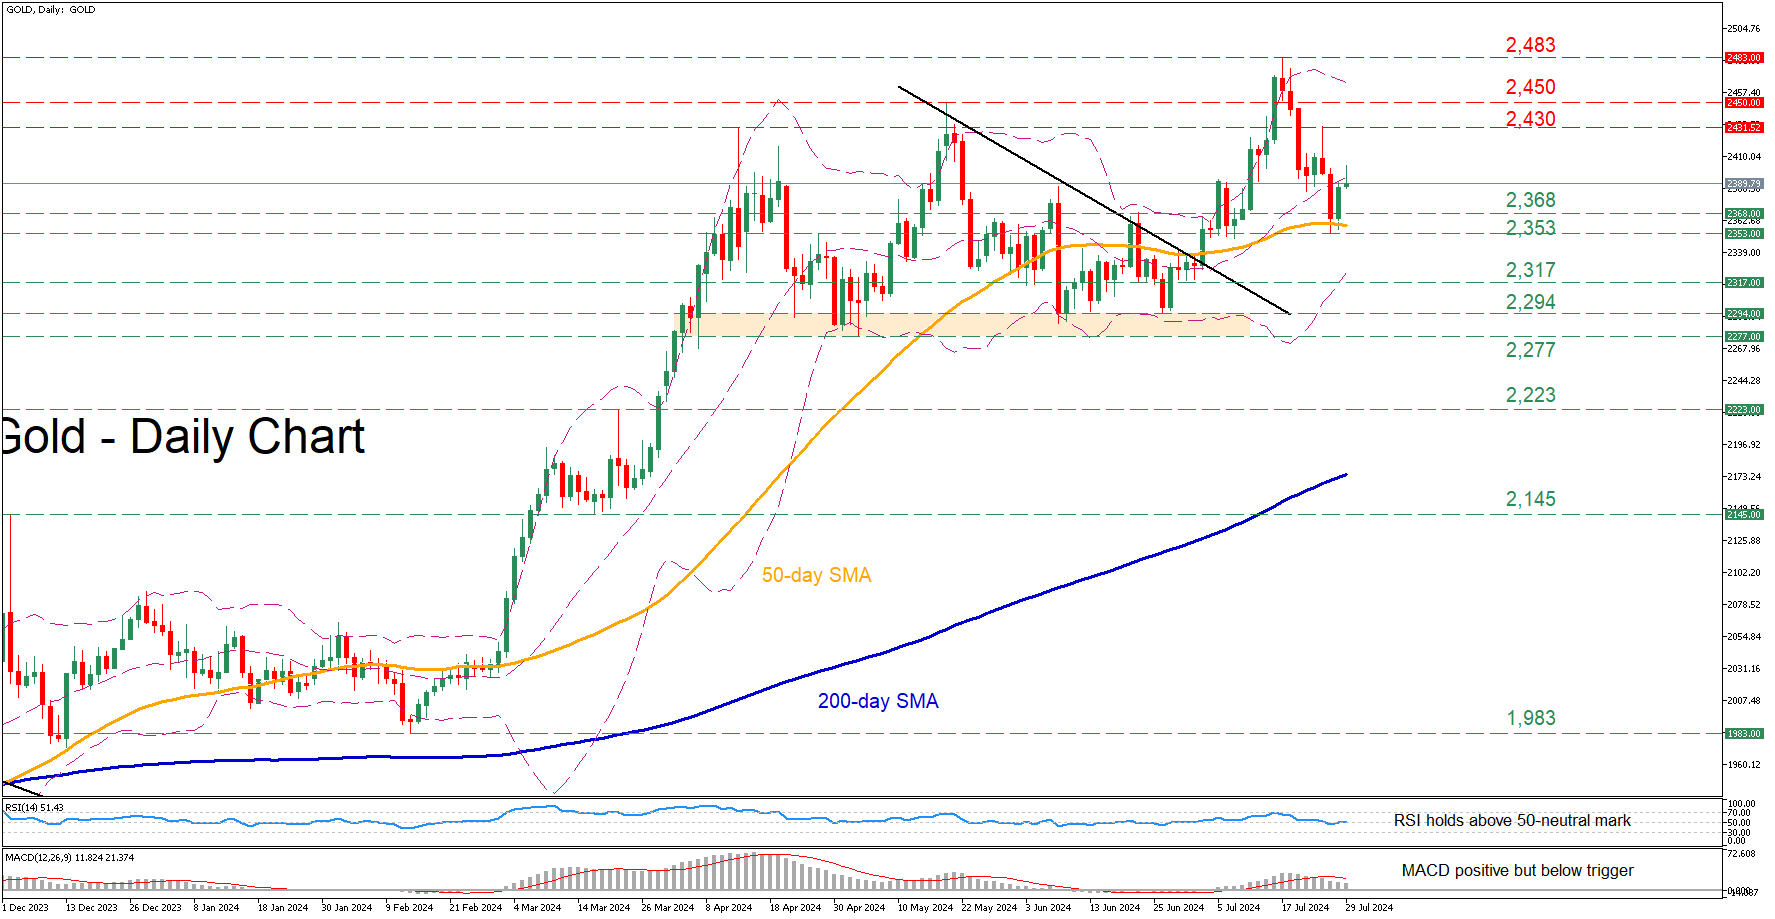
Gold had been in a strong uptrend since late May, which led to a fresh all-time high of 2,483 on July 17. Although bullion has been experiencing a significant pullback since then, the 50-day simple moving average (SMA) seems to be capping its downside for now.
Should the recent bounce off the 50-day SMA turn into a rebound, immediate resistance could be found at the April high of 2,430. Conquering this barricade, the bulls may attack the May high of 2,450. A violation of that zone could pave the way for the recent record peak of 2,483.
On the flipside, if gold reverses back lower, the previous resistance zone of 2,368 could act as the first line of defence. Failing to halt there, the price could descend towards the recent support of 2,353, which lies very close to the 50-day SMA. Further declines could then stall at 2,317, a region that provided downside protection both in June and July.
In brief, gold has come under significant selling pressure following its trip to a fresh all-time high. However, it’s too early to call for a sustained correction, especially as long as the 50-day SMA holds its ground.
USD/CAD: Bullish Impulse Calling for Breakout
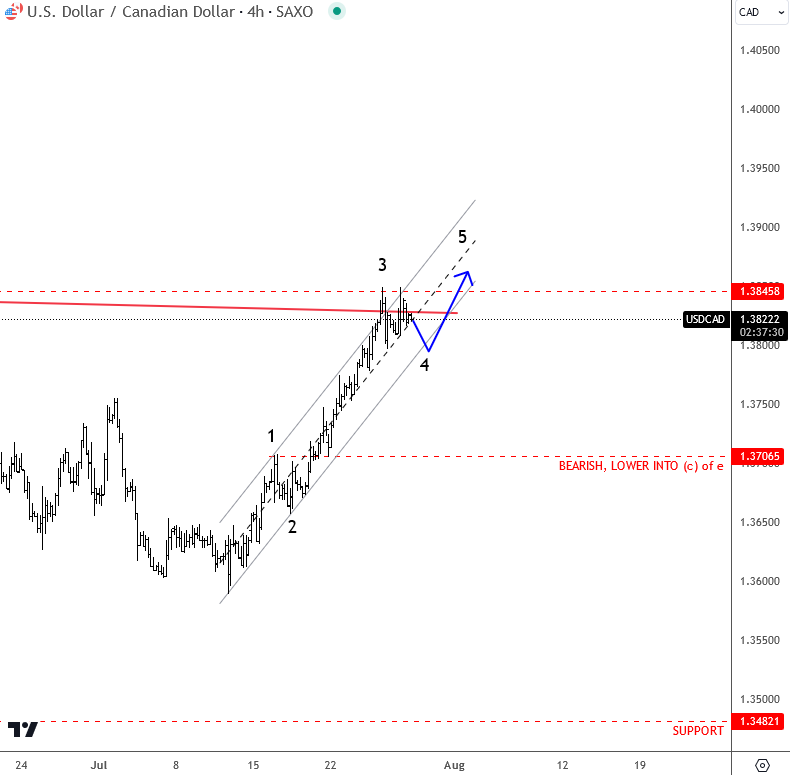
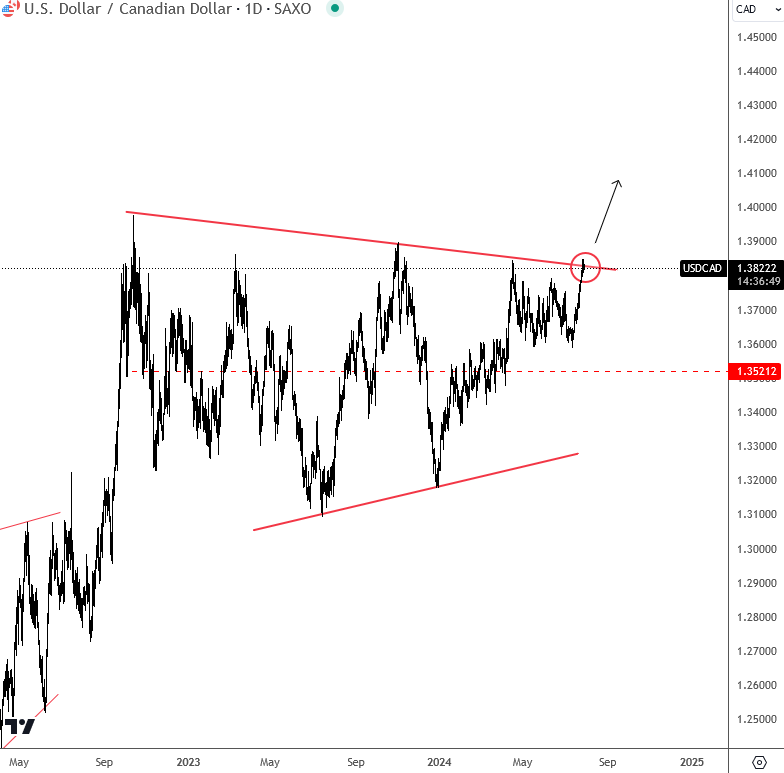
USDCAD is making a pretty strong rise after the Bank of Canada lowered rates by 25 basis points as expected last week. The price is now testing the major trend line resistance of this triangle on the daily chart, and we are wondering if we can see a breakout, which is certainly possible in a risk-off environment, with lower stocks and alos lower crude oil. Looking at the 4-hour time frame of USDCAD, there's even a chance that the rise from July 11th is an ongoing impulse, and that the current pause down from 1.3845 resistance is wave four, which will eventually push the price higher later this week, through resistance and into wave 5.
A daily close above 1.39 or so, will likely put much more upside pressure on the pair, as a major breakout could then be happening on the daily time frame.
https://www.youtube.com/watch?v=zNEwW5t9N-w
GBP/JPY Daily Outlook
Daily Pivots: (S1) 196.72; (P) 197.93; (R1) 198.96; More...
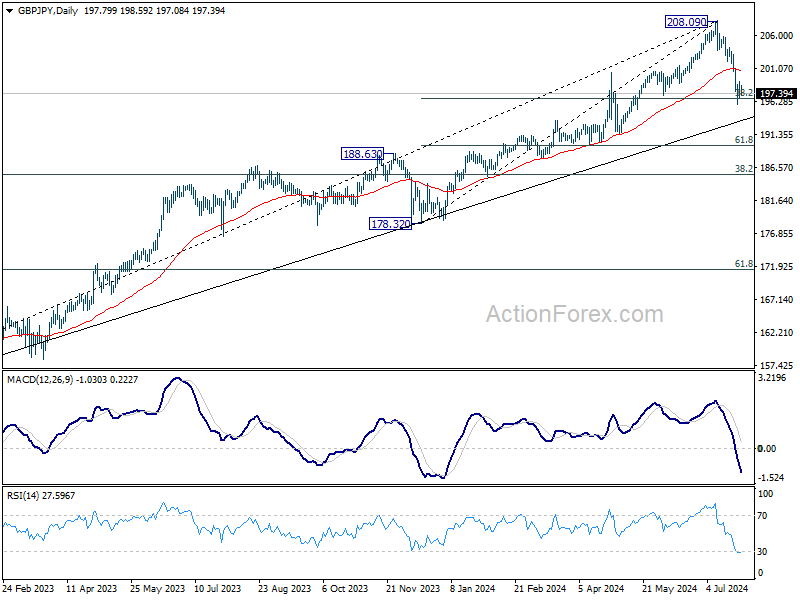
Intraday bias in GBP/JPY remains neutral for consolidations above 195.84 temporary low. Further decline is expected as long as 202.08 support turned resistance holds. On the downside, sustained trading below 38.2% retracement of 178.32 to 208.09 at 196.71 will argue that larger scale correction is under way to 185.49 fibonacci level.
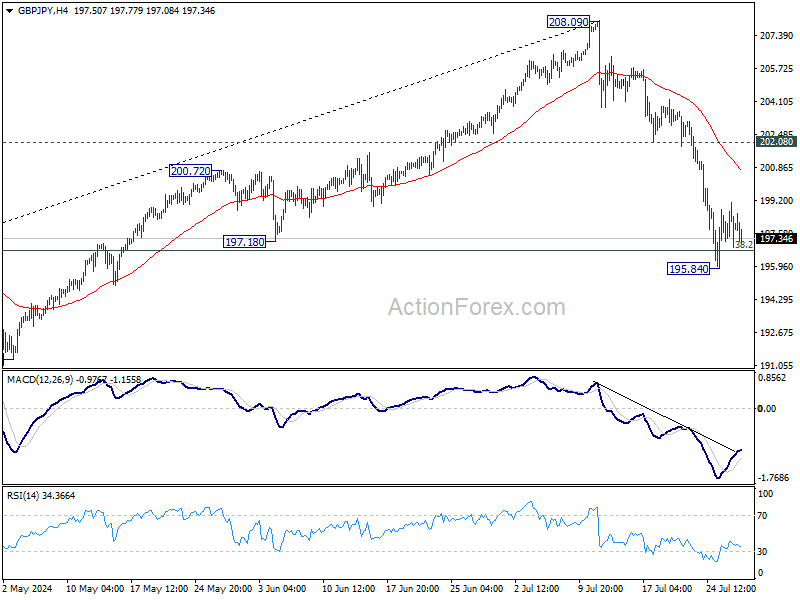
In the bigger picture, considering bearish divergence condition in W MACD, 208.09 might be a medium term top and fall from there could already be correcting whole up trend from 148.93 (2022 low). Risk will now stay on the downside as long as 55 D EMA (now at 200.78) holds. Sustained break of 196.71 will pave the way to 38.2% retracement of 148.93 to 208.09 at 185.49.
EUR/JPY Daily Outlook
Daily Pivots: (S1) 166.19; (P) 167.10; (R1) 167.87; More...
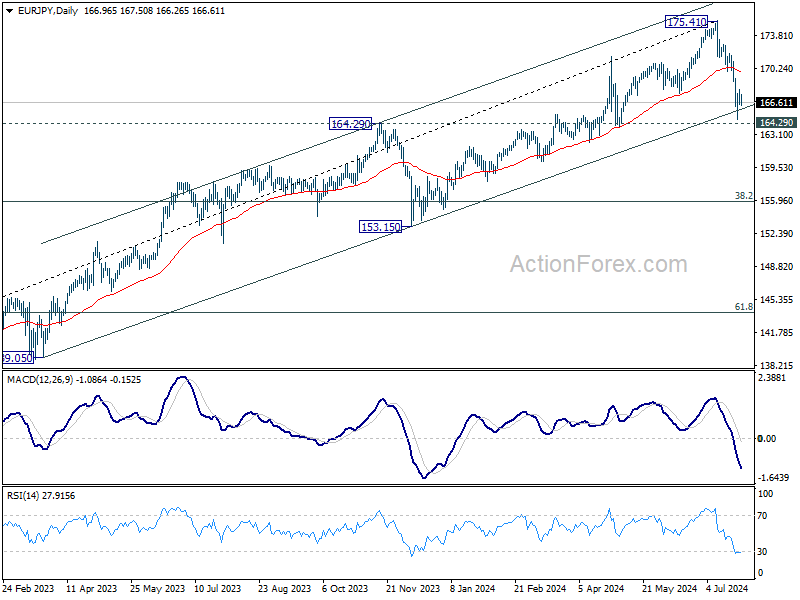
Intraday bias in EUR/JPY stays neutral for consolidations above 164.81 temporary low. Outlook will remain bearish as long as 169.98 resistance holds. On the downside, decisive break of 164.29 support turned resistance will indicate that larger scale correction is underway for 155.91 fibonacci level.
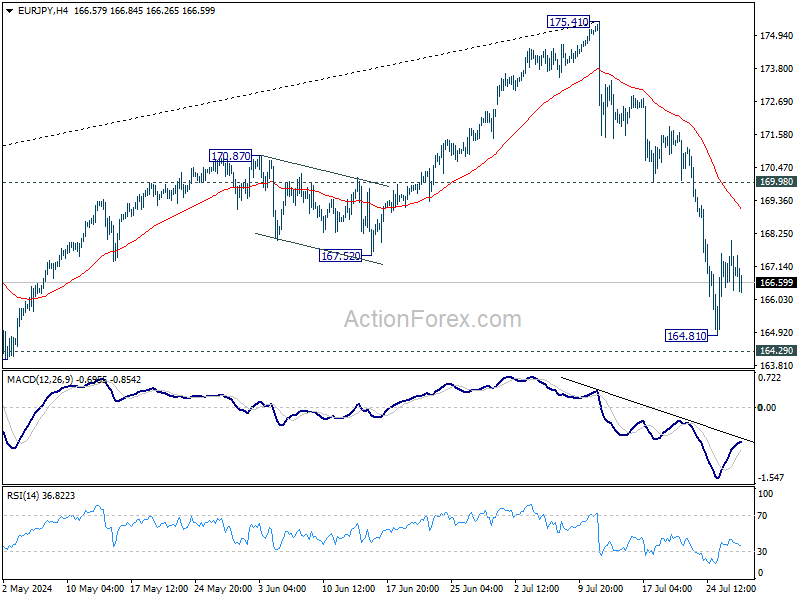
In the bigger picture, immediate focus is on 164.29 resistance turned support. Strong rebound from there will retain medium term bullishness for resuming the up trend through 175.41 at a later stage. However, decisive break of 164.29 will indicate that fall from 175.41 is at least correcting the rise from 124.73, with risk of bearish trend reversal. Deeper decline would be seen to 38.2% retracement of 124.37 to 175.41 at 155.91.