Sample Category Title
EUR/USD Targets New Gains: Is a Fresh Increase on the Horizon?
Key Highlights
- EUR/USD found support near the 1.0825 zone.
- It cleared a connecting bearish trend line with resistance at 1.0860 on the 4-hour chart.
- Crude oil prices could continue to move down toward $75.00.
- Bitcoin is rising and might soon test the $70,000 resistance.
EUR/USD Technical Analysis
The Euro started a downside correction from the 1.0950 zone against the US Dollar. EUR/USD dipped below 1.0900 before the bulls appeared.
Looking at the 4-hour chart, the pair tested the 1.0825 support zone and remained stable above the 200 simple moving average (green, 4-hour). A low was formed at 1.0825 and the pair is now rising. There was a move above a connecting bearish trend line with resistance at 1.0860.
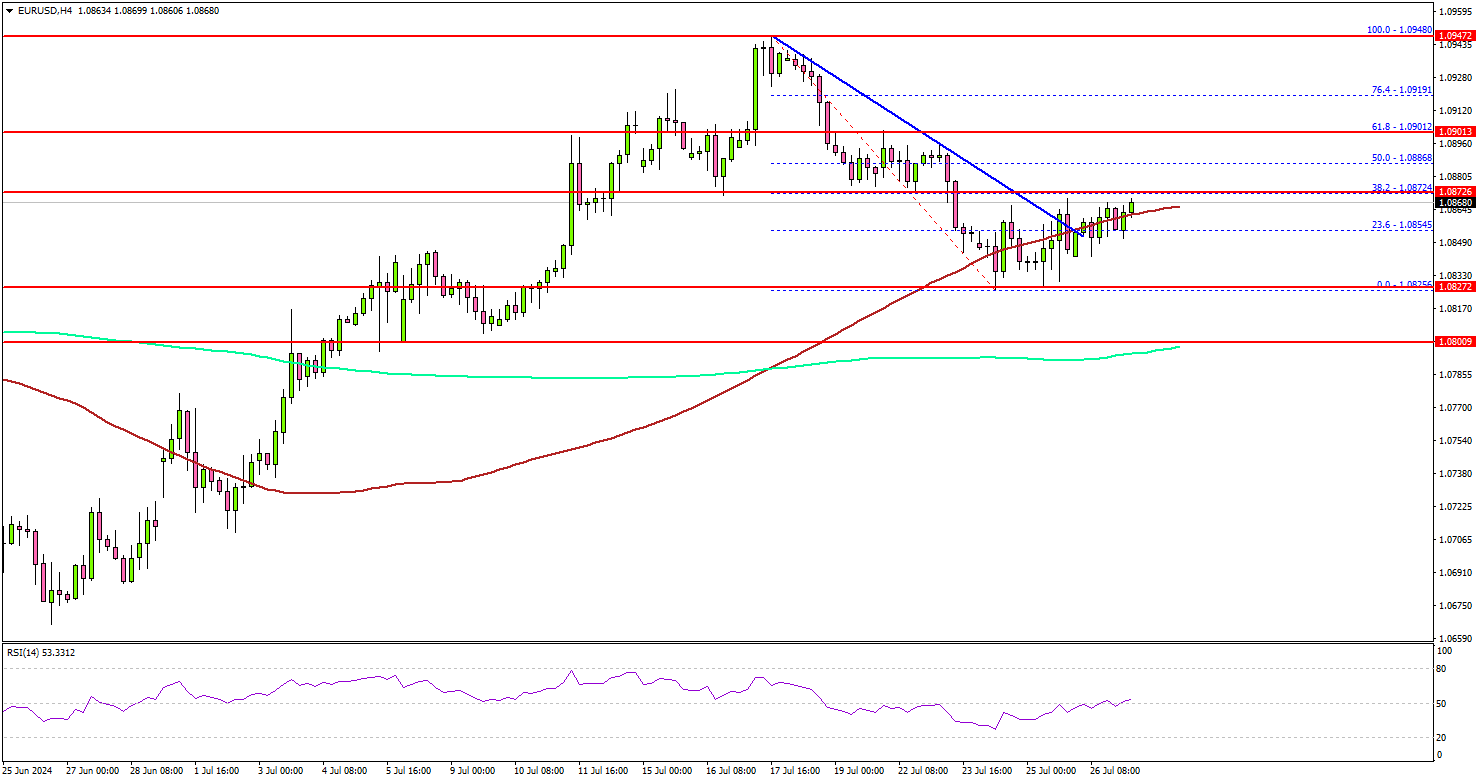
The pair climbed above the 100 simple moving average (red, 4-hour). It is now testing the 38.2% Fib retracement level of the downward move from the 1.0948 swing high to the 1.0825 low.
On the upside, the pair could face resistance near the 1.0875 level. The next resistance sits at 1.0900 or the 61.8% Fib retracement level of the downward move from the 1.0948 swing high to the 1.0825 low.
The main hurdle sits at 1.0920. A clear move above the 1.0920 resistance might send it toward the 1.0950 level. Any more gains might open the doors for a test of the 1.1000 zone in the coming days.
Immediate support is near the 1.0845 level. The next major support is near the 1.0820 level. A downside break and close below the 1.0820 support zone could open the doors for more losses. In the stated case, EUR/USD might decline toward the 1.0750 level.
Looking at Bitcoin, the bulls came into action and they seem to be aiming for a test of the $70,000 resistance zone.
Economic Releases
- Dallas Fed Manufacturing Business Index for July 2024 – Forecast -15.0, versus -15.1 previous.
Gold Bent But Not Yet Broken
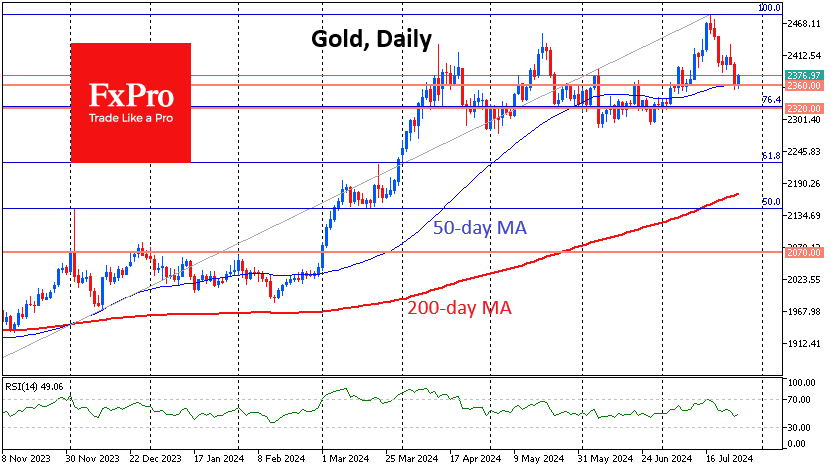
Gold came close to closing lower for the second week in a row, falling to $2372 per troy ounce on Friday morning, $111 below its high on July 17th.
This decline occurred in two impulses, with an intermediate correction in between, and fits within a 61.8% Fibonacci retracement pattern from the initial decline. The extension of the pattern within the classic expansion suggests a downside target near $2320.
On the other hand, gold found buying support on Thursday and early on Friday at the crossover of the 50-day moving average near $2360. This also coincides with the consolidation centre of the repeated pullbacks from April to June. This means that the decline in this area is well within the framework of a correction, and it is not yet possible to claim that the gold rally has broken and that a top has been established for many months and years to come.
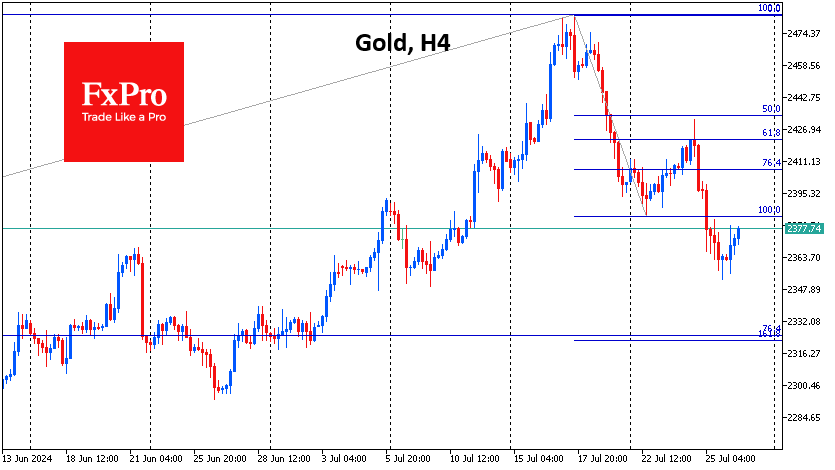
Therefore, there are two possible lines of defence for gold in the short term: $2360 and $2320. It is worth keeping a close eye on the price action around these levels. If gold breaks through them with a strong move, we should be prepared for a prolonged decline. If the buyers manage to break the trend near one of these lines, the price may well continue to rise on buyers’ encouragement.
Gold’s ability to avoid a sell-off in June after breaking the 50-day probably helped it make new highs in July. This story could be repeated if the financial markets avoid another deep sell-off and return to growth even without an official correction (a fall of more than 10% from the peak).
Forex and Cryptocurrency Forecast
EUR/USD: Europe is Not Doing Very Well, the US is Not Doing Very Badly
The main events in the currency market will unfold in the upcoming week, with meetings scheduled for Wednesday, 31 July, when the Bank of Japan and the Federal Reserve's FOMC (Federal Open Market Committee) will convene, followed by the Bank of England's meeting on Thursday, 01 August. Even if interest rates and other monetary policy parameters remain unchanged in all three cases, investors will closely listen to the statements made by regulators at the subsequent press conferences, trying to predict their next steps. Therefore, in anticipation of these events, we have focused more on the cryptocurrency market in this review, while still covering Forex.
In early July, one of our review headlines read: "The US is Not Doing Very Well, Europe is Not Doing Very Badly." This time, we have reversed the positions of the US and Europe, prompted by the macroeconomic statistics released last week.
Vladimir Lenin, the leader of the Communists who led the 1917 revolution in Russia, stated in one of his works that "politics is the concentrated expression of economics." In our view, the reverse is also true: not only does politics depend on economics, but economics also depends on politics. This is exemplified by the scales, with the current monetary policy of the Federal Reserve on one side, and the concerning prospects of Donald Trump's return to the White House on the other.
The restrictive tariffs that Trump aims to implement in the trade war with Beijing will create new problems for the Chinese economy, which is already struggling. This, in turn, will negatively impact Europe, particularly Germany, which accounts for half of the EU's exports to China. Within just three months, Germany's business activity indicators have shifted from slowing growth to abandoning optimism about economic prospects. The recent Business Activity Index (PPI) values for Germany, released on Wednesday, 24 July, were all in the red zone, falling below both previous figures and forecasts. Both the manufacturing PPI and the composite PPI are below 50 points, indicating regression. These German indices have dragged down overall European metrics, which have also turned worryingly red. While the US economy is merely slowing down slightly, the recovery of the Eurozone risks being reversed.
The preliminary data on business activity in the United States, released on the same day, 24 July, showed that the PPI in the manufacturing sector decreased from 51.6 to 49.5 points, disappointing the market, which had expected a rise to 51.7. However, the same index in the services sector increased to 56.0, surpassing both the previous value of 55.3 and the forecast of 54.4.
The Composite Purchasing Managers' Index (PMI) rose to its highest level since April 2022. The real surprise, however, came from the US GDP data released on Thursday, 25 July. According to the Bureau of Economic Analysis' initial estimate, the Gross Domestic Product in Q2 2024 grew by 2.8% on an annualised basis. This followed a 1.4% growth in Q1, exceeded the market expectations of 2.0%, and confirmed the belief that the US economy will not fall into recession. Further details in the report showed that the core Personal Consumption Expenditures (PCE) price index increased by 2.9% on a quarterly basis, which was lower than the 3.7% growth recorded in the previous quarter, though slightly above the forecast of 2.7%.
The unrest that began on 17 July in the stock market (detailed in the cryptocurrency review) increased demand for the dollar as a safe-haven currency, strengthening it by more than 100 points. However, for the last three days of the trading week, EUR/USD moved within a narrow range of 1.0825-1.0870 in anticipation of next week's events, with the final note sounding at the 1.0855 mark.
As of the evening of 26 July, analysts' forecasts for the near future are as follows: 40% predict a rise in the pair, while 60% expect a decline. In technical analysis, 65% of trend indicators on the D1 chart remain in favour of the euro, while 35% support the dollar. Among oscillators, there is considerable confusion: 25% are in green, 35% are neutral-grey, and 40% are red, with a quarter of them signalling oversold conditions. The nearest support levels for the pair are at 1.0825, followed by 1.0790-1.0805, 1.0725, 1.0665-1.0680, 1.0600-1.0620, 1.0565, 1.0495-1.0515, and 1.0450, 1.0370. Resistance zones are located at 1.0870, 1.0890-1.0910, 1.0945, 1.0980-1.1010, 1.1050, and 1.1100-1.1140.
The upcoming week, as mentioned, promises to be very eventful, interesting, and volatile. On Monday, 29 July, retail sales volumes will be released, followed by preliminary data on GDP and consumer inflation (CPI) in Germany on 30 July. On the same day, GDP data for the Eurozone as a whole will also be published.
The key day will be Wednesday, 31 July. On this day, consumer inflation (CPI) data for the Eurozone will be released, followed by the FOMC meeting of the Federal Reserve. It is expected that the regulator will again leave the key interest rate unchanged at 5.50%. Therefore, market participants will be particularly interested in the FOMC's Economic Projections Summary and the subsequent press conference of the Fed leadership. The following day, Thursday, 01 August, final data on business activity (PPI) in various sectors of the US economy will be published.
Additionally, throughout the week (30, 31 July, 01 and 02 August), there will be a significant influx of labour market statistics from the United States, including key indicators such as the unemployment rate and the number of new non-farm jobs created (NFP).
USD/JPY: "The Most Intriguing Pair in Forex"
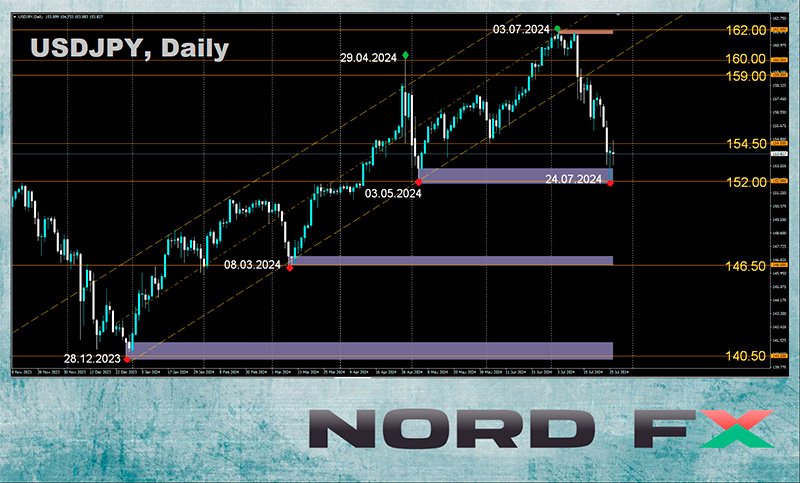
While the dollar has recently been strengthening against the euro and the pound, the situation with the Japanese yen has been quite the opposite. This wasn't just a retreat of the US currency, but rather a panicked flight. On Friday, 19 July, strategists from ING, a major Dutch banking group, described the USD/JPY pair as a "bundle of surprises," retreating to the 155/156 range. A week later, they referred to it as "the most intriguing pair in Forex." This time, the minimum was recorded at 151.93, in the key zone of 151.80-152.00, which coincides with the highs of October 2022 and 2023.
The yen began its resurgence like a Phoenix on 11 and 12 July when the Bank of Japan (BoJ), to support the national currency, purchased an estimated ¥6.0 trillion. On 17 July, USD/JPY came under pressure again due to another currency intervention. Analysts, examining BoJ's accounts, estimated the size of this intervention at approximately ¥3.5 trillion.
Then came a new surge. It is worth noting that on 03 July, USD/JPY reached a high of 161.94, a level not seen in 38 years. Now, in just three weeks, it plummeted by 1,000 (!) points, triggering widespread liquidation of positions across all markets, affecting everything from the yuan to various asset classes, including Japanese stocks, gold, and cryptocurrencies.
On Thursday, 25 July, the yen's exchange rate against the dollar rose to its highest level in over two months. This time, the cause seems to be not the currency interventions of the Japanese central bank but the expectation that the interest rate gap between Japan and the US will narrow on 31 July. Swap markets are currently pricing in a 75% probability of a BoJ rate hike on Wednesday, compared to 44% earlier in the week. Moreover, economists at ING believe the BoJ might raise the rate by an unprecedented 15 basis points (bps) for Japan.
They note that "Tokyo's consumer price data showed that core inflation fell to 2.2% year-on-year in July (from 2.3% in June), but the BoJ's preferred measure, core inflation excluding fresh food, rose to 2.2% in July from 2.1% in June." Based on this, ING suggests a 50% chance that inflationary pressure in the services sector will continue to rise, which could lead the BoJ to increase the rate by 15 bps at the upcoming meeting and simultaneously reduce its bond purchase program.
If something like this occurs, macro strategists at State Street Global Markets believe that the resurgence of the Japanese currency could lead to a significant adjustment in global trading strategies in the foreign exchange market, particularly in carry trades. Carry trades involve borrowing in low-yielding currencies, such as the yen, to invest in higher-yielding currencies.
USD/JPY ended the past trading week at 153.75. According to analysts at State Street Global Markets, "the yen rally may continue ahead of the Bank of Japan meeting next week." As for the median forecast by experts for the near term, it is as follows: 20% expect the pair to move south, further strengthening the yen, 30% predict a rebound north, and the remaining 50% have taken a neutral stance. Among oscillators on the D1 chart, 90% favour the Japanese currency, with 20% indicating the pair is in the oversold zone, and the remaining 10% are neutral. Trend indicators show 85% favouring the strengthening of the yen, while 15% support the dollar. The nearest support level is around 151.80-152.00, followed by 149.20-149.50 and 146.50-147.25. The nearest resistance is located in the 154.70-155.20 range, followed by 157.20-157.40, 158.25, 158.75-159.00, 160.20, 160.85, 161.80-162.00, and 162.50.
Apart from the Bank of Japan meeting on Wednesday, 31 July, no other significant events, including the release of important macroeconomic statistics concerning the state of the Japanese economy, are scheduled for the coming days.
CRYPTOCURRENCIES: Politics Engages with the Digital Market
As early as the mid-19th century, French writer Charles de Montalembert warned, "You may not be interested in politics, but politics is interested in you." This sentiment is vividly illustrated by recent developments in the market for risk assets, including cryptocurrencies.
The past week was disappointing for investors, although the troubles began earlier, on Wednesday, 17 July. On that day, the shares of some of the world's largest semiconductor manufacturers plummeted, causing the stock market to reach its worst condition in several months. This reaction was due to the tensions in US-China trade relations and comments from former (and possibly future) President Donald Trump regarding Taiwan. Shares of several semiconductor companies sharply declined under the weight of geopolitical tension, with some losing over 8% and a giant like Nvidia dropping by 6%. As a result, the S&P 500 Index fell by 1.39%, marking its largest drop since late April, and the tech-heavy Nasdaq fell by 2.77%, its worst performance since the end of 2022.
However, the troubles for the stock market did not end there. Exactly one week later, on Wednesday, 24 July, the US stock market closed with even greater losses. The S&P 500 and Nasdaq indices dropped by 3.6% and 2.3%, respectively, after Tesla's Q2 results revealed a profit decline of more than 40% compared to the previous year. Tesla's shares fell by more than 12% in just one day. Alongside Tesla, shares of Alphabet, Visa, Microsoft, Nvidia, and other technology companies also declined. The seven largest IT giants lost $770 billion in market capitalization in one day. This turmoil occurred amidst ongoing issues with Microsoft's global Windows system outage, which affected many sectors.
Naturally, such market dynamics impacted the riskiest of assets—cryptocurrencies. It's worth noting that the prices of both bitcoin and ethereum appeared quite strong at the start of the past week. However, they eventually succumbed to the pressure and also declined. In addition to global geopolitical factors, cryptocurrencies had their own specific reasons for this downturn.
The market was shocked when US President Joe Biden announced on Sunday, 22 July, that he would not seek re-election. This decision sparked a debate about how it might impact the digital assets market. Many analysts and influencers argue that only a victory by Donald Trump could provide a strong bullish impulse to the industry. This view is shared by experts at JPMorgan. Analyst Josh Gilbert stated, "The longer we see Trump leading in the election odds, the more valuable crypto assets will become after his victory." He further explained, "It's hard to imagine Kamala Harris or another Democratic candidate overthrowing Trump's lead in the polls just three months before the end of this election race.".
Trump's Republican ally, Senator Cynthia Lummis, suggested backing the dollar with bitcoin to improve the country's financial system. A similar approach was proposed by Markus Thielen, founder of 10x Research. He believes that Trump could announce at the upcoming Bitcoin-2024 conference that he plans to make bitcoin a strategic reserve asset for the US government. Currently, the government holds only 212,800 BTC, worth approximately $15 billion, compared to its gold reserves of around $600 billion. If the government were to double its bitcoin holdings, it would have an impact on the price nearly equivalent to the net inflow effect on spot BTC-ETFs since the beginning of the year.
Bloomberg reports that bitcoin miners and crypto companies, previously hindered from going public in the US, could benefit under a second Donald Trump presidency. The agency cites the opinion of Christian Catalini, founder of the Crypto-economics Lab at the Massachusetts Institute of Technology. He believes that "almost everyone in America will benefit if they choose to operate under new rules after they are implemented."
In June, Trump met with miners and expressed his desire for all remaining bitcoin to be "made in the USA." Following Joe Biden's poor performance in debates and an unsuccessful assassination attempt on Trump, the price of bitcoin rose by 10%, while shares of the two largest public miners, Marathon Digital and Riot Platforms, increased by 30%. Cipher Mining's stock prices gained nearly 50%. For the first time since the crypto market crash in 2022, companies in the sector are planning initial public offerings (IPOs). Stablecoin issuer USDC, Circle, filed for an IPO in January with a valuation of $33 billion. Crypto miner Northern Data, which is actively expanding its AI computing division, is considering listing in the US, with a potential valuation of $16 billion. Kraken, the second-largest exchange in the country, is also preparing to go public.
However, all of this is speculative and dependent on future developments. Josh Gilbert, while optimistic about Trump's influence on the cryptocurrency market, cautions that "a lot can happen between now and the election, so nothing is certain." Gary Black, Managing Partner of The Future Fund, echoed this sentiment, warning his 433,000 followers on X that a Trump victory is far from assured. "Those who think Trump/Vance will secure an easy win are getting ahead of themselves," Black wrote.
Arthur Hayes, the former CEO of the crypto exchange BitMEX, also expressed skepticism. He believes that voters who support cryptocurrency may lose influence over politicians once the presidential election is over in November 2024. If a regulatory framework for digital assets is not established before the election, the elected president and their administration may shift their focus to other pressing issues. Geopolitical concerns could overshadow discussions about cryptocurrencies, with the president's attention potentially diverted to international conflicts, particularly involving Iran and Russia. Hayes argues, "The capital needed to support laws promoting cryptocurrency development could be redirected towards addressing more urgent foreign policy issues. Therefore, regulatory clarity should be sought now, before the political landscape changes post-election."
BITCOIN: Bullish Flag or Bearish Den?
Experts at JPMorgan note that the current bitcoin price significantly exceeds its mining cost (~$43,000) and appears overvalued compared to its "fair" price adjusted for volatility (~$53,000). According to JPMorgan, the substantial upward deviation from this fair price "limits the potential for long-term growth." However, they have forecasted positive market dynamics in August, attributed to the diminishing negative impact of the sale of coins confiscated by German authorities and the distribution of coins to clients of Gemini and Mt.Gox.
At the beginning of the year, Nigel Green, CEO of deVere Group, predicted that bitcoin would soon rise to $60,000, and his forecast proved accurate. Now, he believes that the demand for the leading cryptocurrency will continue to grow, potentially reaching $100,000 by the end of the year. "Bitcoin is likely the best asset in terms of growth potential by the end of the year," the financier writes. "Many are expecting it to reach $100,000 by year-end. Is this possible? Quite possibly, because the supply of bitcoin is limited. This means that if demand for BTC increases, so will the price. Bitcoin is not the same as the US dollar, where the Federal Reserve can simply print more."
Green also mentioned that the potential election of Donald Trump as US President could positively impact bitcoin's price.
Analyst and trader known by the nickname RLinda identifies the bullish flag pattern as a key indicator of potential upward movement for BTC. This formation, observed on both daily and weekly charts, is characterized by a sharp upward move followed by a phase of consolidation. RLinda anticipates that a breakout from this consolidation will continue the previous uptrend, potentially targeting around $90,000.
Support and resistance levels play a crucial role in this analysis. Key support levels at $59,300 and $63,800 have shown strong buying interest and stability. The high trading volumes at these levels reinforce the expectation that they will hold during any potential pullbacks. Critical resistance levels are noted at $67,250 and $71,754. Breaking through these resistance points is necessary for BTC to advance towards higher targets. The all-time high (ATH) at $73,743 is particularly significant; a successful breakout above this level could trigger further bullish momentum.
Peter Brandt, the head of Factor LLC, has entered into a debate with RLinda. The legendary trader expresses skepticism that bitcoin will surpass $71,000 and set a new price record. "I try to be as honest as possible in identifying patterns. The current stagnation in the bitcoin market should not be called a flag (it has lasted too long); it represents a descending channel. Anything that lasts longer than 4-6 weeks is not a flag," Brandt wrote.
According to some analysts, the flag pattern observed on the BTC/USD chart suggests an impending bullish rally. However, the descending channel that Brandt refers to indicates a potential decline in the coin's price. This pattern is characterized by lower highs and lows, established after BTC reached its all-time high in March. Based on the chart published by Brandt, he believes that bitcoin's price will not break the resistance line, which lies around $71,000. In this scenario, a bearish trend could begin, with the digital gold potentially dropping to $51,000. The descending channel is slightly widening, suggesting that price volatility may increase over time.
On Thursday, 25 July, the BTC/USD pair dropped to the support zone of $63,200-63,800 and encountered additional support from the 200-day moving average (DMA200). Following this, it reversed direction and started to move upwards. As of the evening of Friday, 26 July, it has nearly recovered its weekly losses and is trading at around $67,500. The total market capitalization of the crypto market has remained relatively stable at $2.42 trillion, compared to $2.43 trillion a week ago. The Bitcoin Fear & Greed Index has risen from 60 to 68 points over the past seven days, remaining in the Greed zone.
ETHEREUM: ETH-ETF – Disappointment Instead of Hope
On 23 July, the long-awaited spot ETFs for Ethereum were launched in the US, providing investors with access to the altcoin through traditional brokerage platforms. On the first day of trading, the turnover reached $1.1 billion, which was 24.4% of the turnover of BTC-ETFs, aligning with optimistic forecasts. However, trading volume isn't the only metric to consider. The net inflow of investments into ETH was significantly lower than that into bitcoin, with $107 million compared to $655 million, respectively, showing a sixfold difference.
The situation worsened as the initial enthusiasm for Ethereum ETFs quickly faded, causing ETH/USD prices to decline sharply, despite the trading volume surpassing $1.0 billion again. The decline was triggered by a significant outflow of funds from a single issuer, Grayscale's Ethereum Trust ETF (ETHE). According to SoSoValue, Grayscale's ETHE lost $484 million on the first trading day and nearly $327 million on the second day, totalling $811 million. In contrast, most other spot ETH-ETFs, including ETHA from BlackRock, ETHW from Bitwise, and FETH from Fidelity, showed growth in inflows. However, these inflows were insufficient to offset the losses from Grayscale's ETHE.
This situation mirrors the experience with Grayscale's GBTC fund in the early weeks following the launch of the bitcoin ETF. Both Grayscale funds were converted from trust to spot ETFs. If the outflow rate from ETHE matches that of GBTC, it could negatively impact all newly established ETH-ETFs.
Moreover, macroeconomic factors contributing to the (hopefully temporary) stock market downturn, the ongoing situation with Mt.Gox, and the lack of staking in ETFs, which deprives the altcoin of the advantage of passive income, also play a role. Additionally, Ethereum's practical applications are increasingly being outperformed by competitors such as Tron and Solana. Experts also remind us of the upcoming US elections, where statements and actions by key political figures could create new opportunities and threats for the market.
Analysts at cryptocurrency market maker Wintermute believe that demand for Ethereum will fall short of expectations, predicting investments in these derivatives will range between $3.2 billion and $4.0 billion in the first 12 months after trading begins. As a result, they expect Ethereum's price to rise to a maximum of $4,300 in 2024.
In contrast, researchers from ASXN offer a more optimistic forecast. They predict that the monthly capital inflow into Ethereum ETFs will range from $800 million to $1.2 billion, implying a total investment of at least $6-7 billion in these funds by the end of the year, significantly exceeding Wintermute's estimate.
Adding to the positive outlook, experts from QCP Capital noted that following the launch of similar BTC-ETFs, bitcoin's price initially fell to $38,000 but then surged to new all-time highs within two months, posting a 90% increase. (However, it is worth noting that the BTC halving may have played a significant role at that time.) The dynamics of Ethereum will become clearer in the near future. Currently, ETH/USD recorded a weekly low of $3,089 and, as of the evening of Friday, 26 July, is trading around $3,200.
Multiple Themes Play Out in Turbulent Week, Yield Curve De-Inversion Most Significant
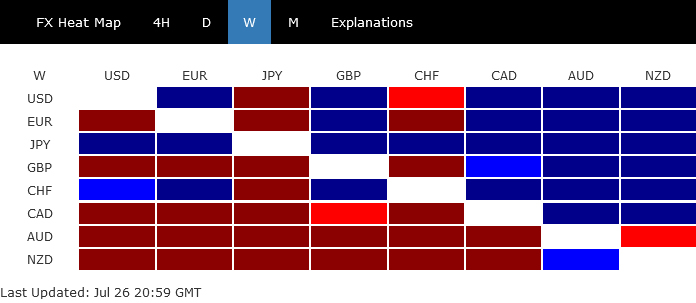
It was a highly volatile week which cannot be characterized by a single theme. Yen had a sharp and robust rally against all major currencies, continuing its rebound from the 38-year lows hit earlier this month, with market participants unwinding their long-held short positions. Alongside Yen, Swiss Franc and Dollar also emerged as winners, although they trailed significantly behind the Yen. Conversely, Australian Dollar took the bottom spot, followed by New Zealand Dollar and Canadian Dollar. These positions highlighted clear risk aversion sentiment.
The risk-off sentiment, however, was not uniformly reflected across all markets. In the US, while NASDAQ and S&P 500 had significant declines, DOW managed to post a weekly gain, with Russell 2000 also showing resilience. In Europe, FTSE and DAX ended the week higher, with the strong rebound on Friday, whereas CAC hit new lows for the year. In Asia, Japan's Nikkei extended its plunge from record highs to hit the lowest level in three months, while China's SSE resumed its downtrend .
Multiple themes are at play in the current market environment, creating a complex and even contradictory picture. Sector rotation within stocks is a notable trend. At the same time US election risk is also weighing on sentiment. Global monetary policy easing continues, with the notable exception of Japan. Meanwhile, economic slowdown in China is deepening, as evidenced by recent data and the government's panic efforts to stimulate growth through rate cuts. However, amidst these diverse factors, the de-inversion of yield curve in the US stands out as a particularly significant development from a medium-term strategy perspective.
US Stocks End Week in Turmoil, Sector Rotation or More?
This week has been marked by turbulence in the US stock markets, driven by multiple conflicting themes. Despite a late-week rally, NASDAQ closed down -2.1%, while S&P 500 fell 0.8%. Both indexes experienced consecutive weekly losses for the first time since April. In contrast, DOW outperformed, rising 0.8% for its fourth straight positive week, a milestone not seen since May.
Sector rotation was evident, with Russell 2000 gaining nearly 4% for the week. However, it failed to surpass last week's high of 2278.12, indicating that this rotation is more about minimizing losses than making significant gains. Similarly, DOW remained well below the previous week's high of 41376.00.
Political uncertainty is also influencing investor behavior. With endorsements from President Joe Biden, former President Barack Obama, and former House Speaker Nancy Pelosi, Vice President Kamala Harris seems likely to secure the Democratic nomination to challenge Donald Trump in the upcoming presidential election. The shift in the Democratic candidate appears to have narrowed Trump's lead notably, adding to the uncertainty.
On the data front, June PCE inflation data provided the Fed with further justification to consider easing monetary policy later in the year. Q2 GDP data presented a Goldilocks scenario, with stronger-than-expected growth while inflation pressures eased.
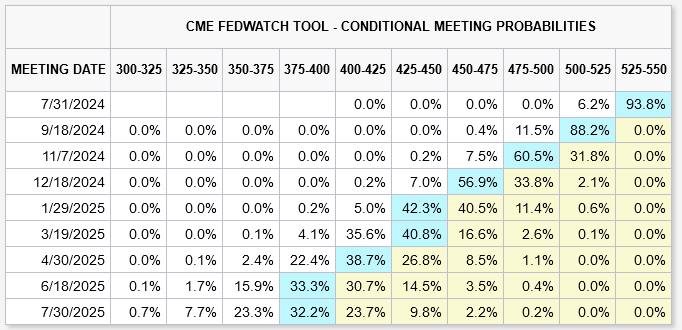
Fed funds futures indicate a fully priced-in 25bps rate cut in September. Markets also see a 68% chance of a second 25bps cut in November and a 64% chance of a third cut in December. If these cuts occur, federal funds rate would decrease to 4.50-4.75% by the end of the year, down from the current 5.25-5.50% level.
Yield Curve Steepening Signals Recession Risks
But above all, the most critical development in the background is steepening of the yield curve. Since mid-June, the spread between 10-year and 2-year Treasury yields has narrowed significantly, from -0.47 basis points to as little as -0.12 on Thursday, indicating a potential trend of normalization from inversion.
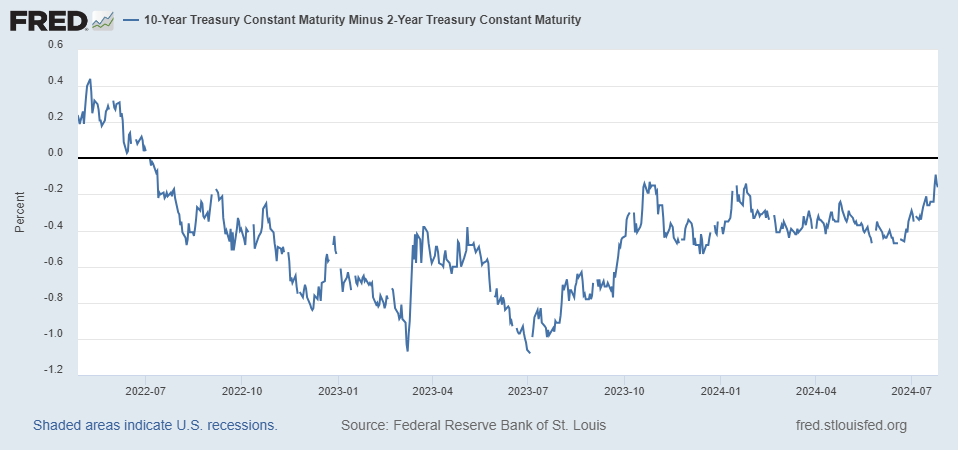
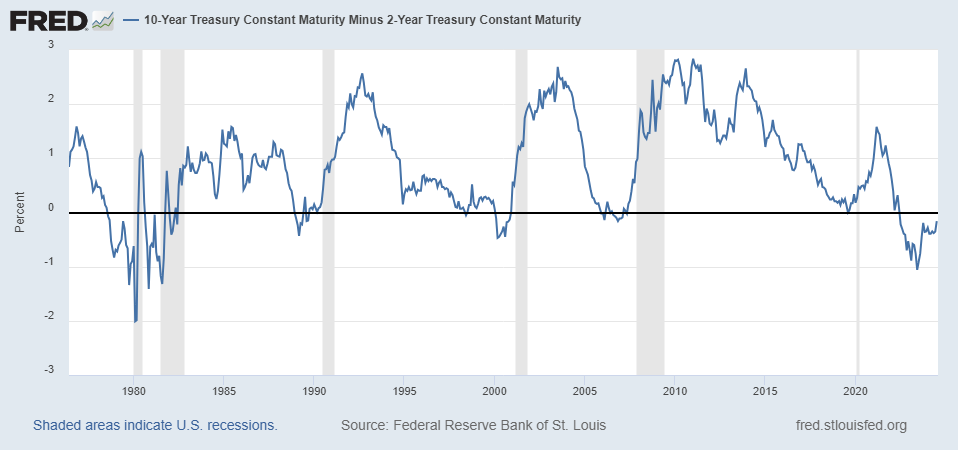
Historically, recessions in the US have often followed the normalization of an inverted yield curve:
- 1990-1991 Recession: The yield curve inverted in 1989 and normalized shortly before the recession began in July 1990.
- 2001 Recession: The yield curve inverted in 2000 and normalized just before the dot-com bubble burst, leading to a recession.
- 2008 Financial Crisis: The yield curve inverted in late 2006. Despite partial normalization in 2007, the US economy fell into a severe recession by December 2007, exacerbated by the housing market collapse and financial sector failures.
- 2020 COVID-19 Recession: The yield curve inverted in 2019 and normalized before the COVID-19 pandemic-induced recession in 2020, though this case was complicated by the pandemic's unique impact.
As a side note, former New York Fed President William Dudley warned on Wednesday that Fed should cut interest rates immediately to stave off a recession, as current economic cooling measures are visibly effective.
Dudley highlighted that the three-month average unemployment rate has risen 0.43% from its low point over the past year, nearing the 0.5% threshold identified by the Sahm Rule, which has historically signaled a US recession.
Notably, once this threshold is breached, unemployment typically rises significantly more, with the smallest increase being nearly 2% from trough to peak.
NASDAQ's Downside Risks Materialize While DOW Retains Bullish Outlook
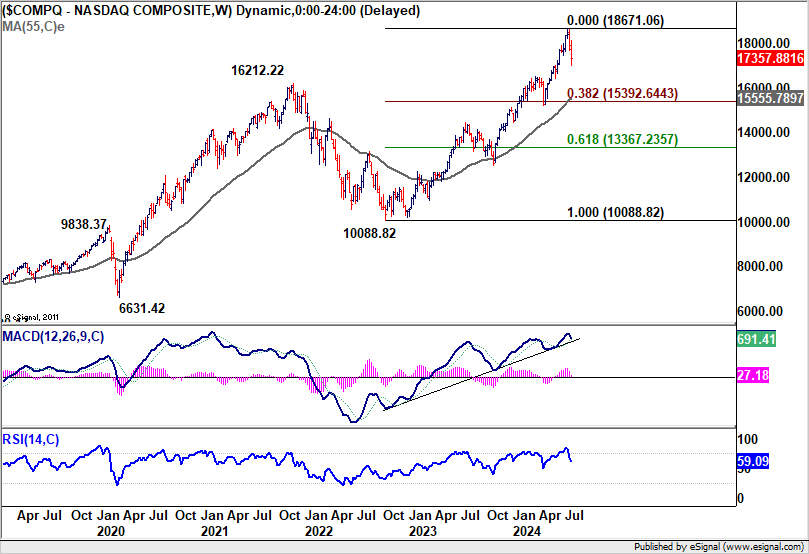
Technically, NASDAQ's steep decline last week and break of 55 D EMA (now at 17451.72) suggests that fall from 18671.06 is at least correcting the rally from 12543.85. Risk will stay on the downside as long as 18128.38 resistance holds. Deeper fall would be seen to 38.2% retracement of 12543.85 to 18671.06 at 16330.46 before finding strong support to set the range for consolidations.
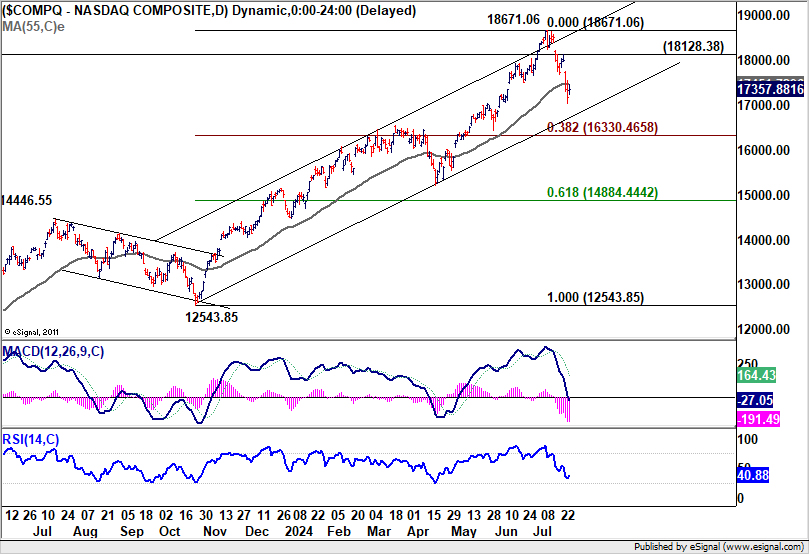
While it's still early to call, firm break of 16330.46 will raise the chance that NASDAQ is indeed correcting the whole up trend from 10088.82 (2022 low). In this more bearish case, enough support could only be found between 38.2% retracement of 10088.82 to 18671.06 at 15392.65, and 55 W EMA (now at 15555.78).
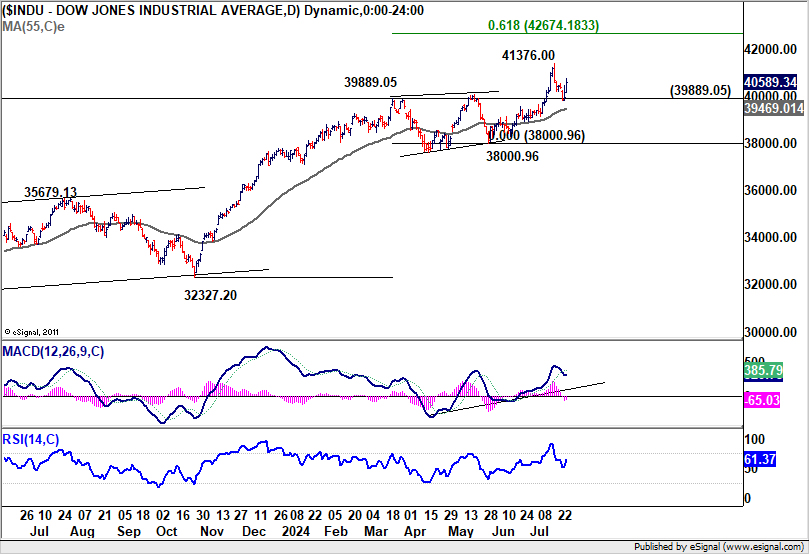
Conversely, DOW's strong bounce from 39889.05 resistance turned support is keeping near term bullishness intact. Another rise could be seen through 41376.00 to 61.8% projection of 32327.20 to 39889.05 from 38000.96 at 42674.18. However, decisive break of 39889.05 would open up deeper fall to 38000.96 support as larger scale correction.
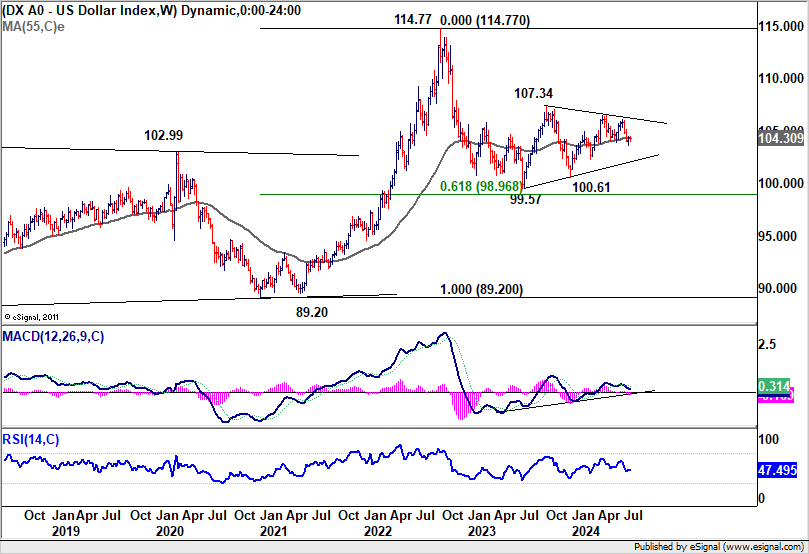
Dollar Index's movements have been mixed as it struggled to find a clear direction, on whether the market is risk-on, or risk off. The index is also struggling around 55 W EMA (now at 104.30). Risk will stay on the downside as long as 105.20 resistance holds. Firm break of 103.65 and sustained trading below 55 W EMA will bring deeper fall to 102.35 or even further to 100.61.
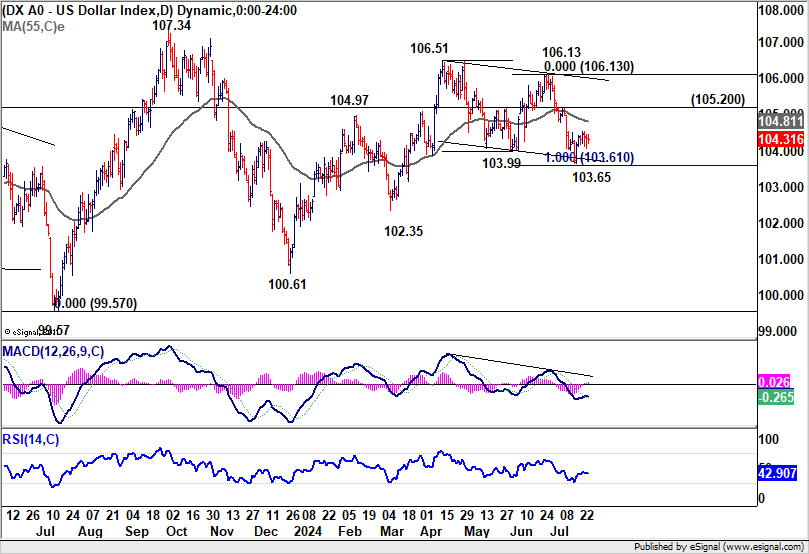
However, break of 105.20 will argue that price actions from 106.51 is merely a corrective pattern that has completed with three waves to 103.65. Dollar index should then be ready to rise through 106.13/51 resistance zone to resume the rebound from 100.61.
Chinese Investor Sentiment Deteriorates Amid Panic-Driven Rate Cuts
Another development to note is the continued deterioration in investor sentiment in China, driven by what appears to be panic measures from the People's Bank of China to bolster an economy growing at its slowest pace in more than a year.
On Thursday, PBoC made a surprise, off-schedule cut to its one-year medium-term lending facility rate, lowering it from 2.5% to 2.3%. This move injected CNY 200B of liquidity into the market and marked the largest reduction since 2020. Earlier in the week, PBoC announced its first cut in nearly a year to a key short-term policy rate, reducing the seven-day reverse repo rate from 1.8% to 1.7%.
These aggressive rate cuts have underlined the authorities' urgency and contributed to a sense of panic rather than lifting market sentiment.
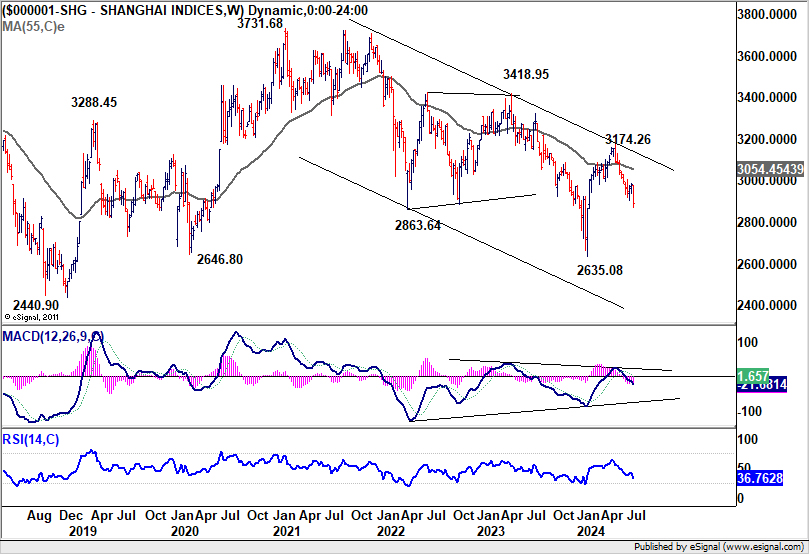
Shanghai SSE Composite resumed the fall from 3174.26 to close at 2890.89, lowest in February. Technically, near term focus is now on 61.8% retracement of 2635.08 to 3174.26 at 2841.04. Strong bounce from this level, followed by break of 2986.24 resistance, will suggest that fall from 3174.26 is probably just a corrective move, and has possibly completed.
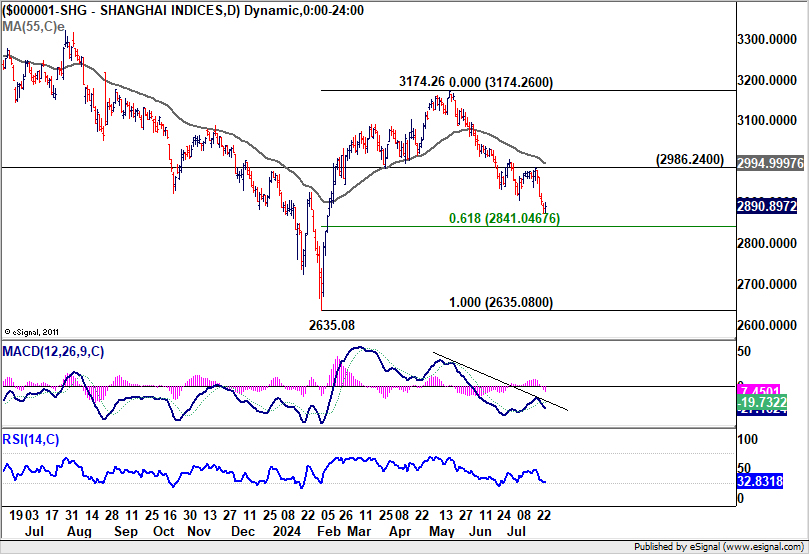
However, sustained break of 2841.04 would risk deeper sell-off back to 2635.08. More importantly, This will raise the chance that SSE is indeed trying to resume whole down trend from 3731.68 (2020 high), as its rebound attempt has been repeatedly rejected by falling 55 W EMA.
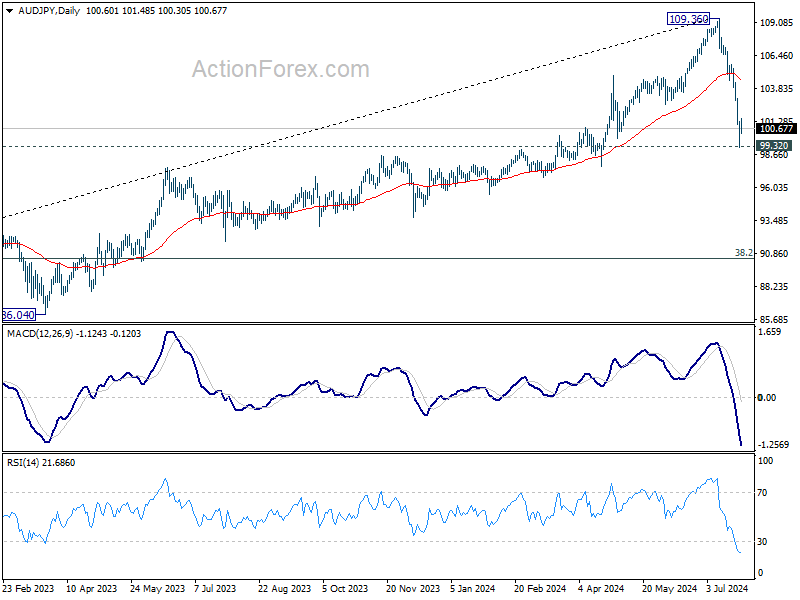
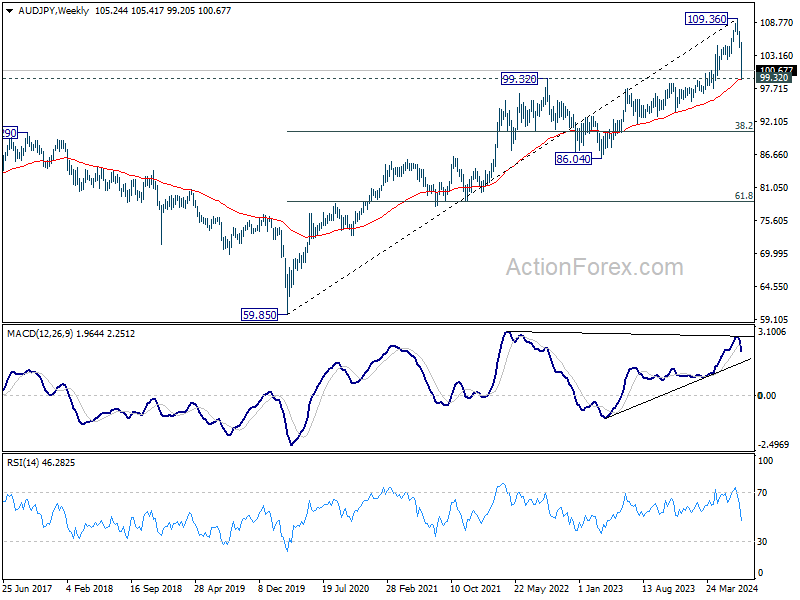
AUD/JPY and NZD/JPY Plunge Amid Broad Yen Rally and Regional Risk-Off Sentiment
AUD/JPY and NZD/JPY were the biggest movers last week, both lost more than -4.5%. The strong, broad-based rally in Yen was certainly a factor. The strong, broad-based rally in the Yen played a major role in this decline, compounded by a prevailing risk-off sentiment in both China and Japan.
Technically, AUD/JPY is now pressing an important cluster support zone, including 99.32 resistance turned support and 55 W EMA (now at 99.26). Some stabilization could be seen from current level to bring rebound. Yet, risk will continue to stay heavily on the downside as long as 55 D EMA (now at 104.66) holds. Sustained break of 99.32 will argue that AUD/JPY is at least correcting the whole rise from 59.85 (2020 low), with risk of bearish reversal. Deeper fall would then be seen to 38.2% retracement of 59.85 to 109.36 at 90.44.
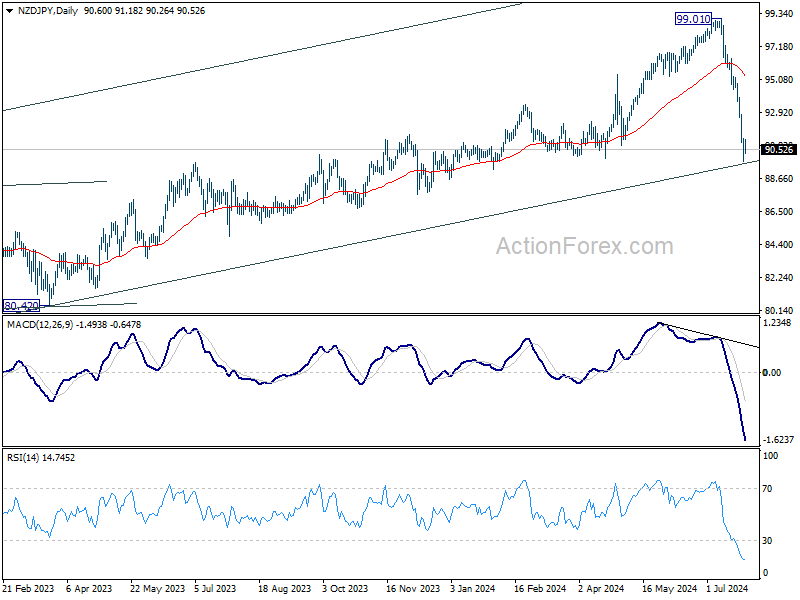
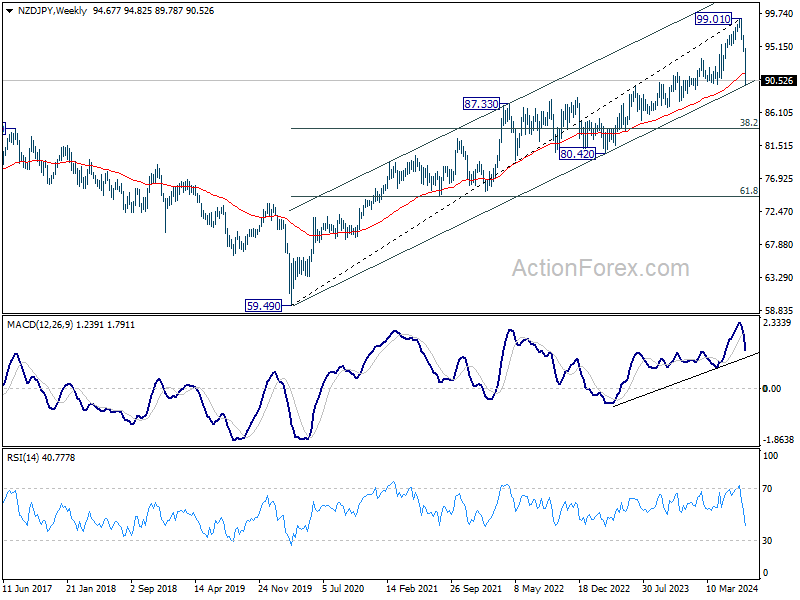
NZD/JPY has broken 55 W EMA already, and it's now trying to draw support from long term channel. Some stabilization could be seen from current level to bring rebound. Still, risk will stay on heavily on the downside as long as 55 D EMA (now at 95.27) holds. Sustained break of the channel support will indicate that it's at least correcting the whole up trend from 59.49 (2020 low) with risk of bearish reversal. Deeper fall would then be seen to 38.2% retracement of 59.49 to 99.01 at 82.389.
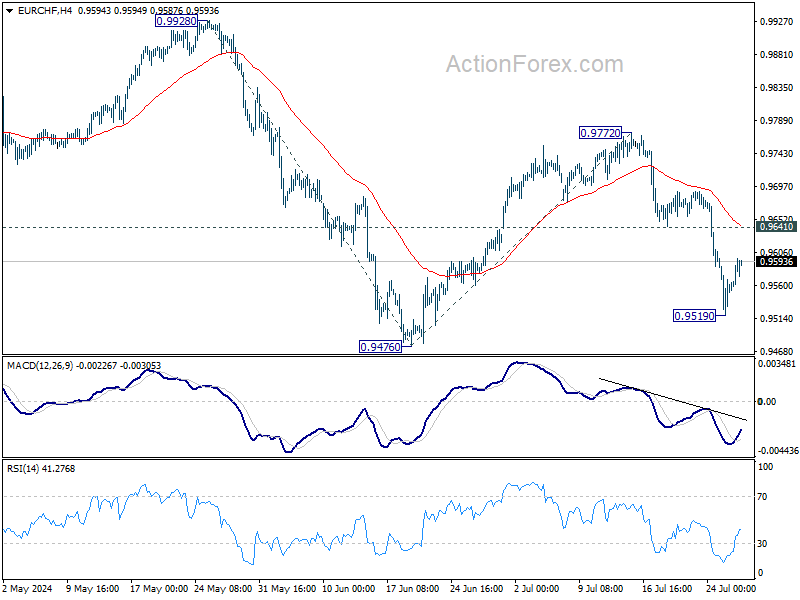
EUR/CHF Weekly Outlook
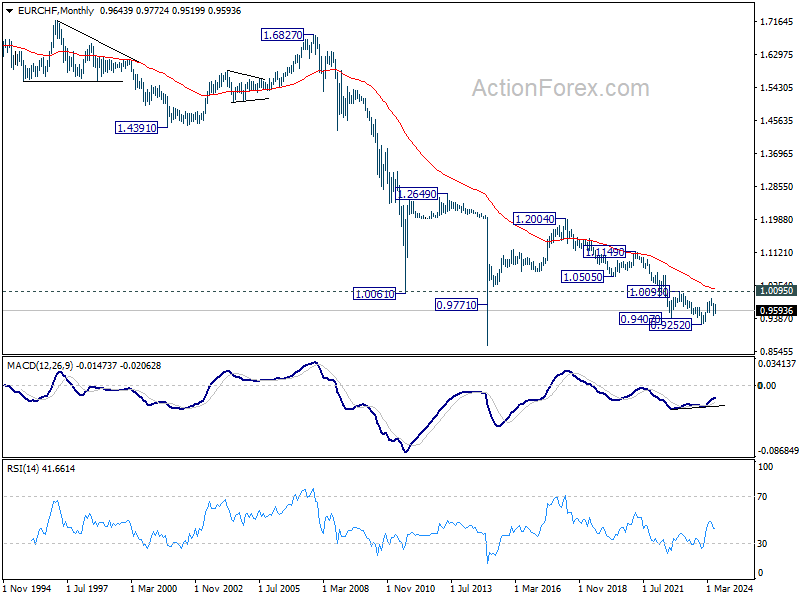
EUR/CHF's fall from 0.9772 extended to 0.9519 last week but recovered since then. Initial bias is turned neutral this week for consolidations first. Further decline is expected as long as 0.9641 support turned resistance holds. Rebound from 0.9476 should have completed as a corrective move at 0.9772. Below 0.9519 will bring retest of 0.9476. Firm break there will resume whole fall from 0.9928 to 100% projection of 0.9928 to 0.94767 from 0.9772 at 0.9320.
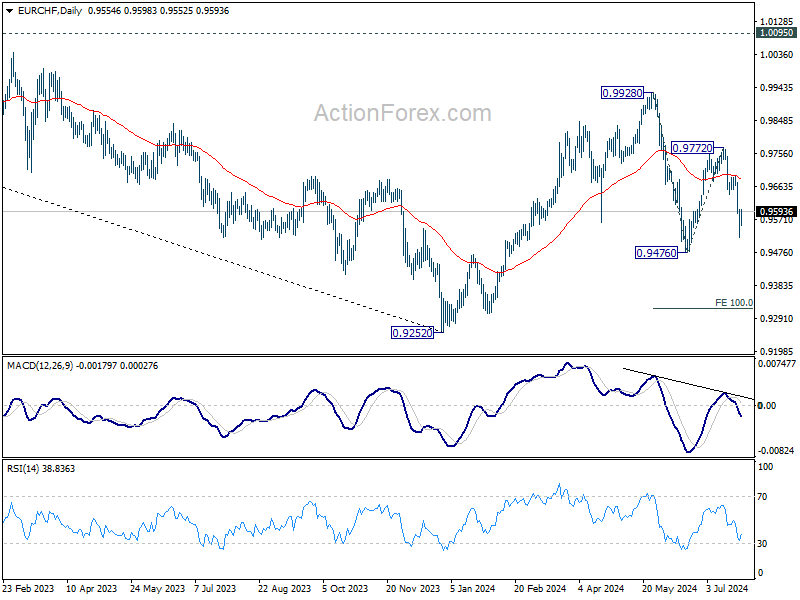
In the bigger picture, with 1.0095 key medium term resistance intact, price actions from 0.9252 (2023 low) are seen as a corrective pattern. Fall from 0.9928 might be the second leg and break of 0.9476 would bring deeper decline to retest 0.9252 low. But strong support should be seen there to extend the corrective pattern with another rising leg. In any case, medium term outlook will be neutral at best as long as 1.0095 structural resistance holds.
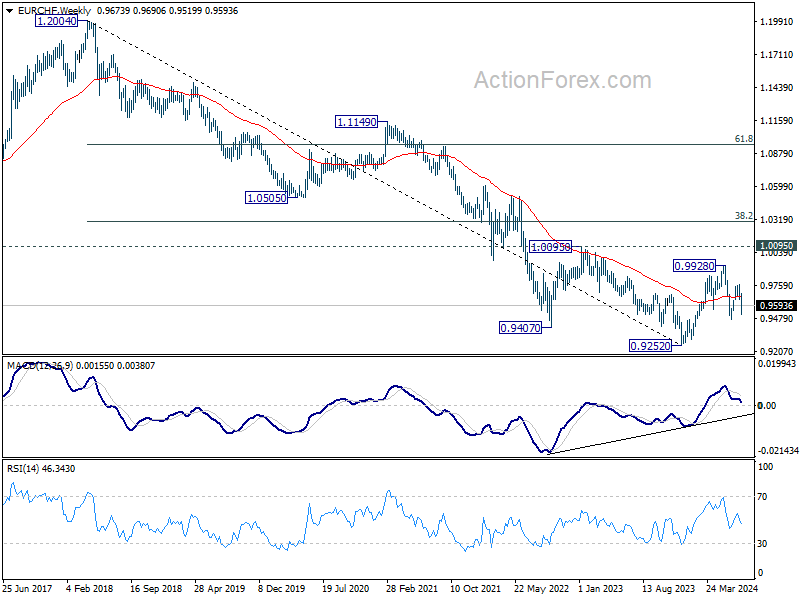
In the long term picture, fall from 1.2004 (2018 high) is part of the multi-decade down trend. Firm break of 1.0095 resistance is needed to be the first sign of long term bottoming. Otherwise, outlook will remain bearish.
EUR/USD Weekly Outlook
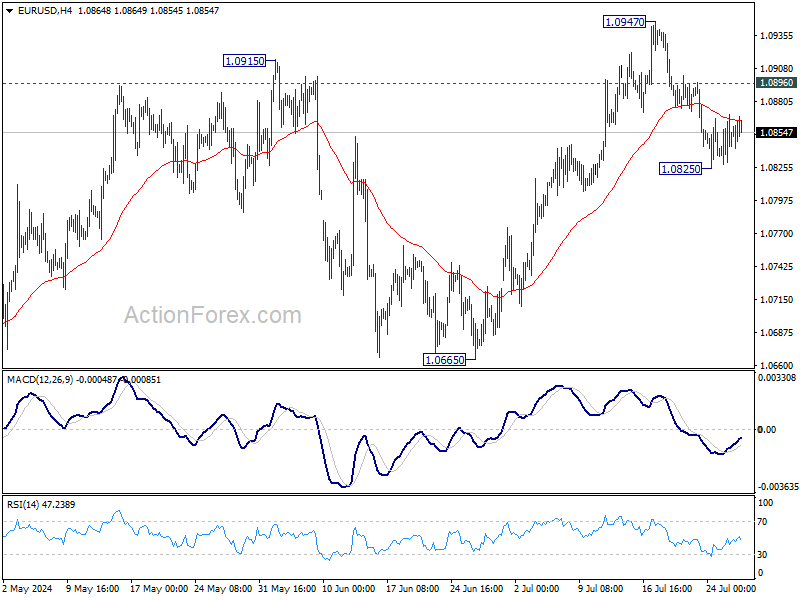
EUR/USD dipped to 1.0825 last week but turned sideway since then. Initial bias remains neutral this week first and further fall is in favor as long as 1.0896 minor resistance holds. Below 1.0825 will target 55 D EMA (now at 1.0815). Sustained break there will argue that whole rebound from 1.0601 has completed with three waves up to 1.0947, and target 1.0601/0665 support zone. Nevertheless, break of 1.0896 will bring retest of 1.0947 resistance instead.
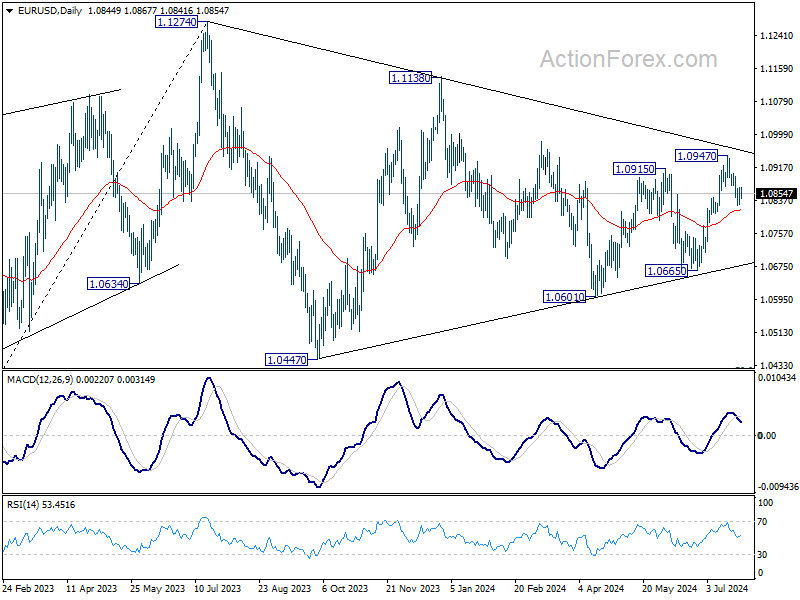
In the bigger picture, price actions from 1.1274 are viewed as a corrective pattern that's still be in progress. Break of 1.1138 resistance will be the first signal that rise from 0.9534 (2022 low) is ready to resume through 1.1274 (2023 high). However, break of 1.0665 support will extend the correction with another falling leg back towards 1.0447 support.
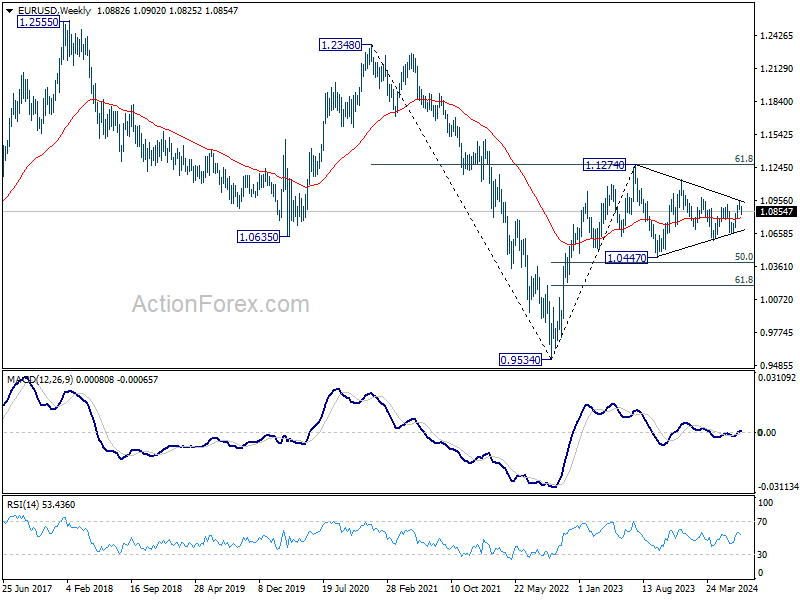
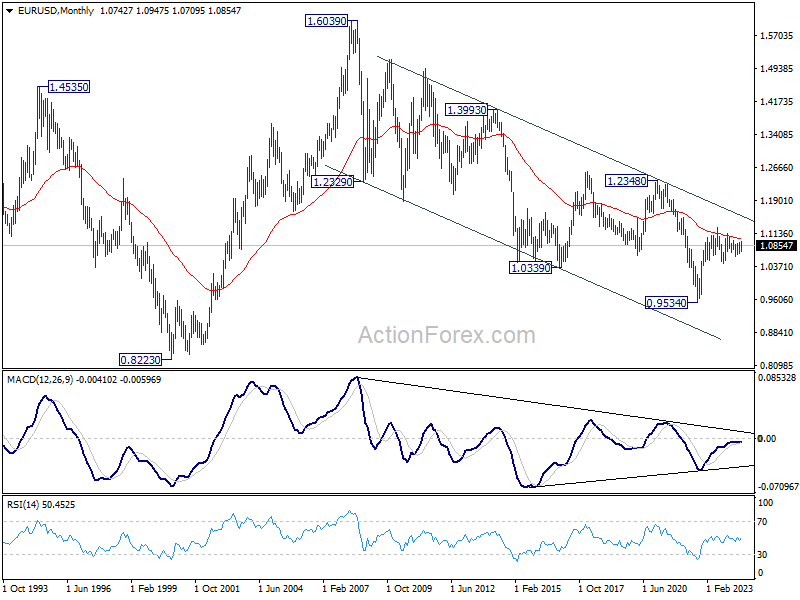
In the long term picture, a long term bottom is in place at 0.9534 (2022 low). Sustained break of 55 M EMA (now at 1.1013) will raise the chance of long term reversal. But even in this case, firm break of 1.2348 structural resistance is needed to confirm. Rejection by 55 M EMA will maintain bearishness for extend the down trend from 1.6039 (2008 high) through 0.9534 at a later stage.
USD/JPY Weekly Outlook
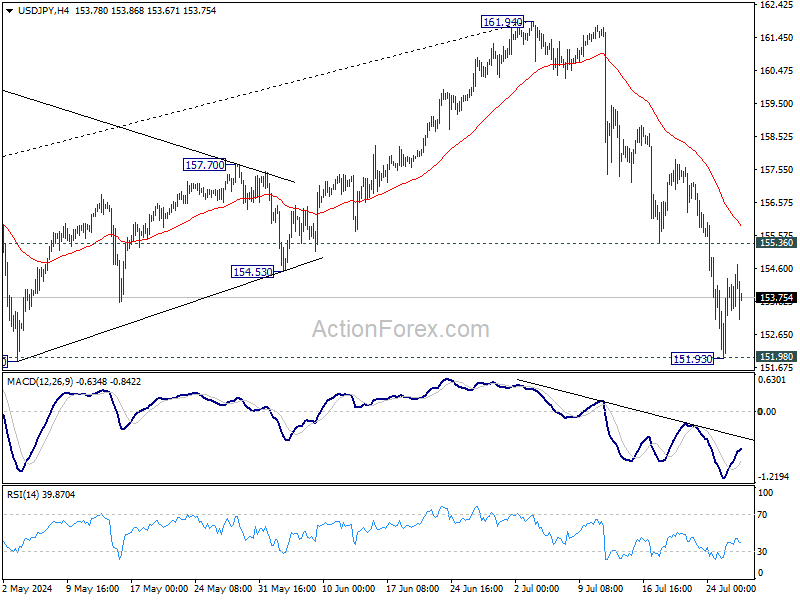
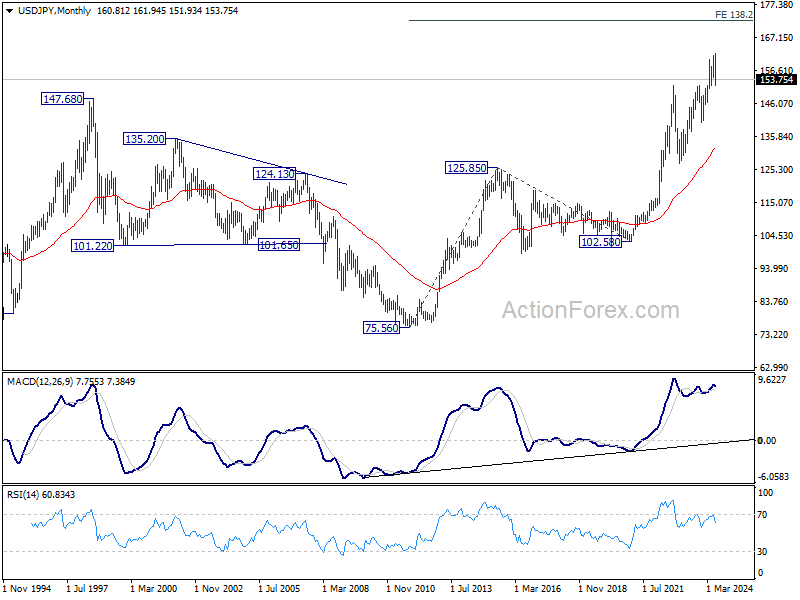
USD/JPY's fall from 161.94 extended to as low as 151.93 last week, but recovered after breaching 151.98 resistance turned support briefly. Initial bias remains neutral this week for consolidations. Risk will stay on the downside as long as 155.36 support turned resistance holds. Decisive break of 151.89 resistance turned support will argue that large scale correction is underway to 148.66 fibonacci level. Nevertheless, break of 155.36 will turn bias back to the upside for stronger rebound.
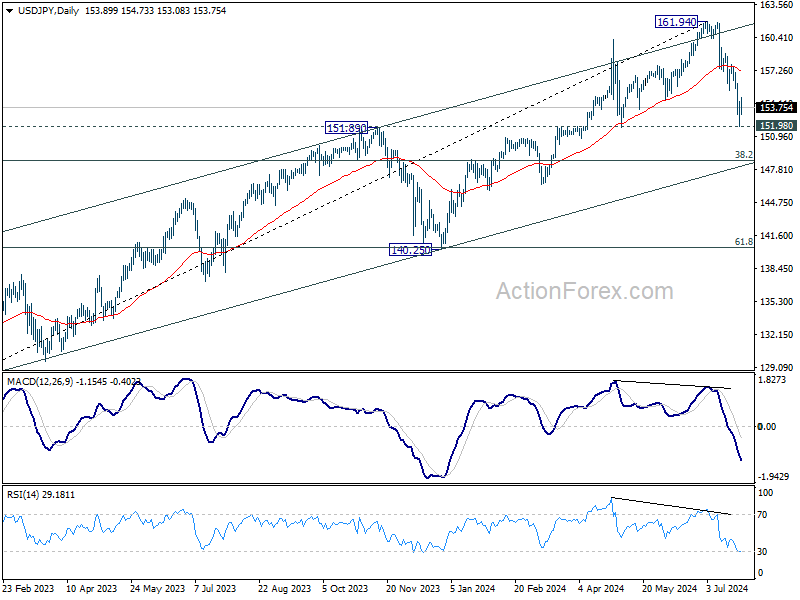
In the bigger picture, considering the depth and momentum of the current decline, 161.94 should be a medium term top already. Fall from there is seen as correcting the whole rise from 127.20 (2023 low) at least. Break of 151.89 will pave the way to 38.2% retracement of 127.20 to 161.94 at 148.66. Risk will now stay on the downside as long as 55 D EMA (now at 157.17) holds, in case of rebound.
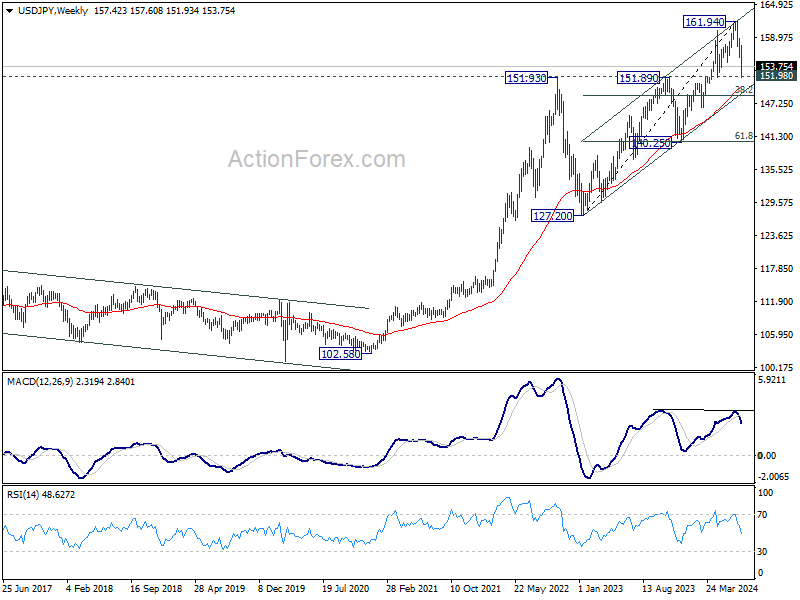
In the long term picture, as long as 140.25 support holds, up trend from 75.56 (2011 low) is still in progress. Next target is 138.2% projection of 75.56 (2011 low) to 125.85 (2015 high) from 102.58 at 172.08.
GBP/USD Weekly Outlook
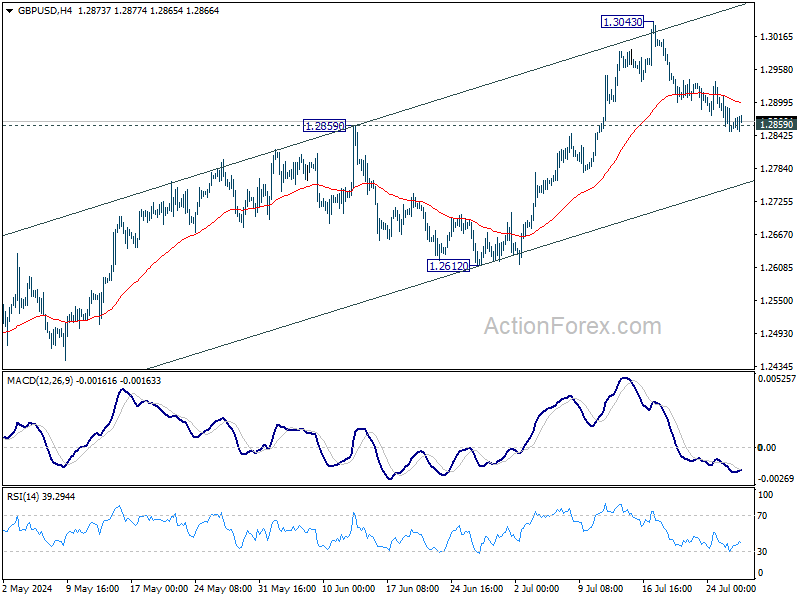
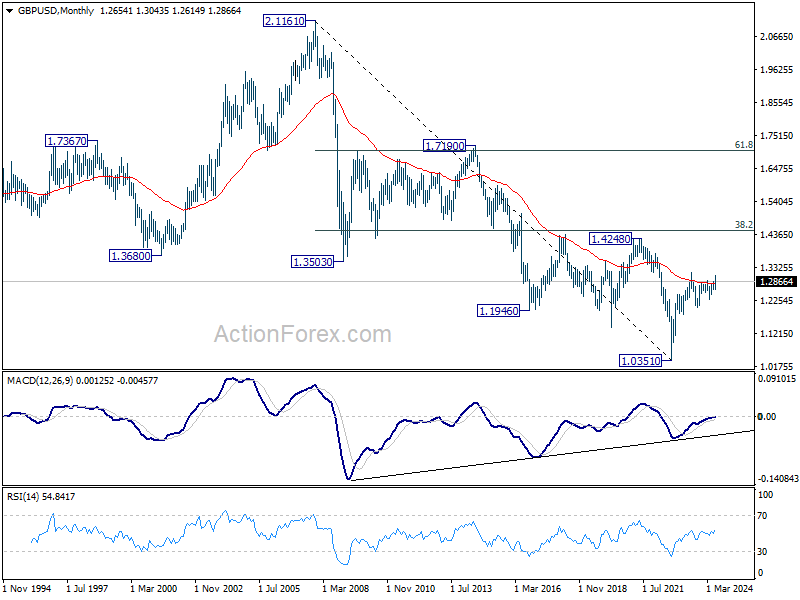
GBP/USD gyrated lower last week but failed to break through 1.2859 resistance turned support decisively. Initial bias remains neutral first. Further rally is in favor. Break of 1.3043 will resume the rise from 1.2298. However, firm break of 1.2859 will turn bias to the downside for deeper decline to 55 D EMA (now at 1.2771).
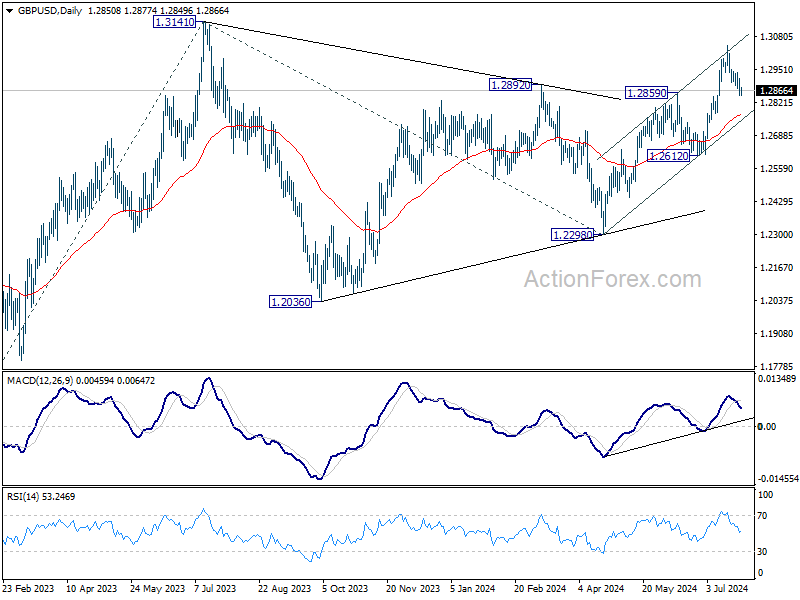
In the bigger picture, corrective pattern from 1.3141 medium term top (2023 high) could have completed with three waves to 1.2298 already. This will now remain the favored case as long as 1.2612 support holds. Firm break of 1.3141 will target 61.8% projection of 1.0351 (2022 low) to 1.3141 from 1.2298 at 1.4022.
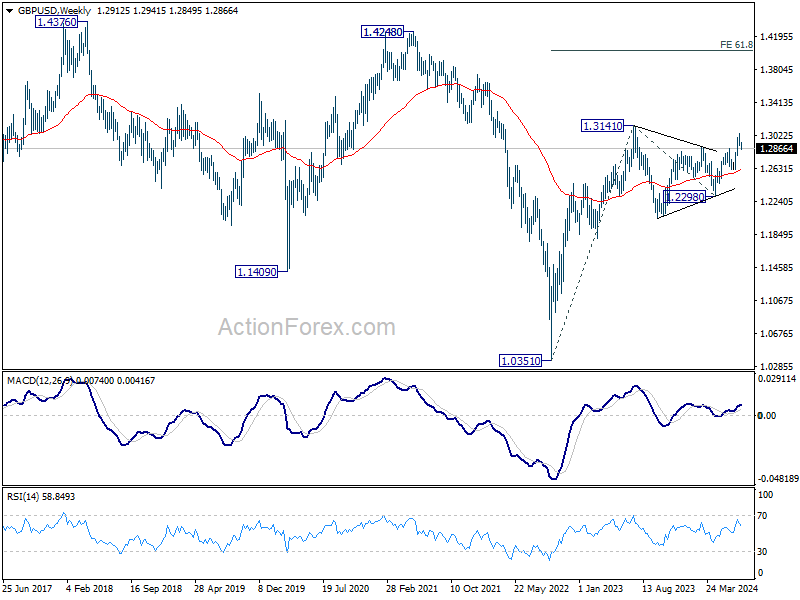
In the long term picture, as long as 1.2298 support holds, rise from 1.0351 long term bottom is expected to continue. But still, firm break of 1.4248 structural resistance is needed to indicate bullish trend reversal. Otherwise, price actions from 1.0351 are tentatively seen as a consolidation pattern only.
USD/CHF Weekly Outlook
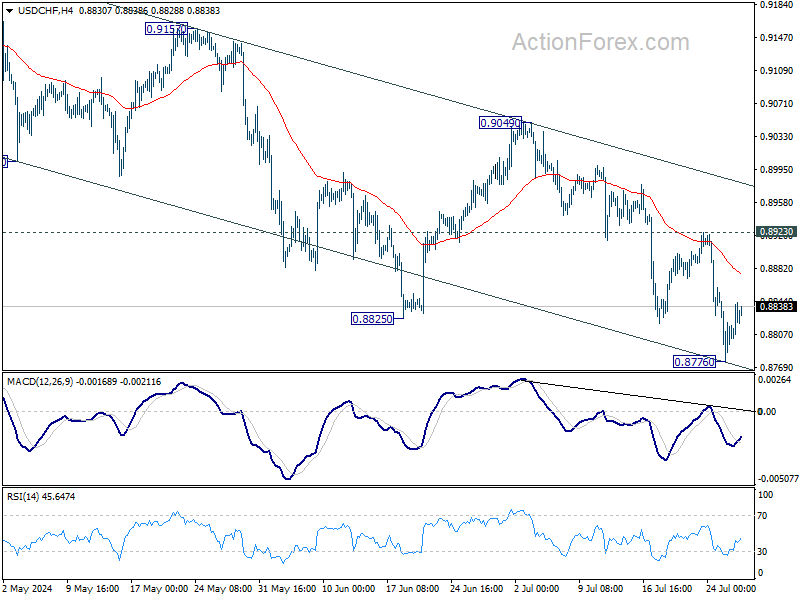
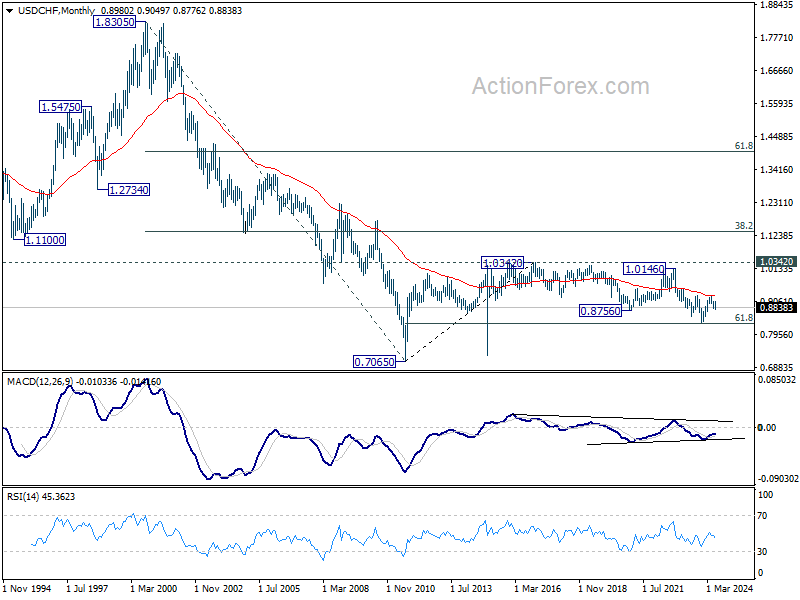
USD/CHF edged lower to 0.8776 last week but recovered again. Initial bias stays neutral this week first. As long as 0.8923 resistance holds, further decline is expected. On the downside, break of 0.8776 will resume the fall from 0.9223 to 61.8% retracement of 0.8332 to 0.9223 at 0.8672 next. However, break of 0.8923 will turn bias back to the upside for stronger rebound instead.
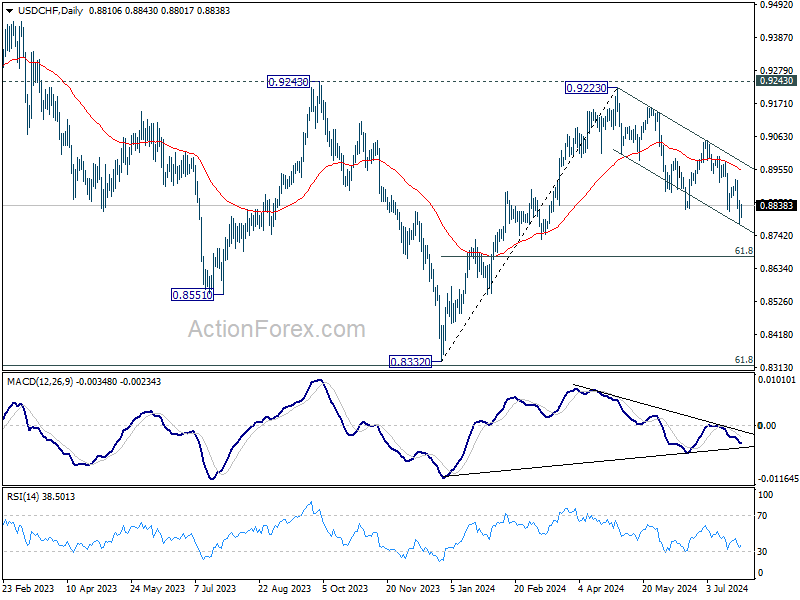
In the bigger picture, with 0.9243 resistance intact, medium term outlook in USD/CHF is neutral at best. For now, more sideway trading is likely between 0.8332/9243. However, firm break of 0.9243 will indicate larger bullish trend reversal.
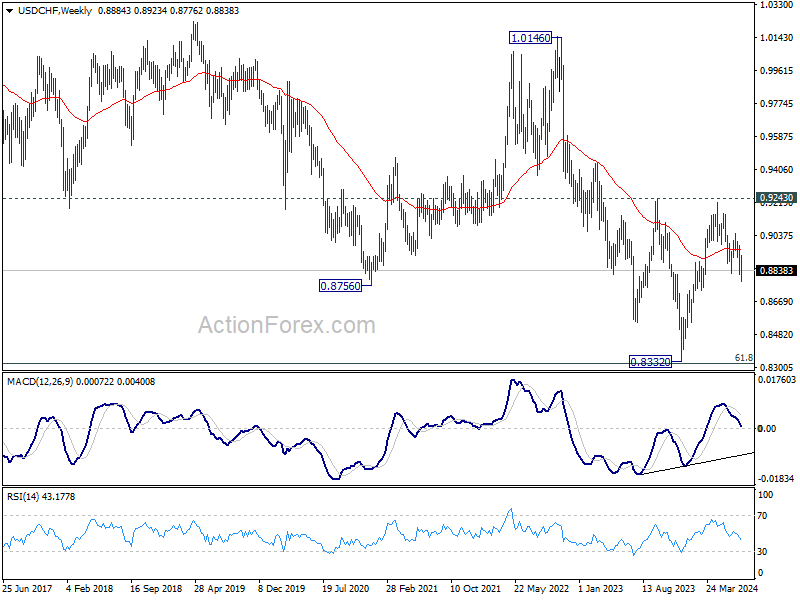
In the long term picture, price action from 0.7065 (2011 high) are seen as a corrective pattern to the multi-decade down trend from 1.8305 (2000 high). Strong rebound from 61.8% retracement of 0.7065 to 1.0342 (2016 high) at 0.8317 will start the third leg as a medium term rally. But there will be no sign of long term reversal until firm break of 38.2% retracement of 1.8305 to 0.7065 at 1.1359.
AUD/USD Weekly Report
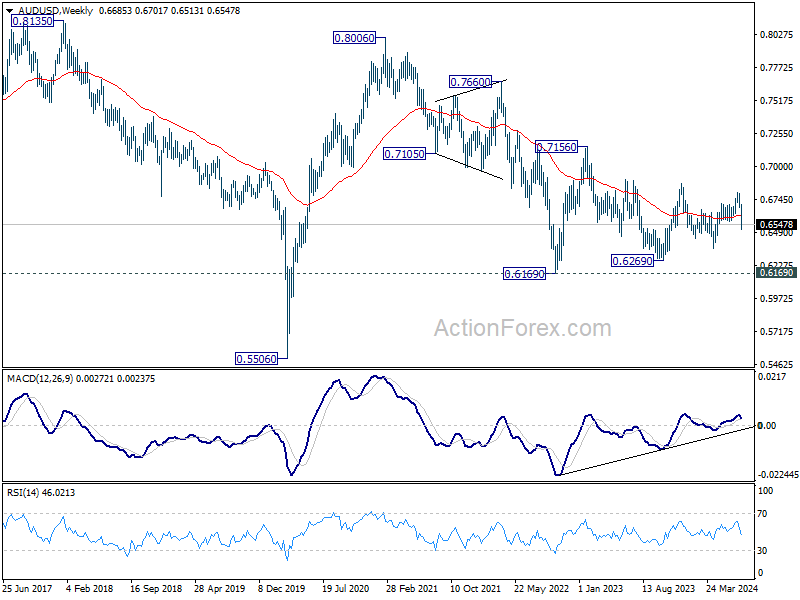
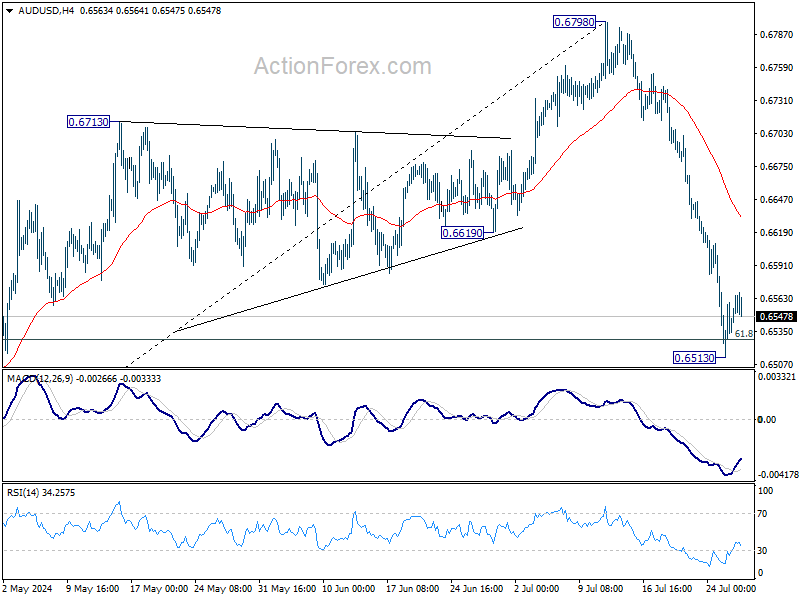
AUD/USD's fall from 0.6798 accelerated to as low as 0.6513 last week but recovered after breaching 61.8% retracement of 0.6361 to 0.6798 at 0.6528 briefly. Initial bias remains neutral this week for consolidations. Further fall is expected as long as 55 4H EMA (now at 0.6631) holds. Sustained break oft 0.6528 will pave the way back to 0.6361 support next.
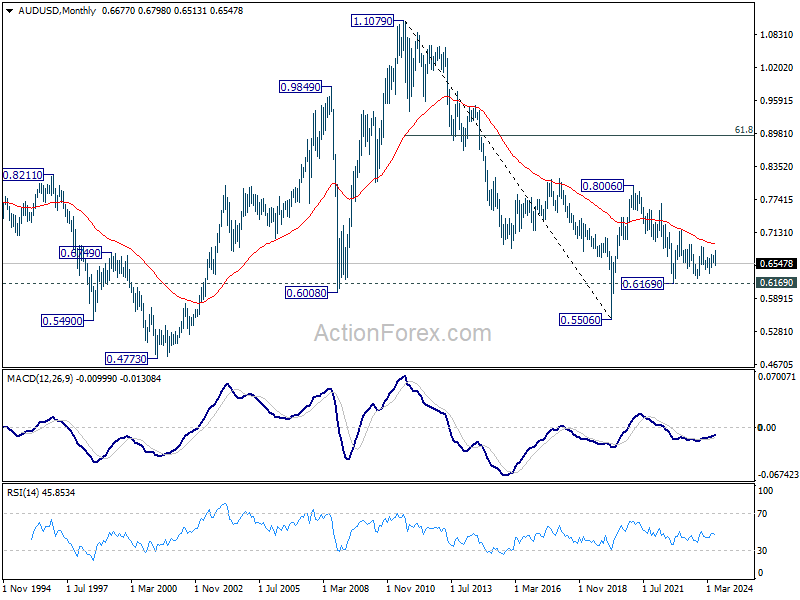
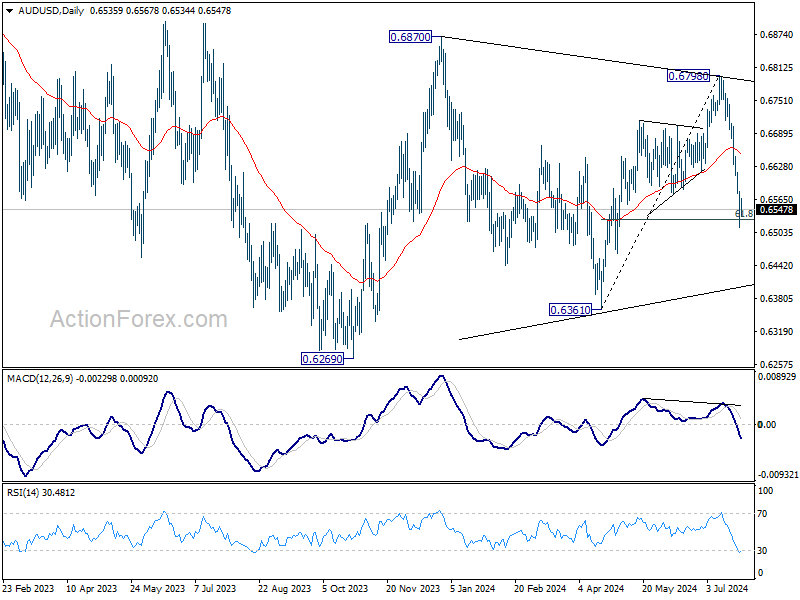
In the bigger picture, overall, price actions from 0.6169 (2022 low) are seen as a medium term corrective pattern, with fall from 0.6798 as another falling leg. Deeper fall could be seen to the lower side of the range between 0.6169/6361. But strong support should be seen there to contain downside. For now, risk will stay on the downside as long as 0.6798 resistance holds, in case of rebound.
In the long term picture, the down trend from 1.1079 (2011 high) should have completed at 0.5506 (2020 low) already. It's unsure yet whether price actions from 0.5506 are developing into a corrective pattern, or trend reversal. But in either case, fall from 0.8006 is seen as the second leg of the pattern. Hence, in case of deeper decline, strong support should emerge above 0.5506 to bring reversal.