Sample Category Title
GBP/USD: Stronger than Expected UK GDP Numbers Lift Cable to Four-Month High
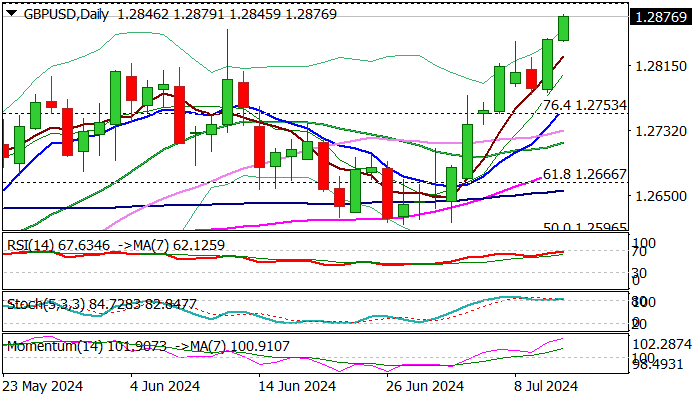
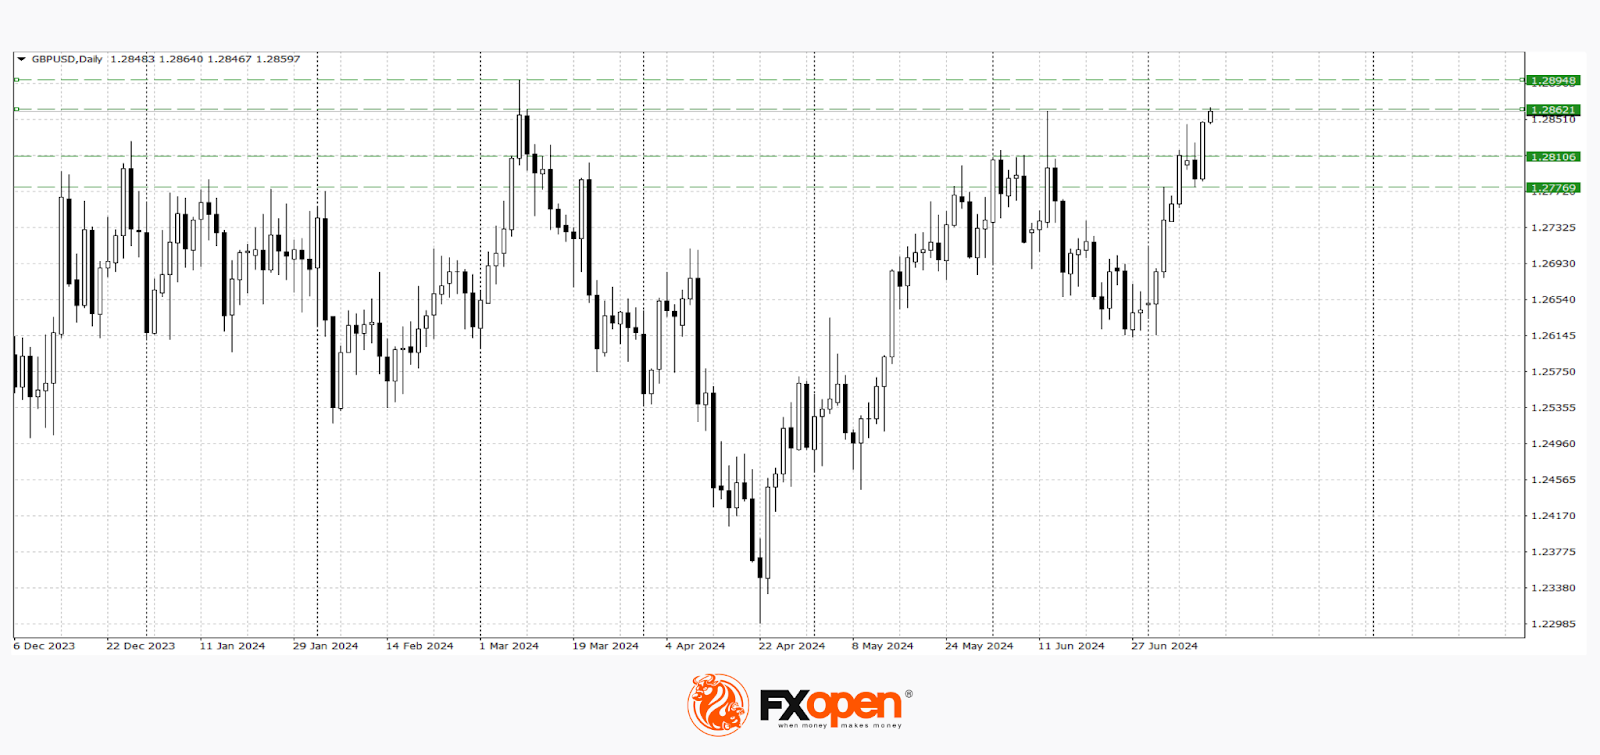
Cable hit new four-month high in European trading on Thursday, lifted by better than expected UK May GDP numbers, which poured cold water on expectations for BoE rate cut next month.
Fresh strength broke through pivotal barriers at 1.2846/60 (200WMA/former top June 12) and pressuring key barrier at 1.2893 (2024 high, posted on March 8).
Firmly bullish technical picture on daily chart (Tenkan/Kijun-sen forming a bull-cross and bullish momentum is strengthening) support the action, though headwinds on approach to 1.2893 could be expected, due to overbought conditions and significance of barrier.
Markets shift focus towards release of US June inflation report which is expected to provide fresh signals.
Weaker than expected US CPI numbers would further boost pound as further easing in consumer prices would bring the Fed one step closer to rate cut and subsequently deflate dollar.
Cable could accelerate through 1.2900 and probably challenge psychological 1.30 barrier, in case of stronger CPI downside miss.
Conversely, bulls may lose traction if US price pressures rise in June.
Session low (1.2845) offer initial support, followed by 1.2800/1.2780 (psychological / daily higher base and 1.2760/53 (rising 10DMA / broken Fibo 76.4% of 1.2893/1.2299).
Res: 1.2893; 1.2900; 1.2950; 1.3000.
Sup: 1.2845; 1.2800; 1.2780; 1.2753.
GBP/USD Hits 4-month High on Strong GDP
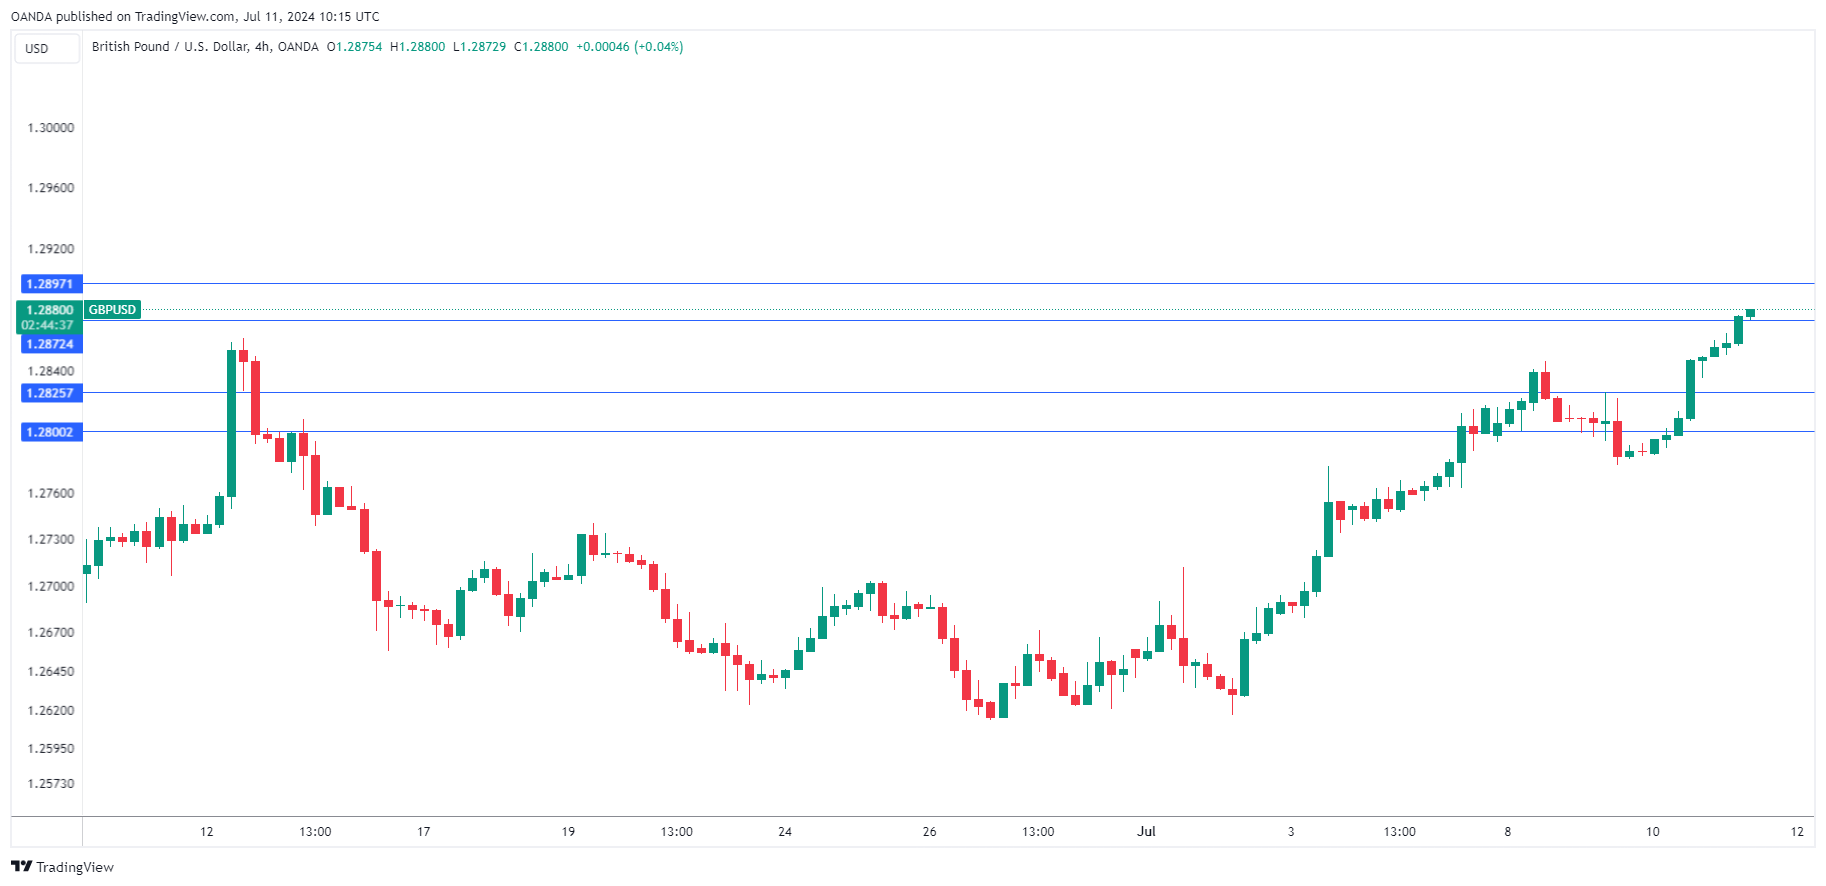
The British pound has extended its gains on Thursday. GBP/USD is trading at 1.2876 in the European session, up 0.22% on the day.
UK GDP beats expectations
The sun is shining in London today and there’s plenty to smile about besides the pleasant weather. England has punched their ticket to the final of the Euro football tournament and UK GDP was stronger than expected. The British pound headed higher and has hit its highest level since March 8.
The UK economy is showing signs of a rebound after slipping into a recession in the second half of 2023. Annualized GDP jumped 1.4% in May, up from a revised 0.6% in April and beating the 1.2% market estimate. Monthly, GDP improved to 0.4% after zero growth in April and above the market estimate of 0.2%.
The weather has played a significant role in the improved data. April was unusually rainy, which dampened consumer spending. May, however, was the warmest on record which revitalized retail sales.
Inflation has declined dramatically, from 11.1% in October 2022 down to 2% in May, matching the Bank of England’s inflation target. This has raised expectations that the BoE will deliver a rate cut but the central bank remains cautious. The BoE meets next on August 1 and markets expectations are a 50/50 coin toss as to whether the Bank will hold or take the plunge and lower rates.
In the US, Federal Reserve Chair Powell wrapped up two days of testimony before US lawmakers. Powell signaled that the Fed was moving closer to a rate cut decision but it was too early to declare victory over inflation and said “more good data” was needed before the Fed would feel confident lowering rates.
GBP/USD Technical
- GBP/USD is testing resistance at 1.2872. Above, there is resistance at 1.2897
- 1.2825 and 1.2800 are the next support levels
USD/CAD Price Outlook: 200-day MA Holds Ahead of US CPI Release
- USD/CAD has been range-bound, reflecting US Dollar Index consolidation and potential rate differential between Canada and the US.
- Canada’s volatile inflation and struggling labor market increase pressure on the Bank of Canada (BoC).
- USD/CAD is positioned between key moving averages, with a tight range suggesting a potential breakout following the inflation data.
USD/CAD has been confined to a 50-pip range since July 4, reflecting the historical price action and recent consolidation of the US Dollar Index.
The potential for a rate differential between Canada and the US is growing. The US economy has experienced three consecutive declines in headline inflation, contrasting with Canada’s choppy inflation since February, where declines have alternated with increases. This volatility poses a significant challenge for the Canadian Central Bank.
Canada’s labor market is also under strain, further complicating the Central Bank’s decisions. Market expectations for a rate cut are rising; however, if the Central Bank cuts rates while inflation remains elevated, it could lead to significant issues. Markets currently price in a 65.1% chance of a cut at the upcoming BoC meeting on July 24, 2024. A rate cut ahead of the Fed, combined with an unstable inflation picture, could propel USD/CAD to new yearly highs.
Bank of Canada (BoC) Interest Rate Probabilities.
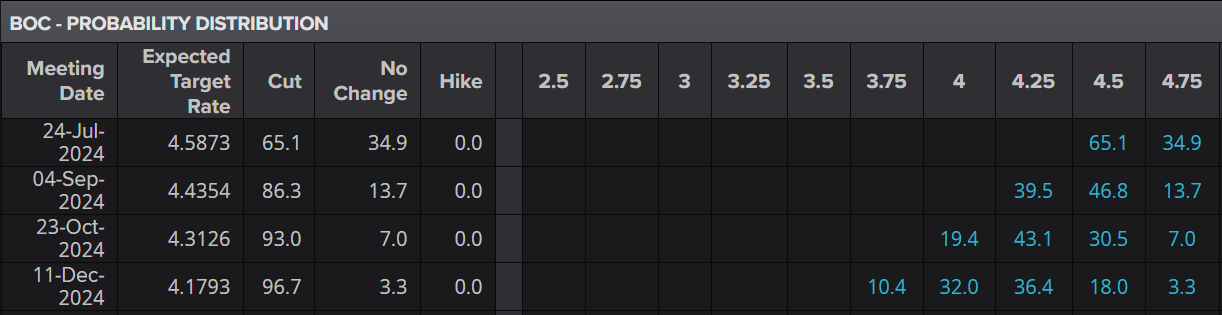
Source: The Kobeissi Letter
US CPI Data
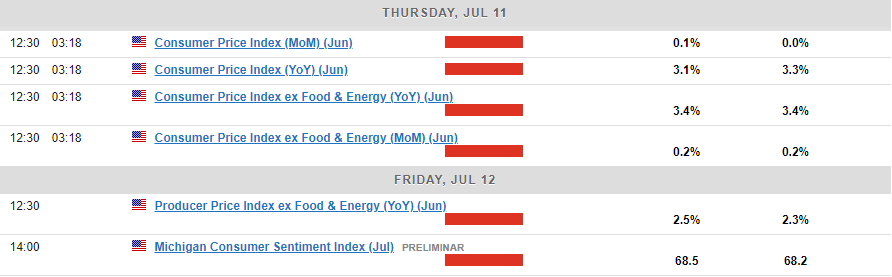
The focus this week has primarily been on the upcoming US inflation release. The data is expected to show that headline inflation moderated to 3.1% in June, down from 3.3%.
A result in line with or below the consensus figure should maintain interest among US Dollar doves. Such a print would likely keep rate cut probabilities at current levels or even increase them, potentially surpassing the 80% mark.
Technical Analysis
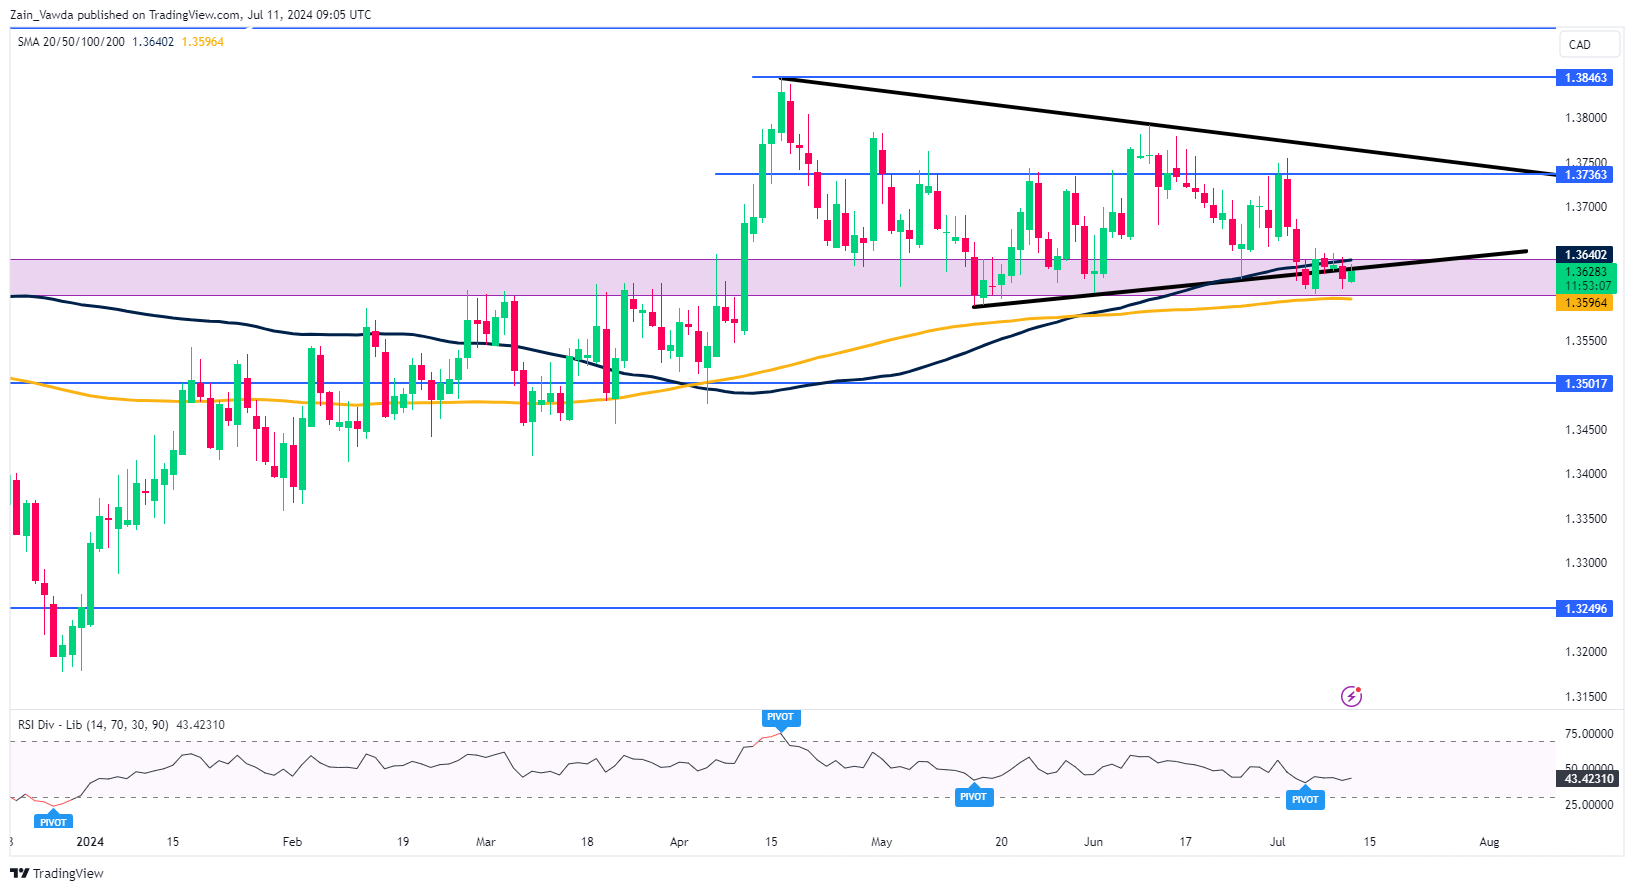
From a technical perspective, USD/CAD has remained within a 50-pip range over the past five trading days. Similarly, the US Dollar Index has shown comparable price action as market participants await a potential catalyst.
USD/CAD is currently situated between the 100-day moving average, providing resistance at 1.3640, and the 200-day moving average, offering support at 1.3596. This tight range and consolidation often precede an explosive or impulsive move, which could occur following today’s inflation data.
Support
- 1.3596 (200-day MA)
- 1.3500 (psychological level)
- 1.3450
- 1.3370 (February swing low)
Resistance
- 1.3640
- 1.3736
- 1.3846
- 1.4000 (Psychological level)
USD/CAD Daily Chart, July 11, 2024
Source: TradingView.com (click to enlarge)
Crypto Lacks Bulls
Market picture
It seems that all the market bulls have moved on to US and Japanese equities, avoiding cryptocurrencies. The cryptocurrency market failed to break out of its consolidation, and its capitalisation rolled back 1.3% to $2.13 trillion, inside the range from last Friday. Fear remains the main driver of the market.
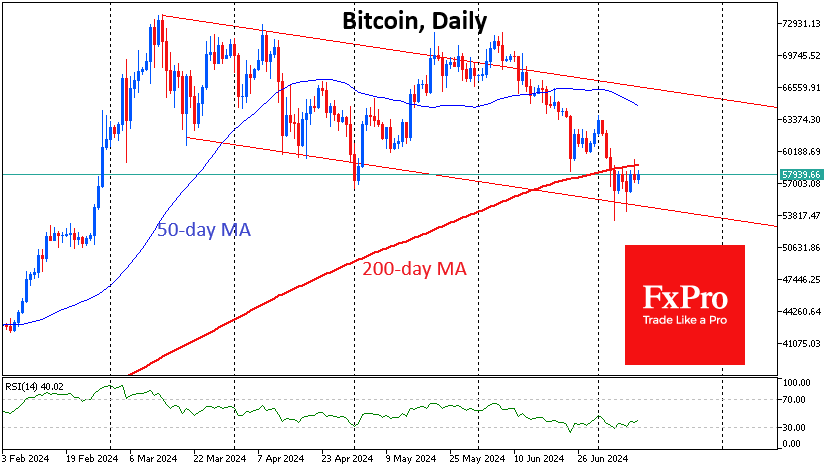
Bitcoin pulled back from its 200-day moving average, falling back below the $58K upper boundary of the last six-day range. The first cryptocurrency is under much more pressure than many altcoins, which are making a gradual recovery. A consolidation above $59K would be seen as a local victory for the Bulls.
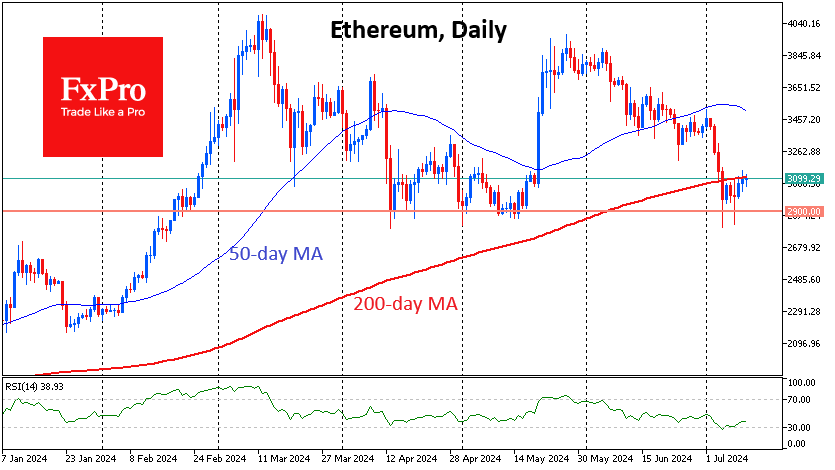
Ethereum is testing its 200-day MA near $3100 for the fourth day. So far, it has failed, but bullish candles are fixed for the third day in a row. Litecoin is also showing positive momentum, although, like Bitcoin, it is under pressure from expected payments to Mt. Gox creditors.
News background
Bitcoin’s most significant correction since late 2022, with a dip below the 200-day moving average (200-DMA), has brought unrealised losses to a significant portion of short-term speculators. Glassnode valued it at $595 million, its highest value since the 2022 cycle low.
Anthony Scaramucci, SkyBridge Capital founder, expects Bitcoin to reach $100K by the end of the year. The growth factor may be the upcoming payment of $16bn to clients of the bankrupt crypto exchange FTX. Scaramucci believes a significant part of these funds will be invested in Bitcoin.
On 10 July, German authorities transferred another 5,103 BTC ($299.8 million) to trading platforms. The German Federal Criminal Police Office (BKA) has 18,860 BTC ($1.11bn) left in its wallet.
In January, German police seized 49,857 BTC from the administrators of the pirate film website Movie2k. Blockchain Research Lab noted that this is standard procedure for confiscated funds. The remaining coins will likely be realized soon.
Bitwise said it has reached “the finish line” on the Ethereum-ETF issue. By now, there are “fewer and fewer” issues related to the S-1 filing between the SEC and the eight potential ETF issuers.
Japanese Yen Faces Continued Decline Amid Interest Rate Differentials
The USD/JPY pair has risen to 161.65, with the market cautious ahead of today's US consumer price index release. Despite this, the yen remains weakened by the significant interest rate differential between the Bank of Japan (BoJ) and the Federal Reserve.
Earlier this year, the BoJ abandoned its longstanding negative interest rate policy, adjusting the rate to zero. However, this adjustment has not halted the yen's depreciation, raising concerns about the currency's ongoing decline.
Investors eagerly await the BoJ's meeting in July, where crucial decisions on bond purchases are expected. The outcome of this meeting could mark a significant shift in Japan's monetary policy.
Mixed economic signals from Japan
Morning statistics from Japan showed mixed results. Core machinery orders declined by 3.2% month-on-month in May, following a 2.9% decrease the previous month. However, on an annual basis, these orders increased by 10.8%, surpassing the expected 7.2% growth, suggesting some underlying strength in the industrial sector.
USD/JPY technical analysis
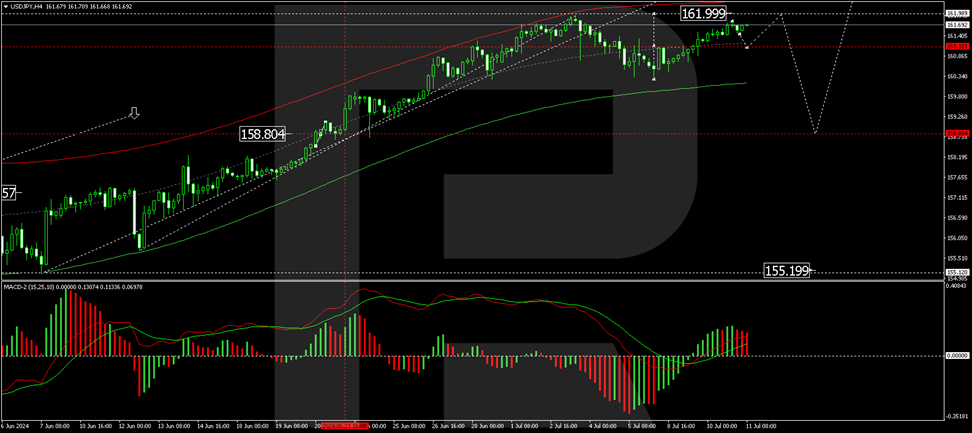
The USD/JPY is establishing a consolidation range around 161.12. The price could reach up to 162.00, considered a local target within the current upward trend. Following this level, a correction to 158.80 is anticipated, which could lead to another growth phase targeting 163.30. This bullish outlook is supported technically by the MACD indicator, where the signal line is prominently above zero and oriented upward.
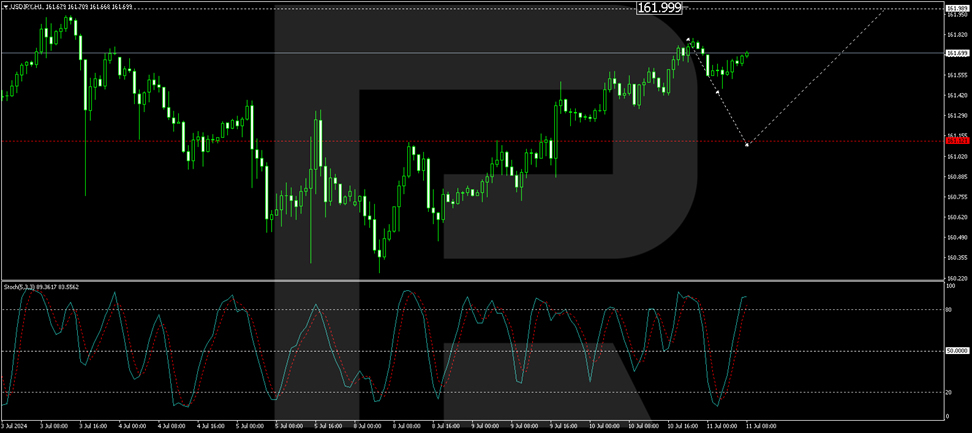
On the H1 chart, the pair has completed a growth structure reaching 161.79. Currently, a downward impulse to 161.47 has been observed. A continuation of this correction to 161.12 is expected, which should precede another rise to 162.00. This analysis is corroborated by the Stochastic oscillator, with the signal line poised to drop from above 80 to 20, indicating potential short-term pullbacks before further gains.
Investors and traders will closely monitor upcoming data releases and central bank communications to gauge the potential directions for both the yen and broader currency markets.
AUDUSD Posts a Fresh 6-month High
- AUDUSD breaks decisively above sideways pattern
- The price jumps to its highest since January 2024
- Oscillators are flagging overbought conditions
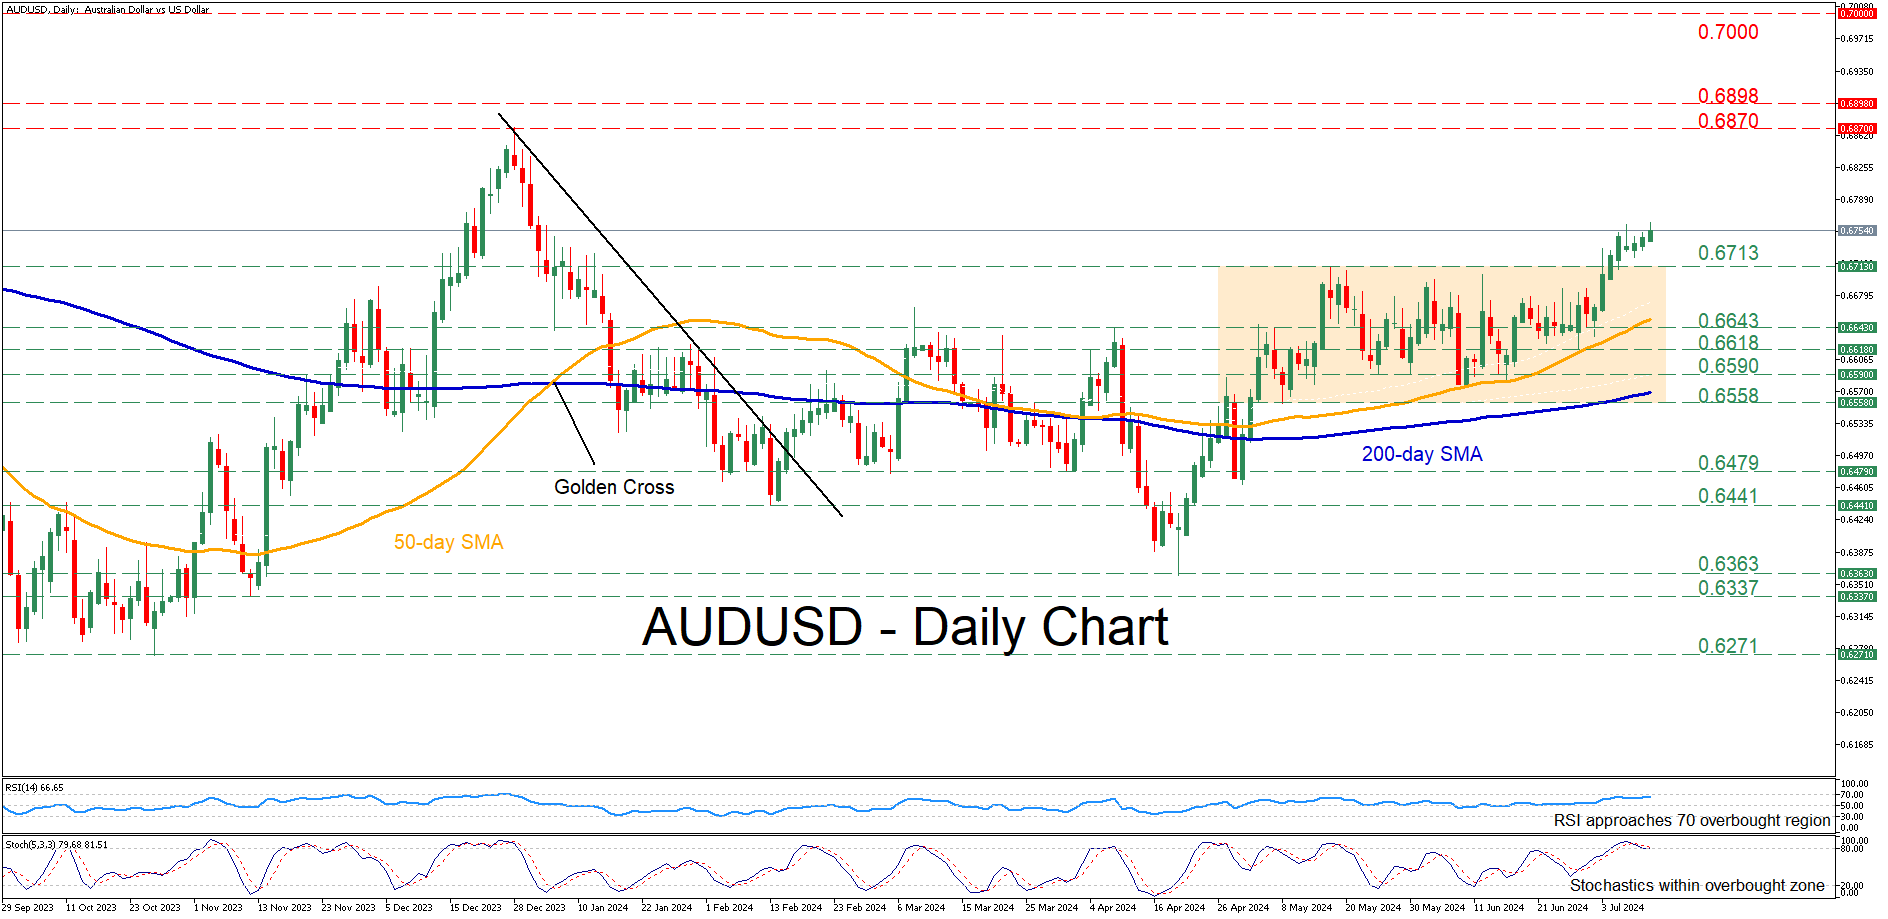
AUDUSD had been trading in a neutral range for more than two months, unable to adopt a clear directional impetus. However, in the last few sessions, the bulls have managed to propel the pair above that rangebound structure, sending it to a six-month high on Thursday.
If the pair marches towards fresh highs, there is no prominent resistance until the December 2023 peak of 0.6870. Failing to halt there, the pair may advance towards the double top region of 0.6898, registered last summer. Higher, the 0.7000 psychological mark might come under examination.
On the flipside, should the pair reverse lower, immediate support could be found at the May resistance of 0.6713. A violation of that hurdle could send the price back within its neutral structure, where the April-May resistance of 0.6643 could now serve as support. Further declines could then come to a halt at the June support of 0.6618.
In brief, AUDUSD has gained momentum after the break above its neutral structure, storming to a fresh six-month peak. However, the risk of an impending pullback is evident as both the RSI and stochastics are warning of an overstretched advance.
Markets Awaiting US Inflation Data: What is the Probability of Trend Reversals?
The major currency pairs are in a holding pattern following the release of the latest US labour market data and Jerome Powell's testimony before Congress. The Fed Chair noted that the Federal Reserve has made "significant progress" in its mission to combat inflation, but emphasized the need for "more good data" before lowering interest rates. Judging by the movements of the major currency pairs, the market appears sceptical of the Fed Chair's statements:
- The AUD/USD pair has refreshed the May highs of the current year and strengthened above 0.6700.
- The USD/CAD pair is trading near strategic support at 1.3610.
- The GBP/USD pair is approaching the March highs near 1.2900.
As we can see, the US dollar is slowly but surely losing ground in many directions, but by the end of the week, existing trends could either slow down or change direction dramatically.
AUD/USD
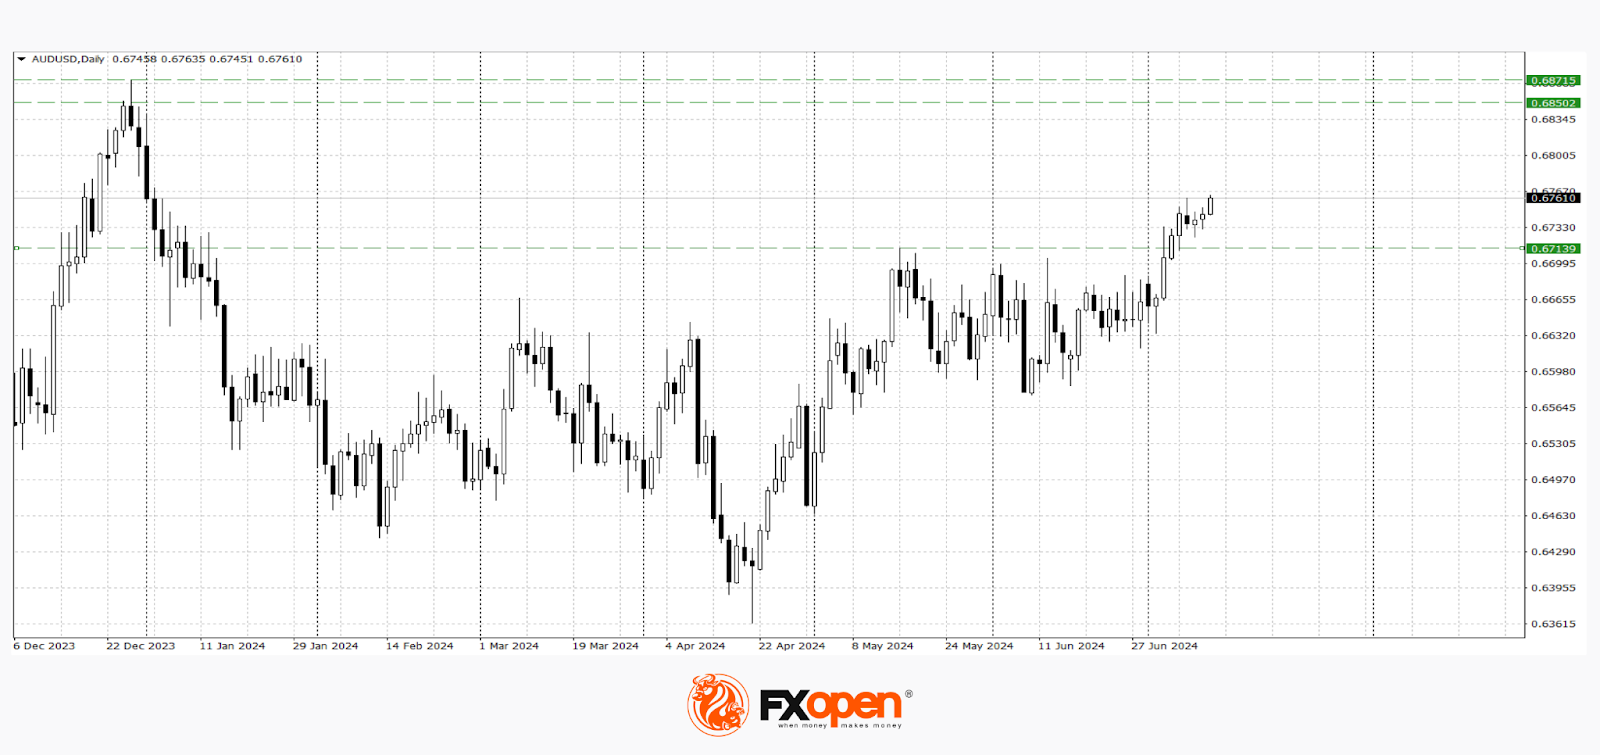
Technical analysis of the AUD/USD pair indicates the possibility of continued growth, as the May high of the current year has been refreshed, and the price has managed to strengthen above the significant resistance level of 0.6700. The nearest area for consolidation is the range of 0.6870-0.6850. In the event of a corrective pullback, the pair may test 0.6720-0.6700. The following events could increase the pair's volatility:
- Today at 15:30 (GMT +3), the release of the US Consumer Price Index (CPI) for June.
- Today at 15:30 (GMT +3), the weekly release of initial jobless claims in the US.
- Tomorrow at 04:00 (GMT +3), the release of the MI Inflation Expectations in Australia.
GBP/USD
Buyers of the GBP/USD pair have managed to refresh the May high of the current year and are directing the price towards significant resistance at 1.2900. If this level transitions to support, the price could continue to rise towards 1.3100-1.3000. The nearest levels for a downward pullback are located around 1.2800-1.2760.
This morning, we are expecting the UK GDP data for May. At 15:00 (GMT +3), attention should be paid to the release of the NIESR monthly GDP tracker for the UK.
Trade over 50 forex markets 24 hours a day with FXOpen. Take advantage of low commissions, deep liquidity, and spreads from 0.0 pips. Open your FXOpen account now or learn more about trading forex with FXOpen.
This article represents the opinion of the Companies operating under the FXOpen brand only. It is not to be construed as an offer, solicitation, or recommendation with respect to products and services provided by the Companies operating under the FXOpen brand, nor is it to be considered financial advice.
Market Analysis: EUR/USD Jumps, USD/JPY Bulls Seem Unstoppable
EUR/USD is climbing higher above the 1.0800 level. USD/JPY surged above the 160.00 and 161.40 resistance levels.
Important Takeaways for EUR/USD and USD/JPY Analysis Today
- The Euro started a decent increase above the 1.0780 pivot level.
- There is a key bullish trend line forming with support near 1.0820 on the hourly chart of EUR/USD at FXOpen.
- USD/JPY climbed higher above the 160.50 and 161.40 levels.
- There is a connecting bullish trend line forming with support near 161.55 on the hourly chart at FXOpen.
EUR/USD Technical Analysis
On the hourly chart of EUR/USD at FXOpen, the pair started a fresh increase from the 1.0710 zone. The Euro cleared a few key hurdles near 1.0780 to move into a positive zone against the US Dollar.
The pair settled above the 1.0800 level and the 50-hour simple moving average. A high was formed at 1.0845 and the pair is now consolidating gains. There was a test of the 23.6% Fib retracement level of the upward move from the 1.0710 swing low to the 1.0845 high.
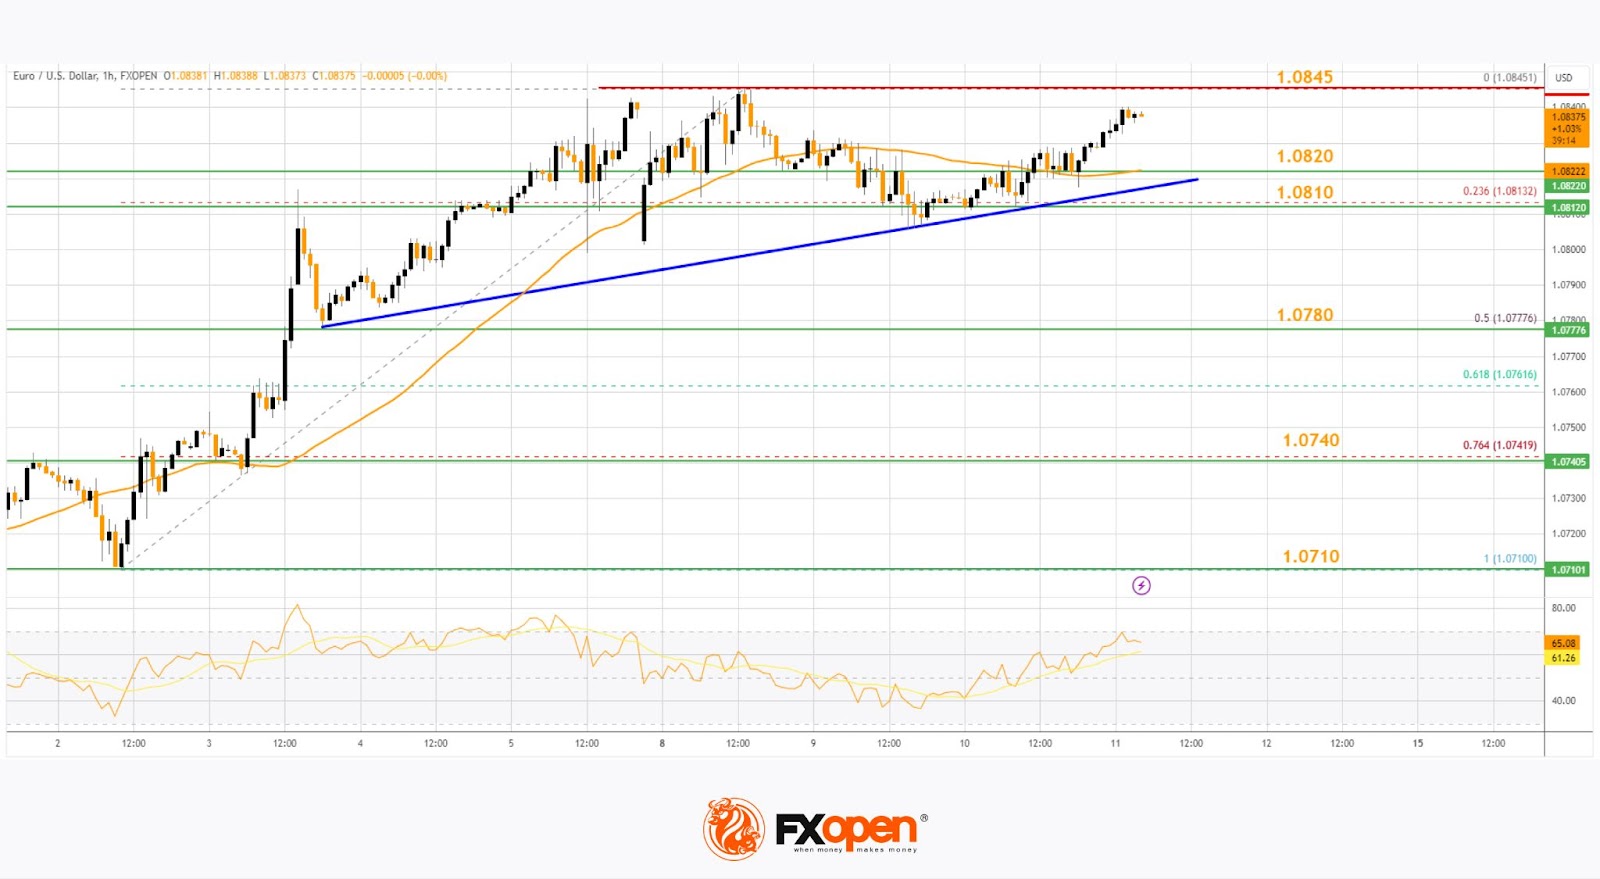
However, the bulls are active above the 1.0800 zone. Immediate support is near a key bullish trend line at 1.0820. The first major support on the EUR/USD chart is near 1.0820.
The next key support is near the 50% Fib retracement level of the upward move from the 1.0710 swing low to the 1.0845 high at 1.0780. If there is a downside break below 1.0780, the pair could drop toward 1.0740. The next support is near 1.0710, below which the pair could start a major decline.
On the upside, the pair is now facing resistance near the 1.0845 zone. The next major resistance is near 1.0880. An upside break above 1.0880 could set the pace for another increase. In the stated case, the pair might rise toward 1.0920.
USD/JPY Technical Analysis
On the hourly chart of USD/JPY at FXOpen, the pair started a major increase from the 160.25 zone. The US Dollar gained bullish momentum above 160.80 against the Japanese Yen.
It settled above the 50-hour simple moving average and 161.40. The upward move was such that the pair cleared the 61.8% Fib retracement level of the last key decline from the 161.95 swing high to the 160.25 low.
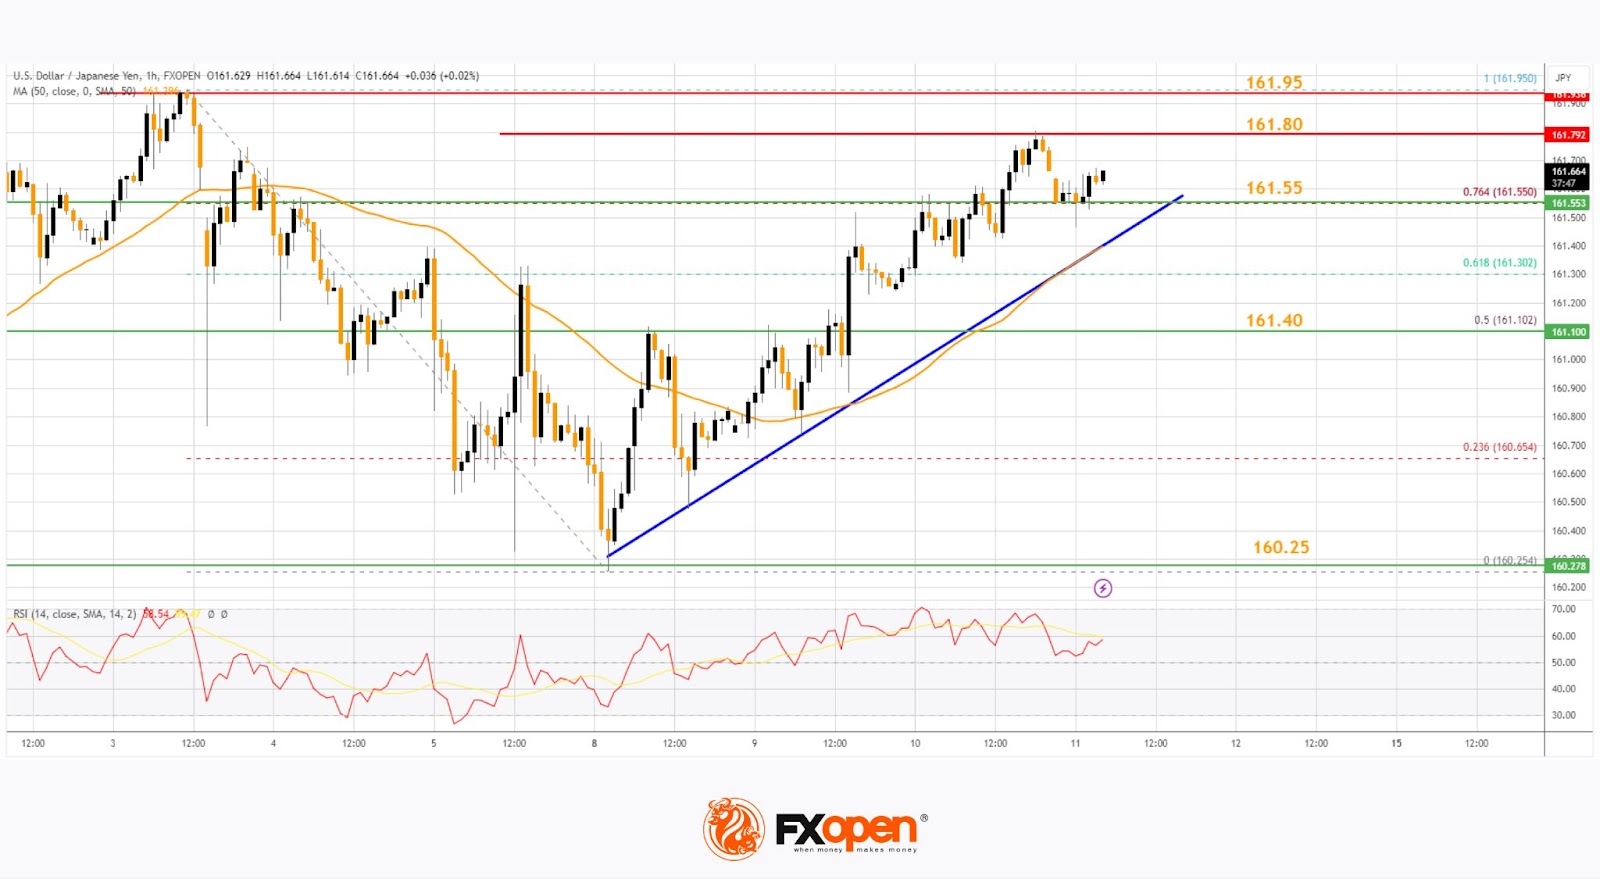
The current price action is positive, and the pair seems to be consolidating above the 76.4% Fib retracement level of the last key decline from the 161.95 swing high to the 160.25 low, suggesting more upsides.
Immediate resistance on the USD/JPY chart is near 161.80. The first major resistance is near 161.95. If there is a close above the 161.95 level and the RSI moves above 60, the pair could rise toward 162.50.
The next major resistance is near 163.20, above which the pair could test 165.00 in the coming days. On the downside, the first major support is near the trend line at 161.55. The next major support is near the 161.40 pivot level.
If there is a close below the 50-hour simple moving average and 161.40, the pair could decline steadily toward 160.25. In the stated case, the pair might drop toward 158.80. The next major support sits at 156.50.
This article represents the opinion of the Companies operating under the FXOpen brand only. It is not to be construed as an offer, solicitation, or recommendation with respect to products and services provided by the Companies operating under the FXOpen brand, nor is it to be considered financial advice.
Trade over 50 forex markets 24 hours a day with FXOpen. Take advantage of low commissions, deep liquidity, and spreads from 0.0 pips. Open your FXOpen account now or learn more about trading forex with FXOpen.
This article represents the opinion of the Companies operating under the FXOpen brand only. It is not to be construed as an offer, solicitation, or recommendation with respect to products and services provided by the Companies operating under the FXOpen brand, nor is it to be considered financial advice.
GBP/JPY Daily Outlook
Daily Pivots: (S1) 206.68; (P) 207.25; (R1) 208.34; More...
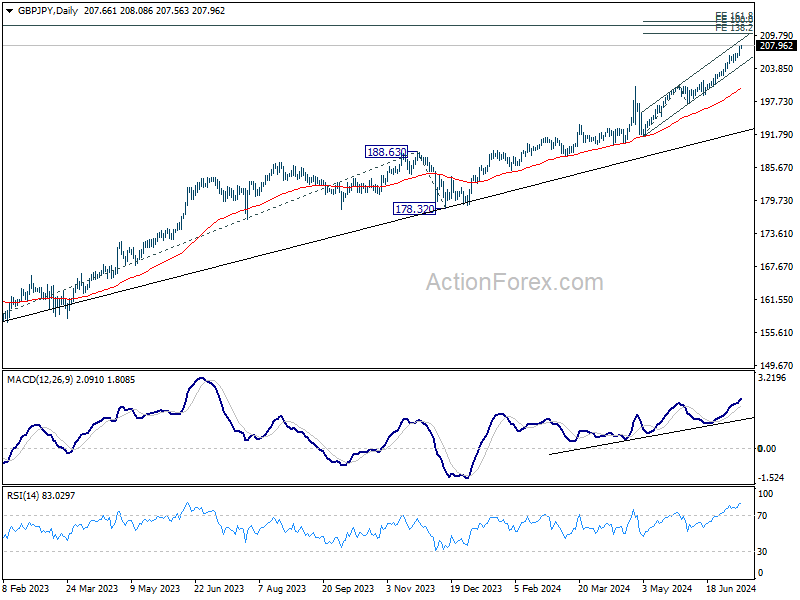
GBP/JPY's rally resumed and hits as high as 208.08 so far. Intraday bias is now on the upside for 138.2% projection of 191.34 to 200.72 from 197.18 at 210.17. On the downside, below 206.12 minor support will turn intraday bias neutral and bring consolidations first.
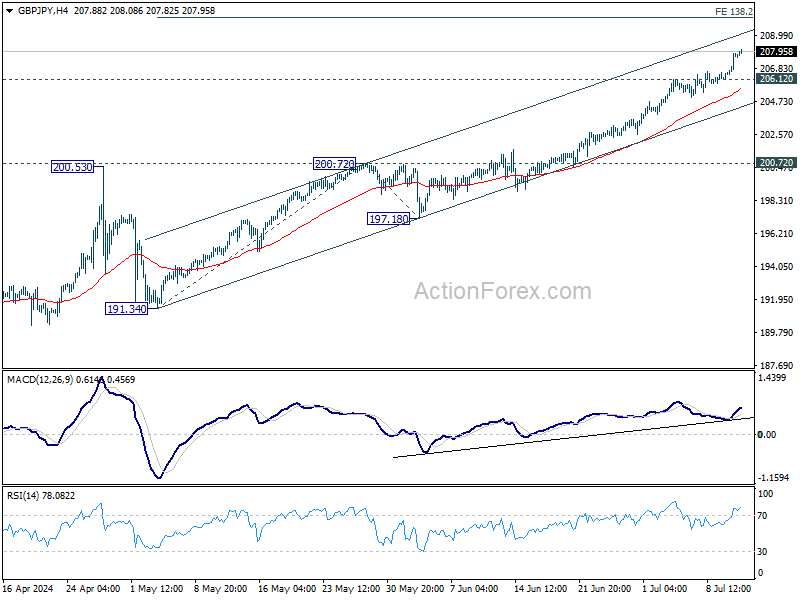
In the bigger picture, long term up trend is still in progress. Next target is 100% projection of 155.33 to 188.63 from 178.32 at 211.62. Outlook will stay bullish as long as 200.72 resistance turned support holds, even in case of deep pullback.
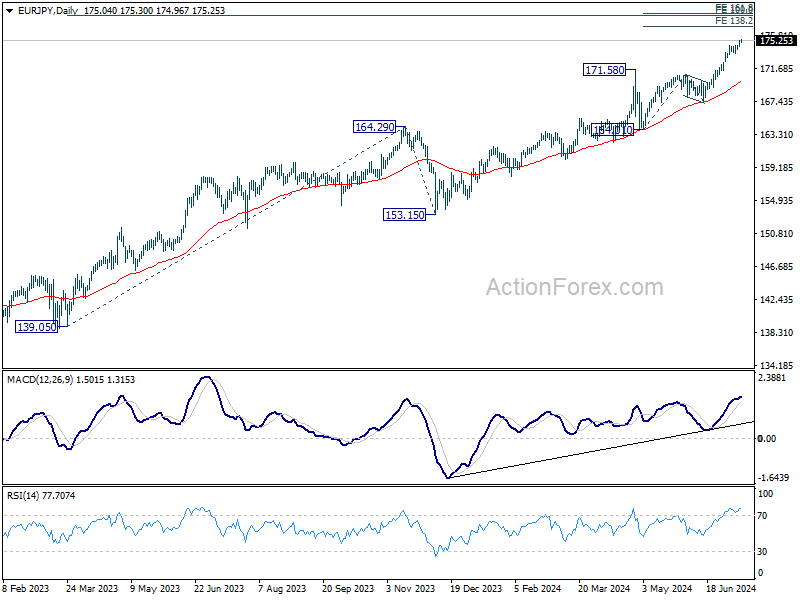
EUR/JPY Daily Outlook
Daily Pivots: (S1) 174.50; (P) 174.83; (R1) 175.45; More...
EUR/JPY's rally continues today and intraday bias remains on the upside. Current up trend should target 138.2% projection of 164.01 to 170.87 from 167.52 at 177.00. For now, outlook will remain bullish as long as 173.50 support holds, in case of retreat.
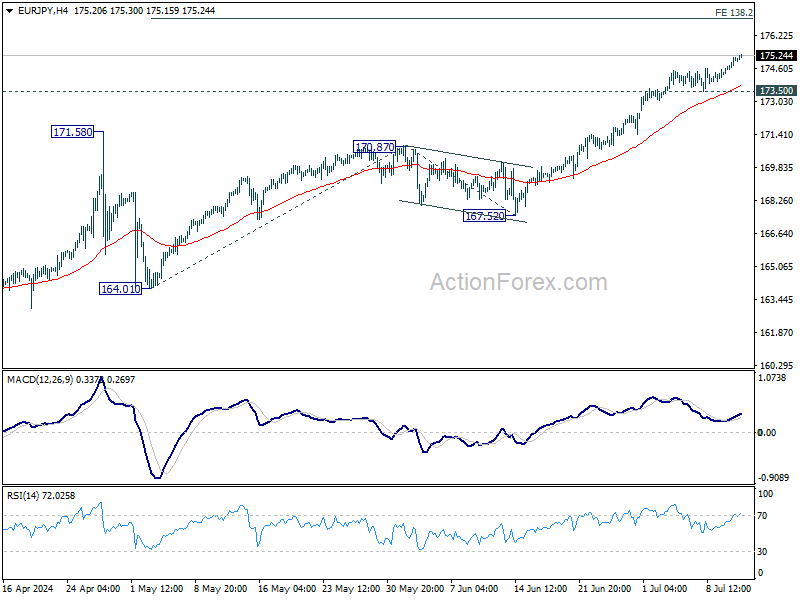
In the bigger picture, long term up trend is still in progress. Next target is 100% projection of 139.05 to 164.29 from 153.15 at 178.38. For now outlook will stay bullish as long as 170.7 resistance turned support holds, even in case of deep pullback.