

Sample Category Title
USD/CAD Daily Outlook
Daily Pivots: (S1) 1.3740; (P) 1.3766; (R1) 1.3784; More...
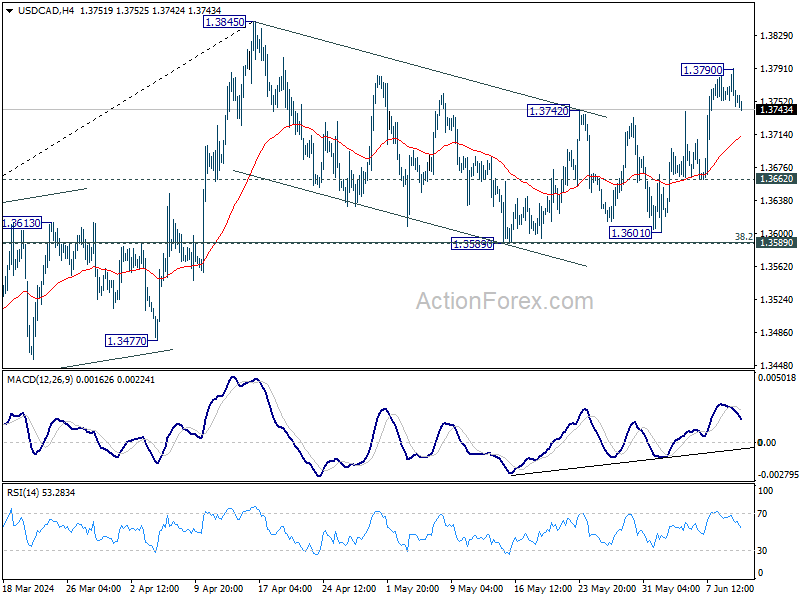
Intraday bias in USD/CAD is turned neutral with current retreat. Further rise is expected as long as 55 4H EMA (now at 1.3711) holds. Correction from 1.3845 might have completed at 1.3589 already. Above 1.3790 will bring retest of 1.3845 high. However, sustained break of 55 4H EMA will dampen this week and bring deeper fall to 1.3662 support first.
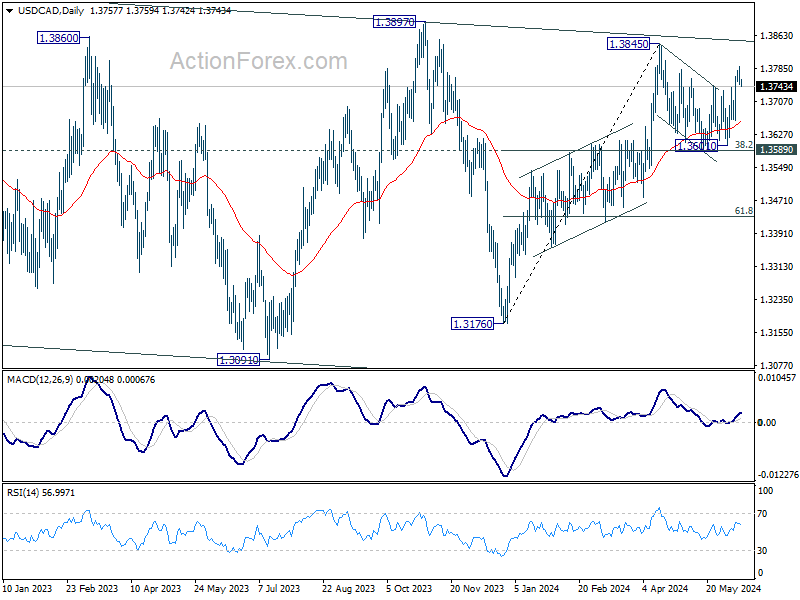
In the bigger picture, price actions from 1.3976 (2022 high) are viewed as a corrective pattern. In case of another fall, strong support should emerge above 1.2947 resistance turned support to bring rebound. Firm break of 1.3976 will confirm up resumption of whole up trend from 1.2005 (2021 low). Next target is 61.8% projection of 1.2401 to 1.3976 from 1.3176 at 1.4149.
AUD/USD Daily Report
Daily Pivots: (S1) 0.6592; (P) 0.6603; (R1) 0.6617; More...
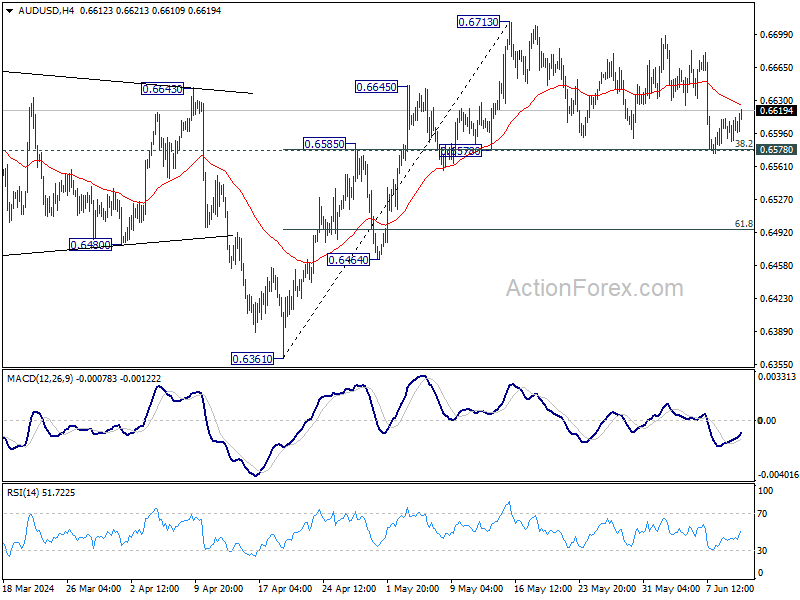
AUD/USD is staying in range below 0.6713 and intraday bias stays neutral. On the upside, firm break of 0.6713 will resume whole rise from 0.6361 to 0.6870 resistance next. However, sustained break of 0.6578 cluster support (38.2% retracement of 0.6361 to 0.6713 at 0.6579) will dampen this bullish view, and bring deeper fall to 61.8% retracement at 0.6495.
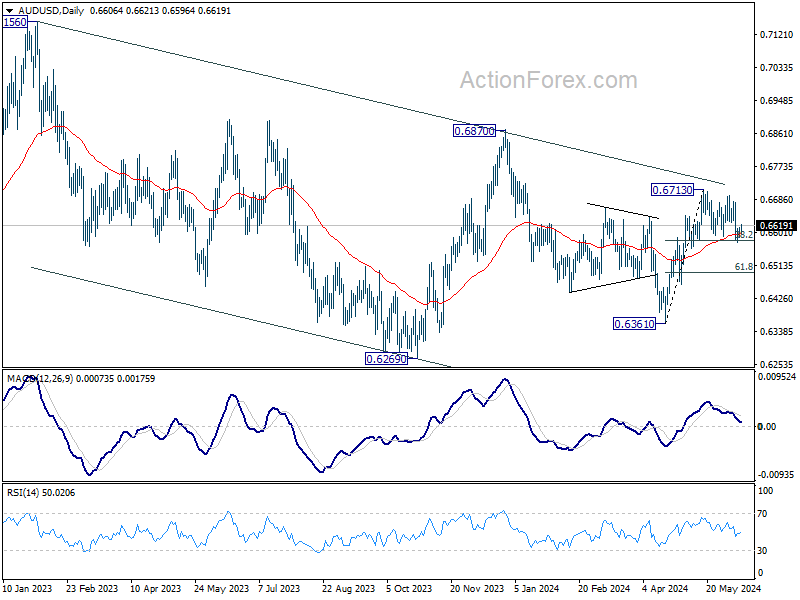
In the bigger picture, price actions from 0.6169 (2022 low) are seen as a medium term corrective pattern to the down trend from 0.8006 (2021 high). Fall from 0.7156 (2023 high) is seen as the second leg, which could have completed at 0.6269 already. Rise from there is seen as the third leg which is now trying to resume through 0.6870 resistance.
EUR/USD Daily Outlook
Daily Pivots: (S1) 1.0715; (P) 1.0745; (R1) 1.0769; More....
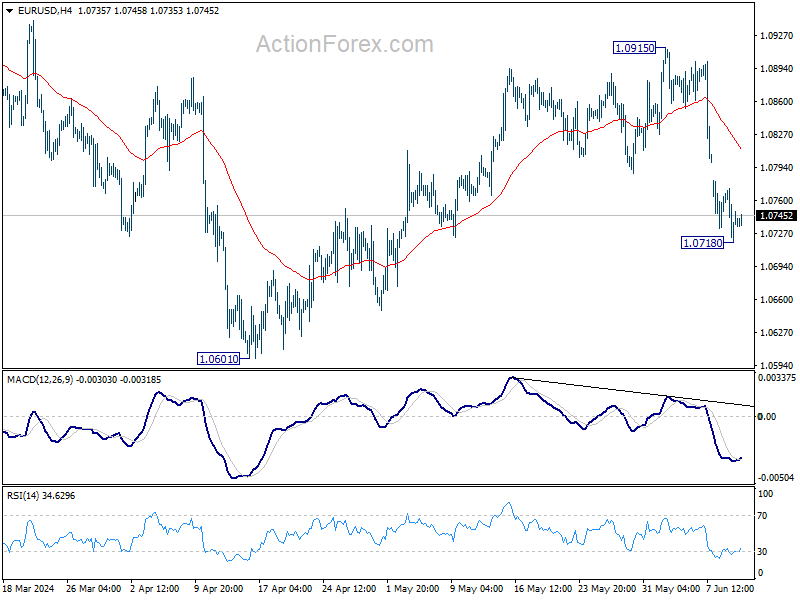
Intraday bias in EUR/USD is turned neutral first with 4H MACD crossed above signal line. Further fall is in favor as long as 55 4H EMA (now at 1.0814) holds. Decline from 1.0915 is seen as another falling leg of the corrective pattern from 1.1274. Break of 1.0718 will target 1.0601 support next. Nevertheless, sustained trading above 55 4H EMA will bring stronger rebound back towards 1.0915 resistance.
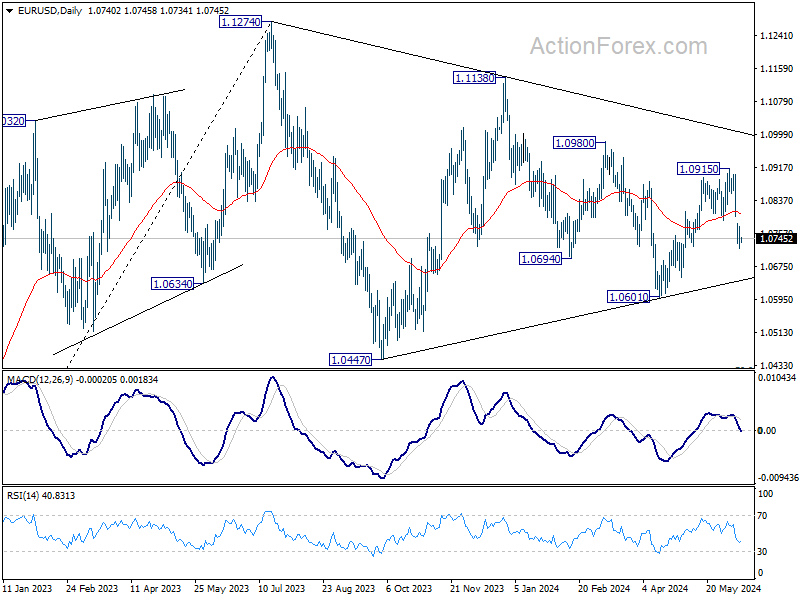
In the bigger picture, price actions from 1.1274 are viewed as a corrective pattern, which might still be in progress. Break of 1.0601 will target 1.0447 support and possibly below. Nevertheless, on the upside, firm break of 1.1138 will argue that larger up trend from 0.9534 (2022 low) is ready to resume through 1.1274 high.
GBP/USD Daily Outlook
Daily Pivots: (S1) 1.2713; (P) 1.2732; (R1) 1.2759; More...
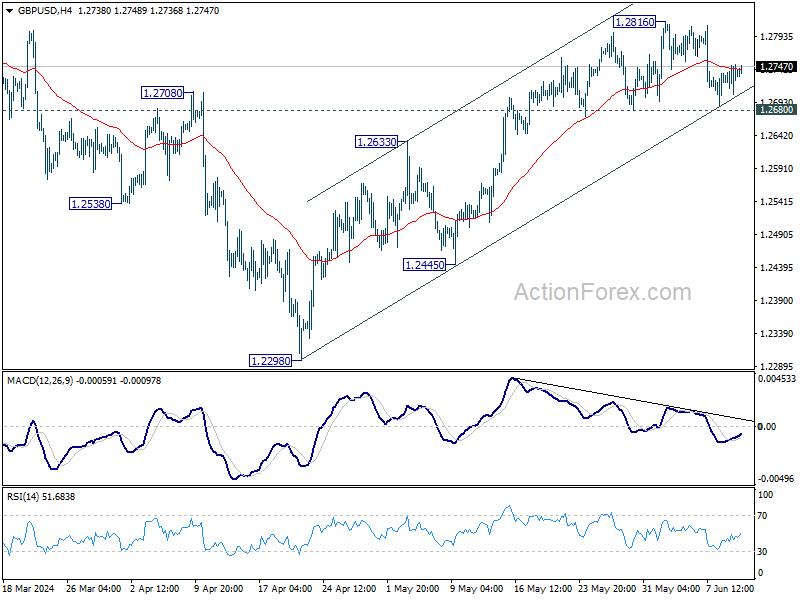
Sideway trading continues in GBP/USD and intraday bias stays neutral. Considering bearish divergence condition in 4H MACD, firm break of 1.2680 support will turn bias back to the downside for 55 D EMA (now at 1.2658) and below. Nevertheless, break of 1.2816 will resume the rise from 1.2298 to 1.2892 resistance.
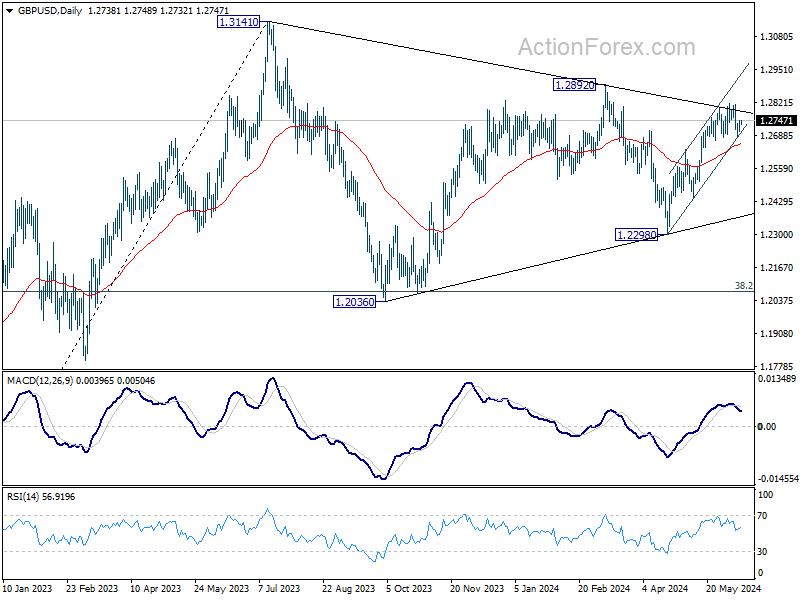
In the bigger picture, price actions from 1.3141 medium term top are seen as a corrective pattern. Fall from 1.2892 is seen as the third leg which might have completed already. Break of 1.2892 resistance will argue that larger up trend from 1.0351(2022 low) is ready to resume through 1.3141. Meanwhile, break of 1.2445 support will extend the corrective pattern with another decline instead.
USD/JPY Daily Outlook
Daily Pivots: (S1) 156.83; (P) 157.12; (R1) 157.43; More...
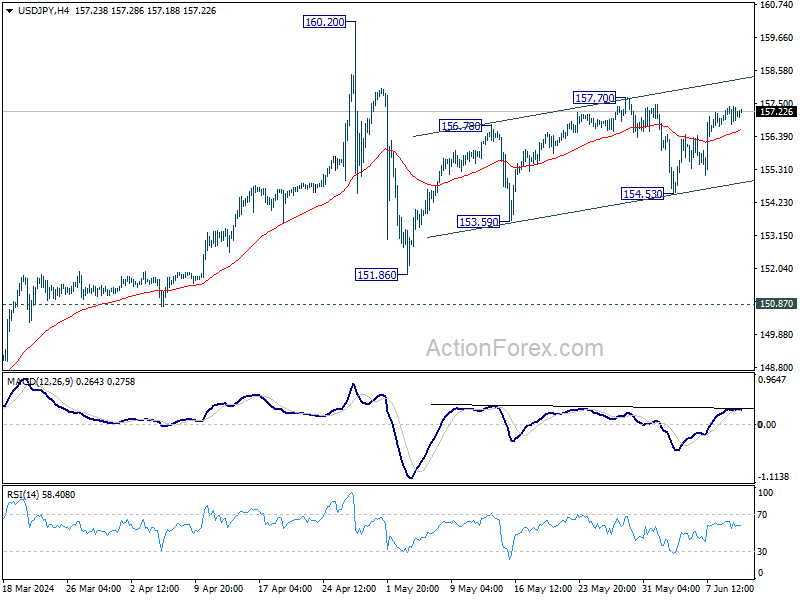
No change in USD/JPY's outlook as range trading continues. On the upside, break of 157.70 will resume the whole rise from 151.86 and target 160.20 high. Nevertheless, break of 154.53 will turn bias to the downside for 151.86 support and possibly below, as the third leg of the corrective pattern from 160.20.
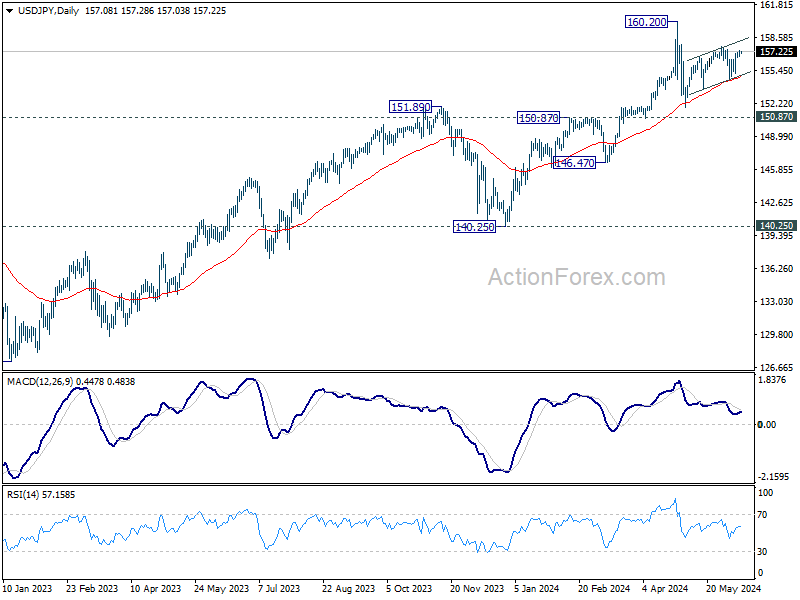
In the bigger picture, a medium term top should be formed at 160.20. As long as 55 W EMA (now at 147.77) holds, fall from 160.20 is seen as correcting the rise from 140.25 only. However, sustained break of 55 W EMA will argue that larger correction is possibly underway, and target 146.47 support next.
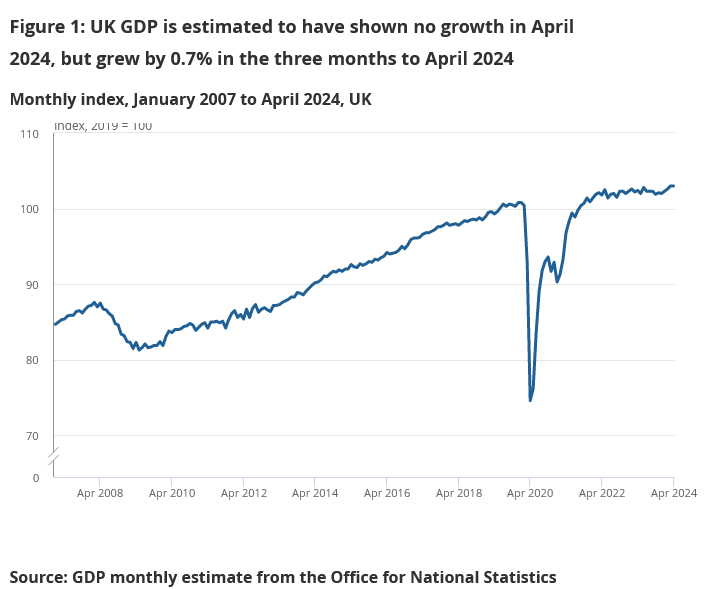
UK GDP holds steady in April as services offset declines in production and construction
UK GDP showed no growth in April, aligning with market expectations. The data reveals a mixed picture, with certain sectors compensating for declines in others.
Services output grew by 0.2% mom, marking its fourth consecutive month of growth, underscoring the resilience of the services sector. Conversely, production output fell by -0.9% mom, reflecting ongoing challenges in the industrial sector. Construction output declined by -1.4% mom, continuing its downward trend for the third straight month.
Looking at the three-month period from February to April compared to the preceding three months from November to January, GDP grew by 0.7%. Within this period, services expanded by 0.9%, driven by consistent monthly gains. Production also showed a positive trend with a 0.7% increase, despite the monthly volatility. However, construction suffered a -2.2% decline, indicating sustained weakness in this sector.
A Meli-Melo of Politics and Economics
We have different moods on different continents this week. The European equities remained under the pressure of heating French political tensions on Tuesday, as the Republican President Ciotto suggested that his party should consider teaming up with Le Pen’s party – a limit that many Republicans still consider as being a thick red line that should never be breached. Some ask Ciotti to resign. Bref, the unrest continues, the French 10-year yield continues to push to the upside, the spread between the French and German 10-year yield went past 60bp, the CAC 40 is at the weakest level since February while the EURUSD remains heavily offered. The pair is preparing to test the 1.07 support to the downside.
Meanwhile, on the other side of the Atlantic Ocean, the major stock indices in the US advanced to fresh records on the back of a strong 10-year auction a day before the latest CPI update and the Federal Reserve (Fed) decision. The US 2-year yield gave back a part of the post-jobs strength, the 10-year yield tipped a toe below 4.40%, the S&P500 advanced to a fresh record, helped by softer yields and a wonderful 7% jump in Apple shares on company’s AI plans that came with a 24-hour delay.
Good news is that the good mood from the US is giving a meagre smile to the European equity futures at the time of writing.
Perhaps the most important day of summer
Today is a big day in terms of economic data and Fed announcement - it could determine the global market mood for the rest of the month, and a good part of summer.
First, the US will reveal its latest CPI update: core CPI is expected to have eased from 3.5% to 3.4% on a yearly basis, but headline CPI is seen steady near 3.4%. These numbers are nowhere near the Fed’s 2% target and are not trending sufficiently fast toward that level, but a surprise to the downside could fuel the Fed cut bets for later this year.
Then, the Fed will announce that it’s not changing its rates today but will release the latest dot plot where the Fed members will plot how many rate cuts they think they could announce in the future. I am confident that the number of median rate cuts projected by the Fed members will be less than three that was plotted back in March. But whether it will be one or two is yet to be seen.
Note that the major US indices’ advance toward fresh ATH levels hides a rising stress on the banks front. In fact, the SPDR’s banks and regional banks indices both declined to the lowest levels since April as Pimco warned of a ‘very high’ concentration of troubled commercial real estate loans on the regional banks’ books. And the more the Fed waits before cutting its rates, the more the commercial real estate troubles could rise to the surface.
While the US yields are giving back the post-jobs advance, and the softer yields echo well across the major indices, the US dollar index remains upbeat by inflation and Fed uncertainties, and the political shenanigans on this side of the Atlantic Ocean.
Labour good for mood?
While the election uncertainty in France doesn’t do much good to the euro, the pound sterling looks much less battered by the idea that the Conservatives will likely say Good Bye to their majority next month. In fact, a recent survey from Bloomberg hinted that a Labour win would be better for both the pound, gilts and stocks – which is unusual. But because Brexit, Truss and endless infighting damaged Tories’ reputation over the years, it’s likely that the end of the normally-market-friendly Tories’ rule resonates well across markets. Cable is holding ground above the minor 23.6% retracement on April to June rebound and the toppish view is mostly due to the US dollar’s strength.
Britain has 22 more days to go until the UK election and Labour holds more than 20 points lead over the Tories, and yesterday’s big claimant count change and the rise of the unemployment rate to 4.4% certainly didn’t help improve Tories popularity, even though the softening inflation has clearly helped Rishi Sunak hold his promise to halve inflation (but we know that falling inflation was mostly due to global dynamics and – partly – to the Bank of England’s (BoE) tight monetary policy). Anyway, this week’s weak jobs data increases the chances of a BoE cut once the election dust settles while the pound sterling is expected to be better off in the scenario of changing government than status quo. Whether Cable could continue to rise, however, depends on where the US dollar is headed. And where the US dollar is headed depends on the US inflation, the health of the US economy and the Fed.
USD/CHF Daily Outlook
Daily Pivots: (S1) 0.8955; (P) 0.8974; (R1) 0.8996; More….
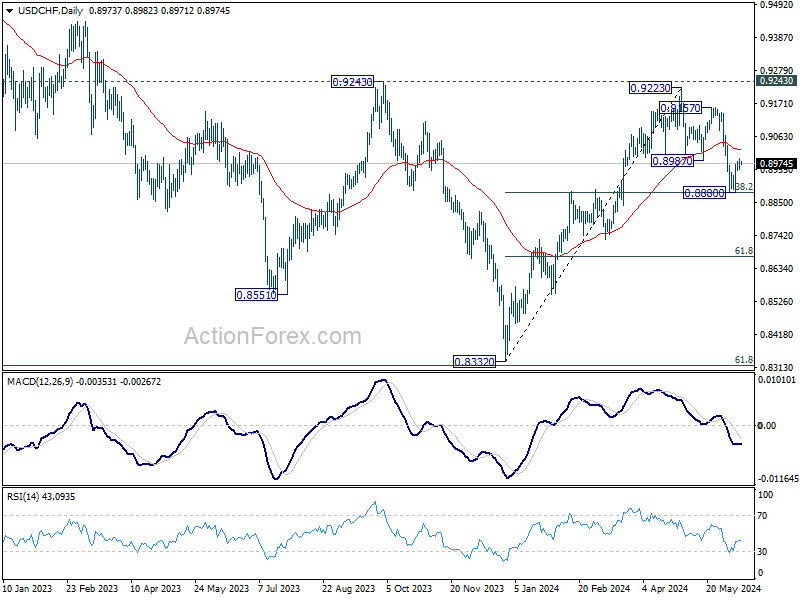
USD/CHF failed to break through 0.8987 support turned resistance decisively despite breaching it. Intraday bias stays neutral first. On the upside, firm break of 0.8987 support turned resistance will argue that correction from 0.9223 has completed, after drawing support from 0.8883 fibonacci level. Intraday bias will be back on the upside for 0.9157/9223 resistance zone. Nevertheless, sustained break of 0.8883 fibonacci level will carry larger bearish implications and bring deeper decline.
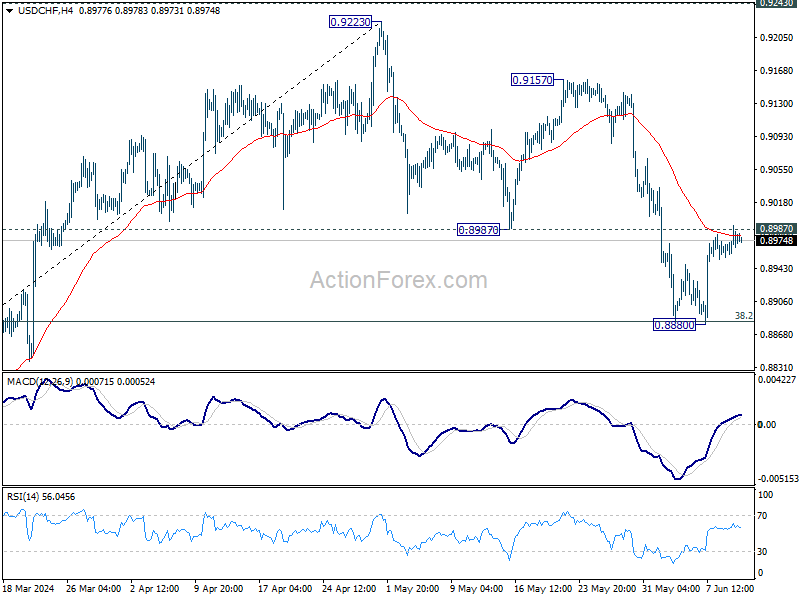
In the bigger picture, price actions from 0.8332 medium term bottom are tentatively seen as developing into a corrective pattern to the down trend from 1.0146 (2022 high). Rejection by 0.9243 resistance, followed by sustained break of 38.2% retracement of 0.8332 to 0.9223 at 0.8883 will strengthen this case, and maintain medium term bearishness. However, decisive break of 0.9243 will argue that the trend has already reversed and turn medium term outlook bullish for 1.0146.
Risk-On Sentiment Holds; Key US Inflation and Fed Announcements Loom
The forex markets are predominantly range-bound today as traders eagerly anticipate two pivotal events: US Consumer Price Index release and Federal Reserve's economic projections. These announcements have the potential to trigger significant market volatility, given their implications for future monetary policy. While Euro struggles amid ongoing political turmoil in France, other major currencies remain steady in anticipation of today's developments.
Currently, risk sentiment in the markets remains strong, evidenced by NASDAQ and S&P 500 reaching new record highs overnight. However, there is a palpable sense of caution as traders consider the possibility that a hawkish stance from Fed could maintain higher interest rates for an extended period, potentially dampening the current optimism.
As of now, New Zealand Dollar leads as the strongest currency of the week, followed by Australian Dollar and British Pound. Euro remains the weakest due to political instability in France and broader concerns within the EU. Japanese Yen and Swiss Franc are also underperforming, indicating a prevailing risk-on mood among investors. Dollar and Canadian Dollar are in a neutral position as the market awaits further cues.
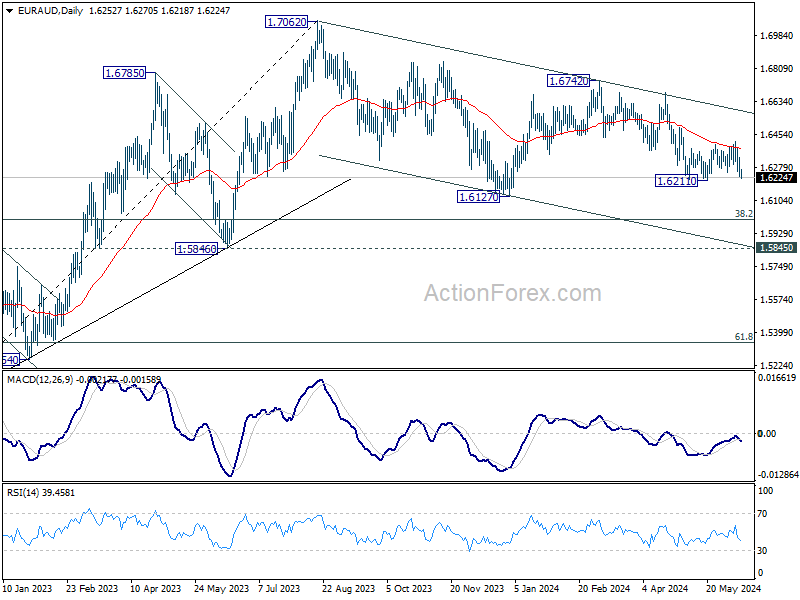
Technically, EUR/AUD is worth a note today as it's falling back towards 1.6211 support. Decisive break there would confirm resumption of the decline from 1.6742, which is seen as the third leg of the corrective pattern from 1.7062. In this case, deeper fall should then be seen to 1.6127 support and below. The downward movement could be catalyzed by escalating risk-on sentiment in the markets or worsening political conditions in the European Union.
In Asia, at the time of writing, Nikkei is down -0.57%. Hong Kong HSI is down -1.27%. China Shanghai SSE is up 0.15%. Singapore Strait Times is up 0.11%. Japan 10-year JGB yield is down -0.0292 at 0.987. Overnight, DOW fell -0.31%. S&P 500 rose 0.27%. NASDAQ rose 0.88%. 10-year yield fell -0.065 to 4.404.
US CPI and Fed awaited, NASDAQ surges to new record
Global financial markets are on high alert today as they await two critical announcements from the US, including the release of May's CPI and FOMC rate decision accompanied by new economic projections. These events are expected to play a crucial role in shaping market sentiment and monetary policy outlooks.
Analysts expect headline CPI to remain steady at 3.4% yoy, while core CPI, which strips out volatile food and energy prices, is anticipated to dip further from 3.6% yoy to 3.5% yoy. On a month-over-month basis, headline CPI is projected to rise by 0.2% mom, and core CPI by 0.3% mom.
Regarding Fed's upcoming decision, the consensus is that interest rates will be held steady at 5.25-5.50%. However, the focus will be on the updated dot plot, which reflects the rate expectations of Fed policymakers. Key questions include how many policymakers now foresee fewer than two rate cuts this year and whether any still see the need for further hikes.
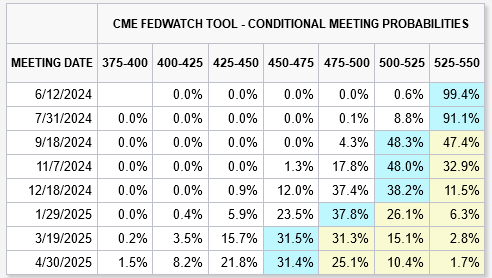
Current market sentiment suggests that Fed might only cut rates once this year, with an 88.5% probability of a cut by December. The chances of a rate cut in September stand at 52.6%, while the likelihood of a cut in November is slightly higher at 67.1%. These expectations will be closely scrutinized against the backdrop of today's announcements.
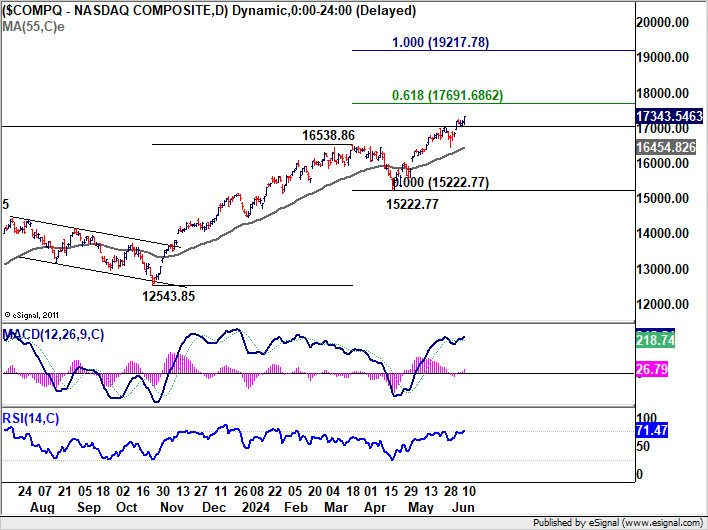
Ahead of theses key events, NASDAQ is looking unstoppable as it surged to fresch all-time highs. S&P 500 also closed at record but its gain was dwarfed by the tech index, while DOW lagged further behind with a loss.
Technically, further rise is expected in NASDAQ as long as 17343.54 support holds. Next target is 61.8% projection of 12543.85 to 16538.86 from 1522.77 at 17691.68. Firm break there could prompt upside acceleration to 100% projection at 19217.78. On the downside, break of 17343.54 will bring consolidations first before staging another rally.
World Bank raises 2024 global growth forecast but warns of persistent slowdown
In the Global Economic Prospects, the World Bank raised its global growth forecast for 2024 by 0.2% to 2.6%, which matches the pace of 2023. Growth is expected to rise slightly to 2.7% in both 2025 and 2026, but still well below the pre-pandemic average of 3.1%.
"In a sense, we see the runway for a soft landing," said World Bank Deputy Chief Economist Ayhan Kose. "That's the good news. What is not good news is that we may be stuck in the slow lane."
The report includes an alternative scenario where persistent inflation in advanced economies keeps interest rates about 40 basis points higher than the baseline forecast, potentially cutting 2025 global growth to 2.4%.
For the US, the World Bank now predicts 2.5% growth in 2024, consistent with the 2023 rate and up from January's forecast of 1.6%. Growth is expected to slow to 1.8% in both 2025 and 2026.
In the Eurozone, growth is projected to accelerate to 0.7% in 2024, unchanged from previous forecasts, and then increase to 1.4% in 2025 before slightly dipping to 1.3% in 2026.
Japan's growth forecast for 2024 has been revised down to 0.7% from 0.9%, due to weak consumption and slowing exports, though growth is expected to improve to 1.0% in 2025 and 0.9% in 2026.
China's growth forecast for 2024 has been upgraded to 4.8% from 4.5%, driven by increased exports. However, growth is expected to decline to 4.1% in 2025 and 4.0% in 2026, due to weak investment, low consumer confidence, and a struggling property sector.
Japan's CGPI rises to 2.4% yoy, highest in nine months
Japan's corporate goods price index accelerated from 1.1% yoy to 2.4% yoy in May, surpassing expectations of 2.0% yoy increase. This marks the fastest annual rise in nine months. The Yen-based import goods price index also rose 6.9% yoy , up from a 6.6% yoy gain in April, indicating that the Yen's depreciation is driving up the cost of raw material imports.
In a related development, a draft government policy blueprint released today emphasizes Japan's commitment to using "all policy tools" to sustain wage hikes. These wage increases are deemed crucial for ending deflation and achieving consistent economic growth above 1%, despite the country's rapidly shrinking population.
China's CPI stagnates in May, PPI remains in negative territory
China's CPI rose 0.3% yoy in May, unchanged from the previous month's reading and falling short of the expected 0.4% yoy increase. Food prices declined by -2.0% yoy, while non-food prices saw a modest increase of 0.8% yoy. Prices of consumer goods remained flat, and service prices rose by 0.8% yoy .
On a monthly basis, CPI edged down by -0.1% mom, missing the expectation of no change. Food prices were stable, but non-food prices fell by -0.2% mom, consumer goods prices decreased by -0.1% mom, and service prices also fell by 0.1% mom.
PPI dropped by -1.4% yoy, an improvement from the previous month's -2.5% yoy decline and better than the expected -1.8% yoy fall. Despite this improvement, PPI has been negative for the 20th consecutive month, indicating ongoing deflationary pressures in the industrial sector.
Looking ahead
UK GDP is the main focus in European session. Later in the day, all eyes are on US CPI, FOMC rate decision and new economic projections.
USD/CHF Daily Outlook
Daily Pivots: (S1) 0.8955; (P) 0.8974; (R1) 0.8996; More….
USD/CHF failed to break through 0.8987 support turned resistance decisively despite breaching it. Intraday bias stays neutral first. On the upside, firm break of 0.8987 support turned resistance will argue that correction from 0.9223 has completed, after drawing support from 0.8883 fibonacci level. Intraday bias will be back on the upside for 0.9157/9223 resistance zone. Nevertheless, sustained break of 0.8883 fibonacci level will carry larger bearish implications and bring deeper decline.
In the bigger picture, price actions from 0.8332 medium term bottom are tentatively seen as developing into a corrective pattern to the down trend from 1.0146 (2022 high). Rejection by 0.9243 resistance, followed by sustained break of 38.2% retracement of 0.8332 to 0.9223 at 0.8883 will strengthen this case, and maintain medium term bearishness. However, decisive break of 0.9243 will argue that the trend has already reversed and turn medium term outlook bullish for 1.0146.
Economic Indicators Update
| GMT | Ccy | Events | Actual | Forecast | Previous | Revised |
|---|---|---|---|---|---|---|
| 23:50 | JPY | Money Supply M2+CD Y/Y May | 1.90% | 2.10% | 2.20% | |
| 01:30 | AUD | NAB Business Confidence May | -3 | 1 | ||
| 01:30 | AUD | NAB Business Conditions May | 6 | 7 | ||
| 06:00 | GBP | ILO Unemployment Rate (3M) Apr | 4.40% | 4.30% | 4.30% | |
| 06:00 | GBP | Average Earnings Including Bonus 3M/Y Apr | 5.90% | 5.70% | 5.70% | 5.90% |
| 06:00 | GBP | Average Earnings Excluding Bonus 3M/Y Apr | 6.00% | 6.00% | 6.00% | |
| 06:00 | GBP | Claimant Count Change May | 50.4K | 10.2K | 8.9K | 8.4K |
| 10:00 | USD | NFIB Business Optimism Index May | 90.5 | 89.8 | 89.7 | |
| 12:30 | CAD | Building Permits M/M Apr | 20.50% | 5.20% | -11.70% | -12.30% |
US CPI and FOMC Rate Decision – EUR/USD and USD/JPY Technical Analysis
This week, financial markets are focused on the FOMC interest rate decision, as well as key economic indicators such as CPI and PPI. The Fed’s decision comes on the heels of rate cuts by the ECB and BOC, with expectations of a hold on rates in June. Investors are also looking for signals from the Bank of Japan amidst the Yen’s historic lows. In this context, we analyze market expectations and recent price actions, particularly focusing on EUR/USD and USD/JPY, which has shown resilience with a decade-long uptrend.
FOMC Meeting and Key Economic Indicators: Awaiting the Fed’s Decision
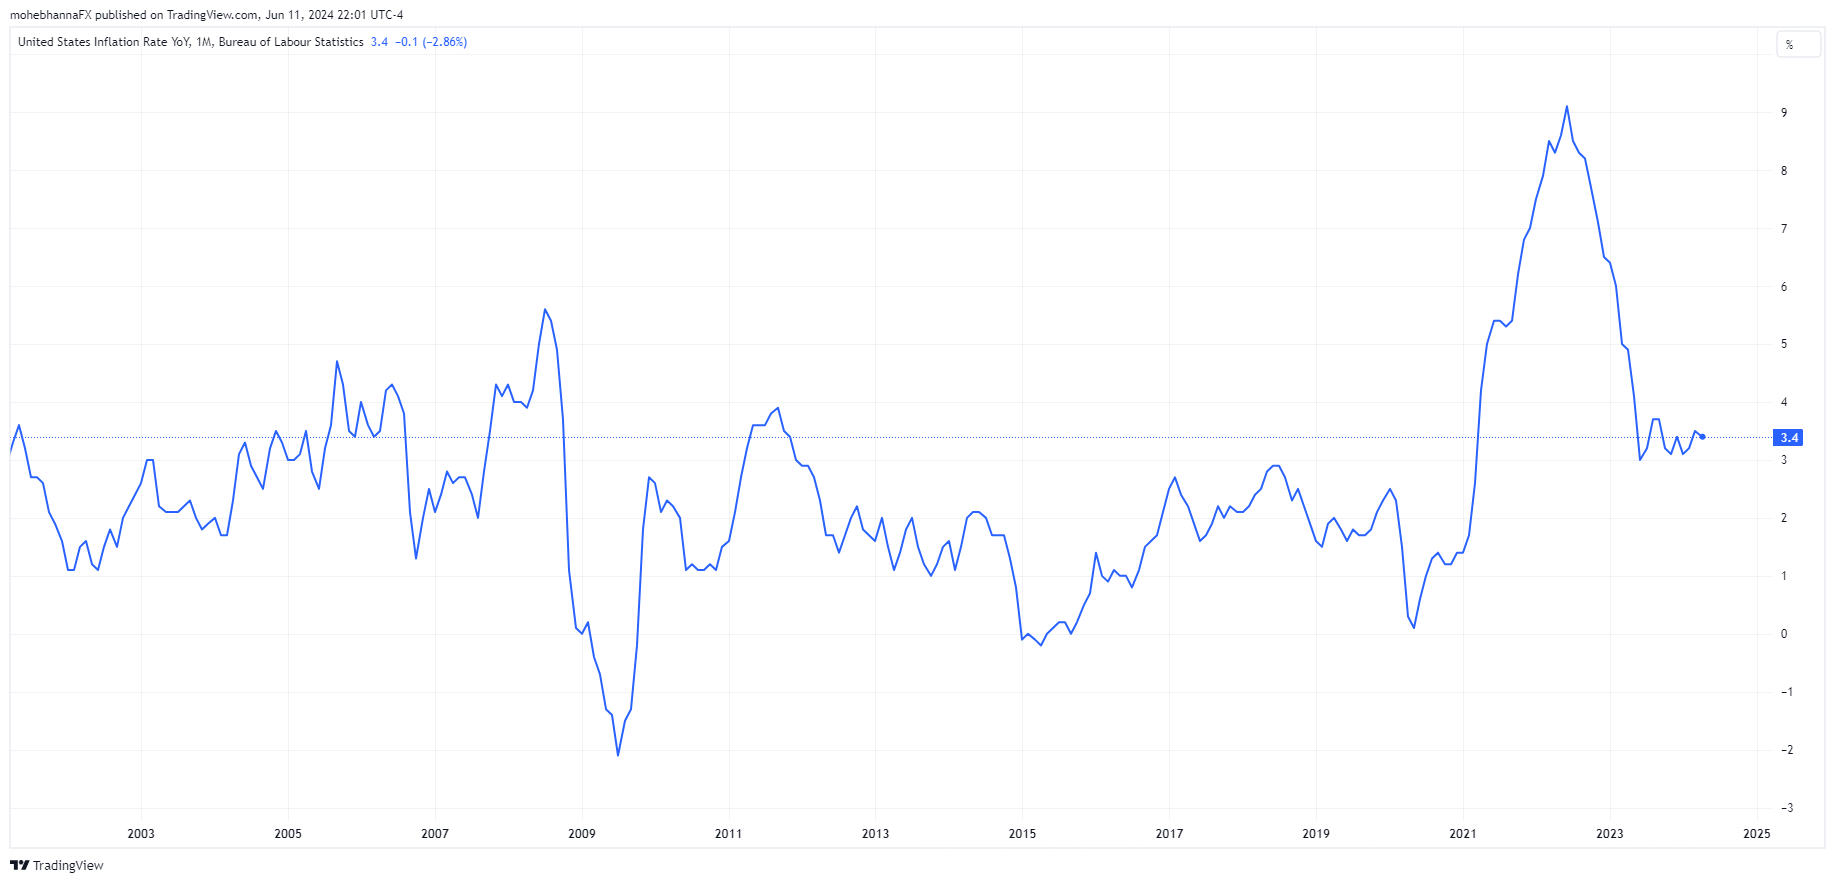
This week, the financial world is waiting with anticipation for the FOMC interest rate decision, statement, press conference, and the dot plot. This follows rate cuts by both the European Central Bank (ECB) and the Bank of Canada (BOC), each by 25 basis points, in response to declining inflation.
In the US, inflation has significantly decreased from its 2022 peak. However, recent CPI and PCE readings indicate persistent inflation in sectors like housing and services. Fed Chair Jerome Powell has emphasized that any future rate cuts hinge on sustained disinflation. Other Fed officials echo these concerns.
Bloomberg analyst surveys, media polls, and CME Group data suggest the Fed will maintain the current 525-550 interest rate in June. Traders now anticipate only two rate cuts in 2024, starting in September, a shift influenced by robust job numbers. Market participants are also keen to see updates in this quarter’s dot plot, particularly regarding the projected rate cuts for 2024.
The upcoming Consumer Price Index (CPI) report, expected to be released on the same day as the FOMC meeting, is also in the spotlight. Forecasts suggest CPI Y/Y will remain at 3.4%, with Core CPI Y/Y also holding steady at 3.6%. CPI M/M is projected to dip to 0.1% from 0.3%, likely due to falling oil prices. The services sector, a recent concern, has shown signs of stabilization within Core CPI. Additionally, a noted increase in medical services costs has brought prices back to their averages.The timing of the CPI report’s release during the FOMC meeting adds another layer of intrigue, as traders and the Fed navigate this uncommon scenario.
The PPI report is due this week, with expectations of a decline in both PPI M/M and Core PPI M/M. Similar to CPI, the services component of PPI has risen since January 2024, returning to pre-COVID levels.
Bank of Japan Expected to Hold Rates Amidst Yen’s Weakness
Meanwhile, later in the week, the Bank of Japan (BOJ) is expected to maintain its current interest rate of 0.10%. However, traders will be watching for any signs of quantitative tightening (QT), which could impact the market. The Japanese Yen, currently trading near a 34-year low, adds another element of uncertainty. Despite the interest rate differential between the US and Japan, carry trades on USDJPY remain attractive to some investors, albeit with inherent risks.
EUR/USD Technical Analysis – Daily Chart
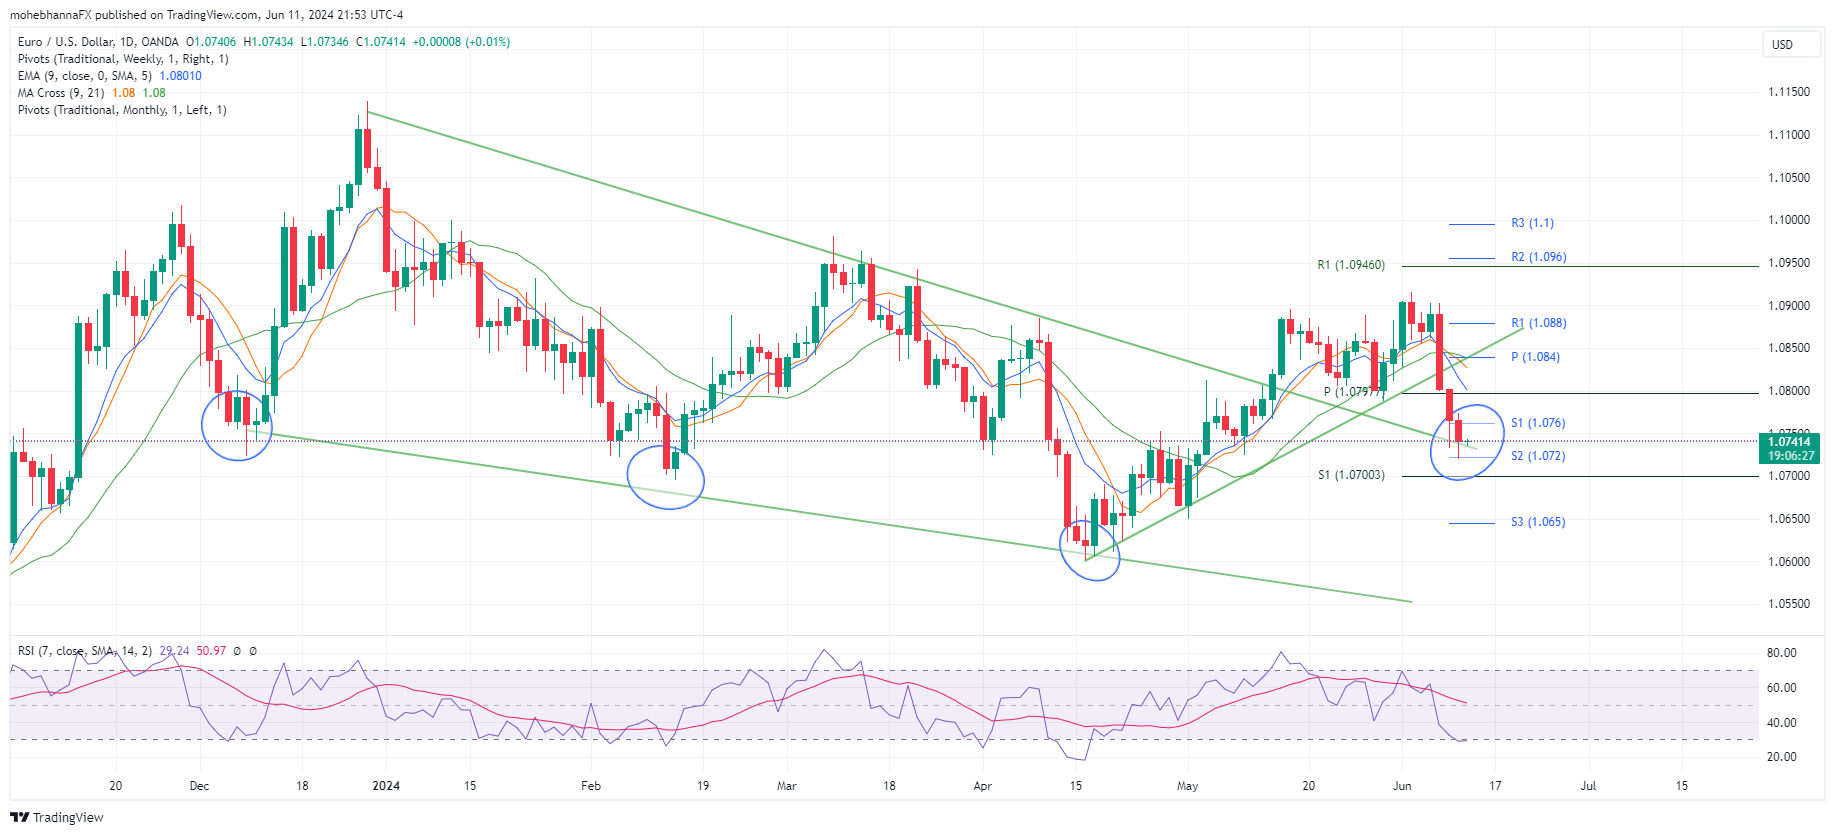
- Price action broke out and closed above the upper border of the narrowing formation identified on the above chart, two throwbacks took place as well as a shortfall as the price found support above a confluence of support, represented by monthly PP and Weekly support S1 near 1.0797.
- However, last week Non-Farm Payroll surprised the markets with higher-than-expected numbers, this caused price action to complete a third throwback which took price action back to the same border discussed on the above point.
- Price action broke and closed below three moving averages: EMA9, MA9, and MA21.
- Non-smoothed RSI7 aligns with price action and is currently at oversold territory.
- The potential double bottom formation (or triple bottom) discussed last time has materialized and still has potential as price found support above the resistance line connecting the three bottoms, if price action fails above this line and trades within the narrowing formation, the pattern may be invalidated.
- Weekly Chart update: Price action remains below the lower border of the previously discussed ascending channel; multiple pullback attempts have failed so far, and price continues to trade below the pattern.
- Monthly Chart update: Last month candle was a bullish engulfing candle after price rallied where it was met by resistance at its annual pivot point of 1.0920, taking price action down to 1.0760 where it found support above its intermediate MA21.
USD/JPY Technical Analysis – Daily Chart
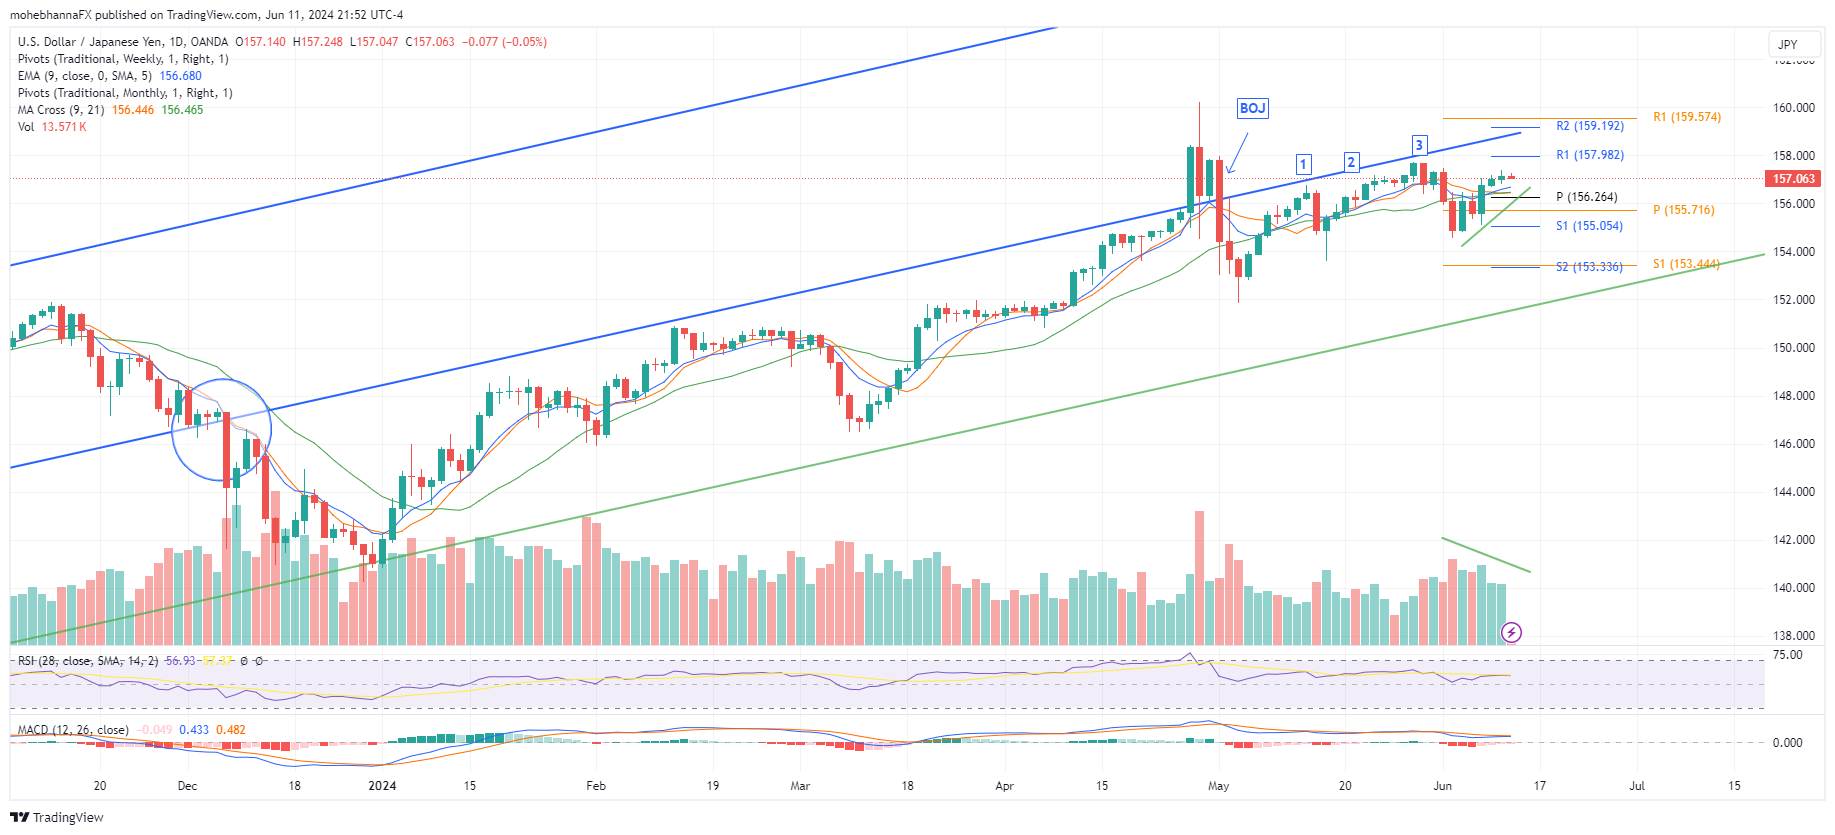
- The USD/JPY price has demonstrated remarkable resilience, maintaining an extended uptrend for over ten years. The latter part of the uptrend, influenced by the fundamental economies of the USA and Japan, is marked by the blue lines on the chart. Price action was trading within an ascending channel; it broke below the channel’s lower border during late 2023. However, it has been attempting to re-enter the channel since the breakout. (Unchanged from last week)
- Following the latest 2024 Bank of Japan meeting, price action was able to break above the channel’s lower border and reenter. However, the break was met by fierce resistance represented by a strong bearish engulfing candle, which closed below the lower border by the end of the trading day.
- Following the failed breakout, Price action has attempted three pullbacks, and was met by resistance for every attempt so far as indicated on the chart, on all occasions, price action has failed to enter the channel again, formed bearish engulfing candles and shortfalls as price action was met by resistance at its last week PP of 157.12.
- Price broke below a confluence of moving averages; however, it didn’t last long as price reversed back up and closed above the three averages as well as this week’s pivot point of 156.26, a break and a close below this level may invalidate the recent upside price move.
- Negative Divergence between the latest upside move and tick volume as price rose on a declining volume.
- Fast RSI7 still aligns with price action and has reversed from overbought territory.
Conclusion
In conclusion, market participants are keenly awaiting the FOMC’s interest rate decision and the release of key economic indicators, particularly CPI. The Fed’s decision, alongside potential policy shifts from the Bank of Japan, will significantly influence currency markets. Technical analysis of EUR/USD and USD/JPY suggests potential volatility and highlights key levels to watch. Traders should closely monitor these events and indicators for potential trading opportunities, while also considering the broader economic context and geopolitical risks.