
Sample Category Title
EUR/AUD Daily Outlook
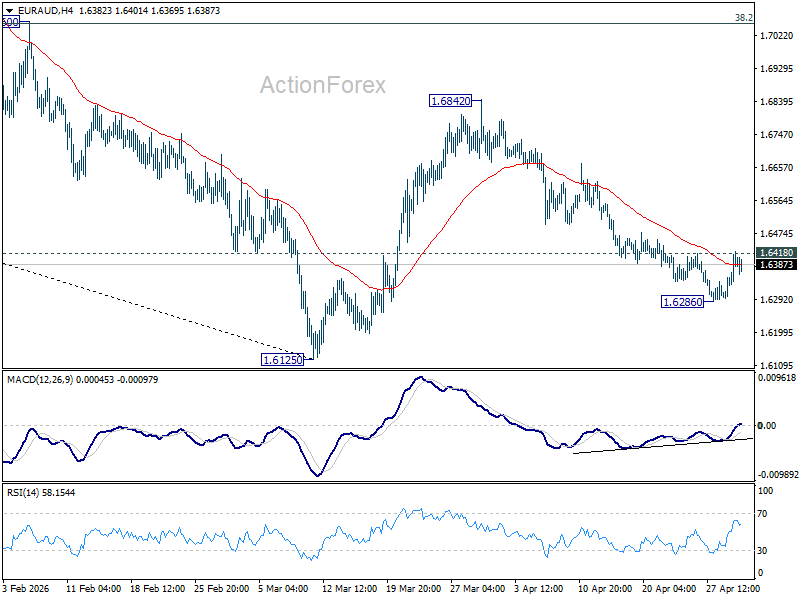
Daily Pivots: (S1) 1.6327; (P) 1.6377; (R1) 1.6456; More...
Intraday bias in EUR/AUD is turned neutral first with current recovery. On the downside, below 1.6286 will target 1.6126 low. Decisive break there will resume larger down trend from 1.8554. However, firm break of 1.6418 will indicate short term bottoming, and turn bias back to the upside for stronger rebound back towards 1.6842.
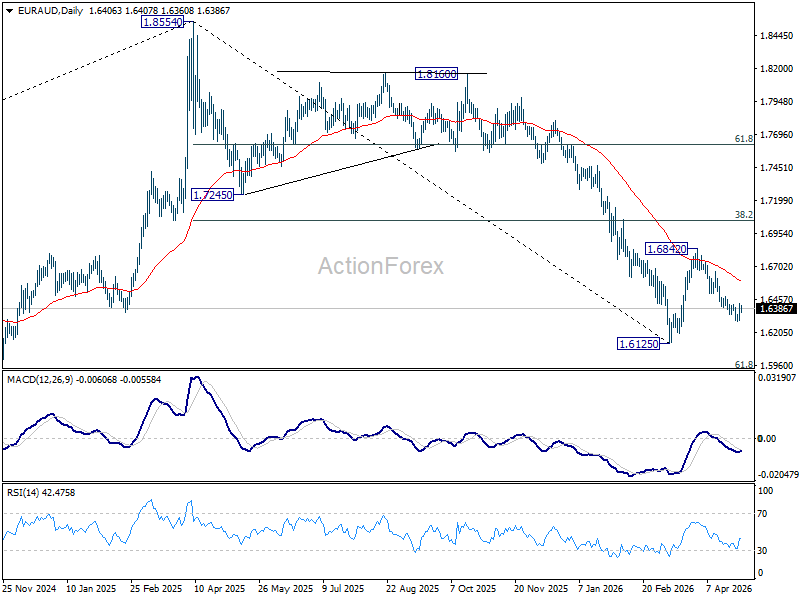
In the bigger picture, fall from 1.8554 (2025 high) is in progress and deeper decline should be seen to 61.8% retracement of 1.4281 to 1.8554 at 1.5913, which is slightly below 1.5963 structural support. Decisive break there will pave the way back to 1.4281 (2022 low). For now, risk will stay on the downside as long as 55 W EMA (now at 1.7129) holds, even in case of strong rebound.
EUR/CHF Daily Outlook
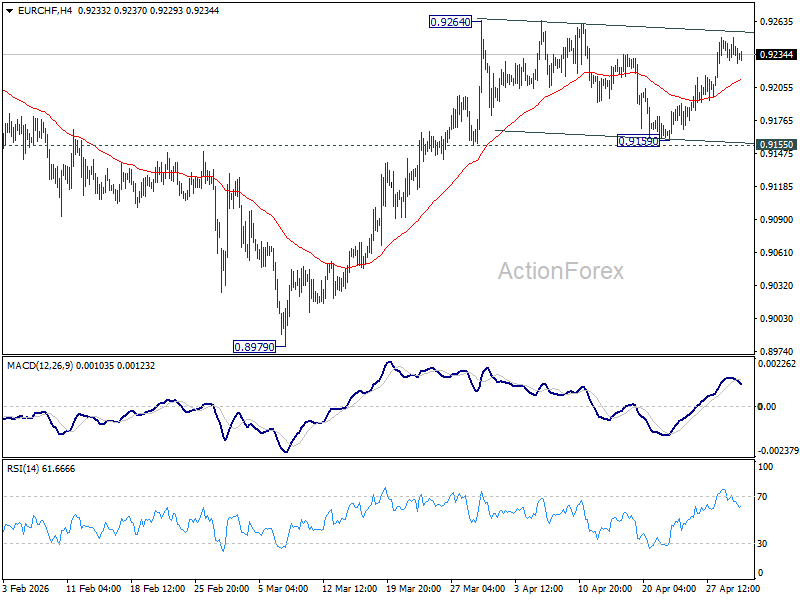
Daily Pivots: (S1) 0.9228; (P) 0.9243; (R1) 0.9256; More....
EUR/CHF is still bounded in established range below 0.9264 and intraday bias remains neutral. Further rise is expected with 0.9155 support intact. On the upside, firm break of 0.9264 will resume the rise from 0.8979 to 0.9394 resistance next. However, break of 0.9155 will turn bias back to the downside for deeper pullback.
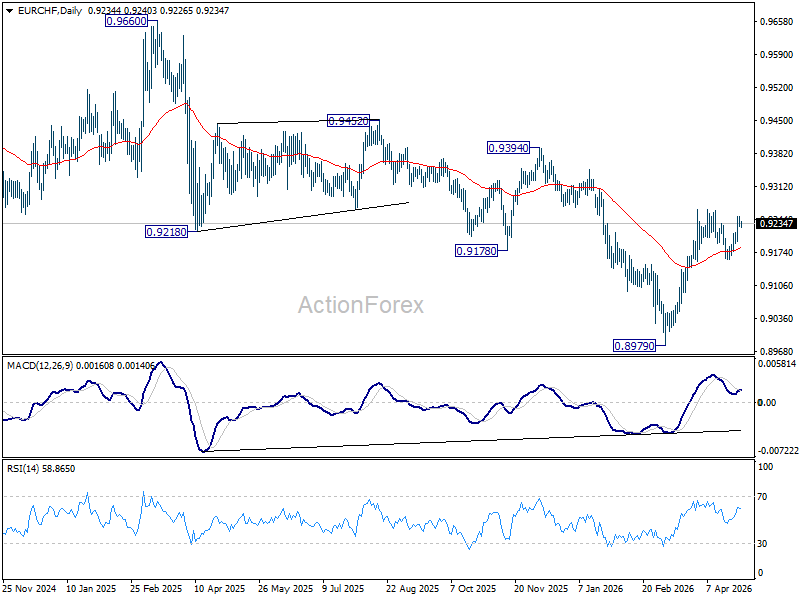
In the bigger picture, considering bullish convergence condition in W MACD, a medium term bottom should be in place at 0.8979. Sustained trading above 55 W EMA (now at 0.9277) will add more credence to this case. Further break of 0.9394 resistance will pave the way to 0.9660 resistance next. However rejection by the 55 W EMA will set up another fall through 0.8979 low at a later stage.
USD/CAD Daily Outlook
Daily Pivots: (S1) 1.3665; (P) 1.3688; (R1) 1.3709; More...
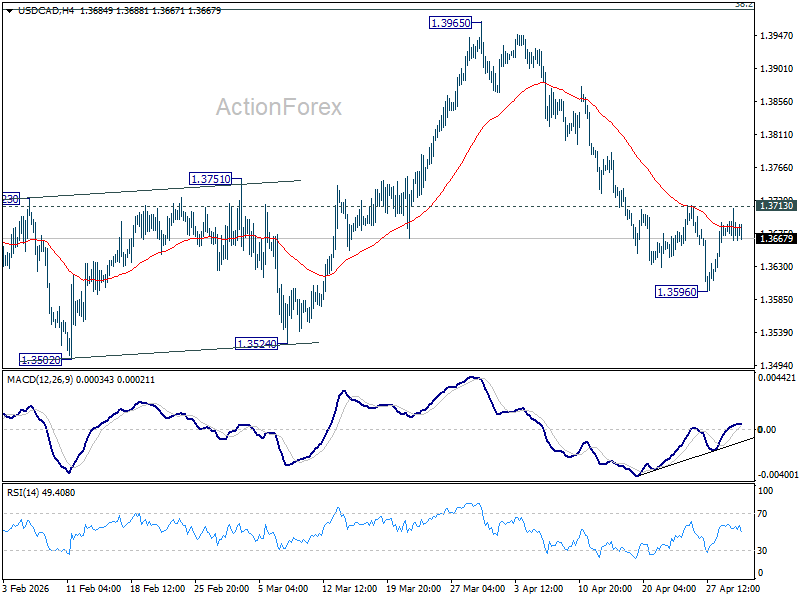
Intraday bias in USD/CAD remains neutral for more consolidations above 1.3596. Further decline is expected as long as 1.3713 resistance holds. Below 1.3596 will resume the decline from 1.3965 to retest 1.3480 low. Nevertheless, firm break of 1.3713 will turn bias to the upside for stronger rebound instead.
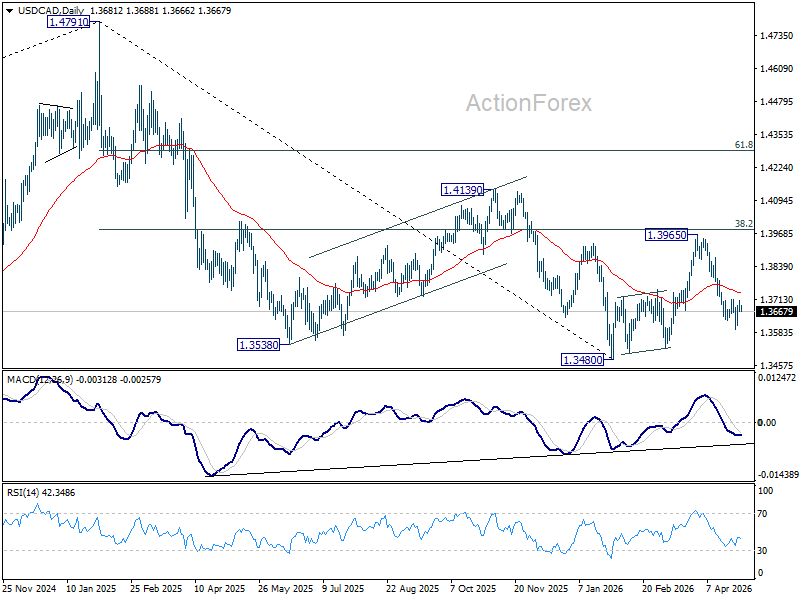
In the bigger picture, price actions from 1.4791 are seen as a corrective pattern to the whole up trend from 1.2005 (2021 low). Deeper fall could be seen, as the pattern extends, to 61.8% retracement of 1.2005 to 1.4791 at 1.3069. However, decisive break of 38.2% retracement of 1.4791 to 1.3480 at 1.3981 will argue that the correction has completed with three waves down to 1.3480 already. Further break of 1.4139 will confirm and bring retest of 1.4791 high.
AUD/USD Daily Report
Daily Pivots: (S1) 0.7082; (P) 0.7136; (R1) 0.7171; More...
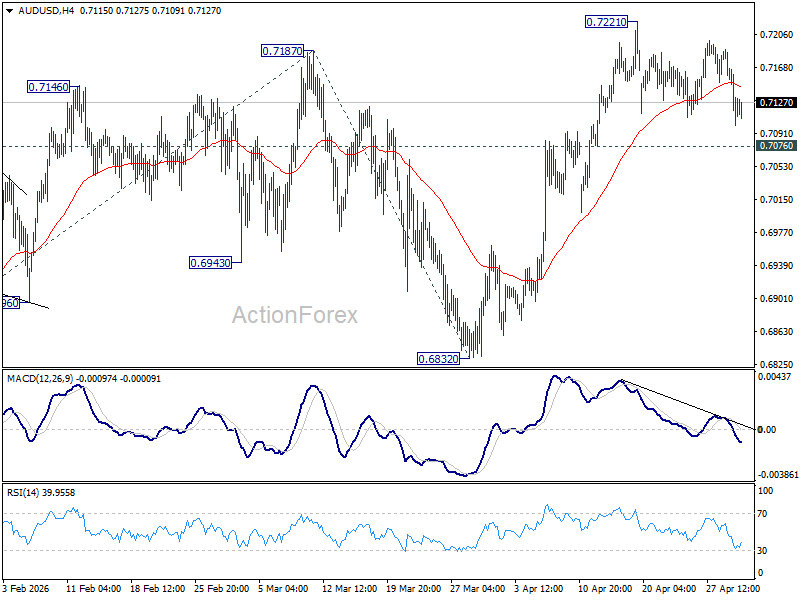
Intraday bias in AUD/USD stays neutral for the moment. Further rise is expected as long as 0.7076 support holds. On the upside, firm break of 0.7221 will extend larger up trend to 61.8% projection of 0.6420 to 0.7187 from 0.6832 at 0.7306. On the downside, break of 0.7076 minor support will turn bias back to the downside for deeper pullback.
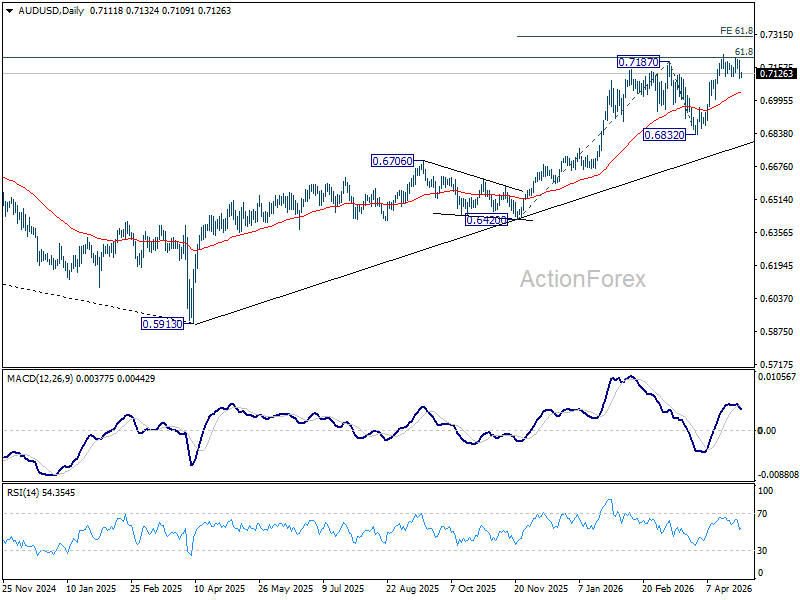
In the bigger picture, rise from 0.5913 (2024 low) is still in progress. Decisive break of 61.8% retracement of 0.8006 to 0.5913 at 0.7206 will solidify the case that it's already reversing the down trend from 0.8006 (2021 high). Further rally should then be seen to retest 0.8006. For now, outlook will remain bullish as long as 0.6832 support holds, in case of pullback.
EUR/USD Daily Outlook
Daily Pivots: (S1) 1.1650; (P) 1.1687; (R1) 1.1713; More….
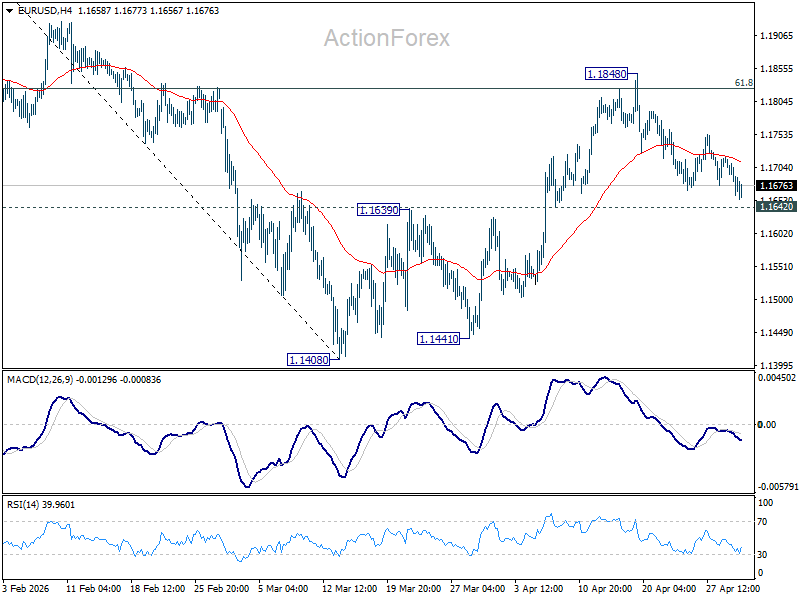
Intraday bias in EUR/USD stays neutral for the moment. On the upside, sustained trading above 61.8% retracement of 1.2081 to 1.1408 at 1.1824 will pave the way to retest 1.2081 high. However, firm break of 1.1642 support will indicate the the rebound from 1.1408 has completed, and bring deeper decline back towards this low instead.
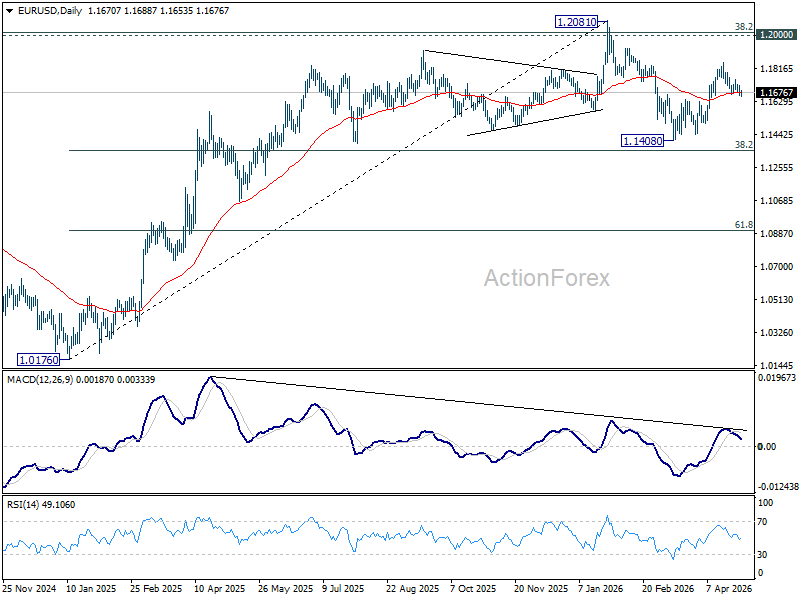
In the bigger picture, the strong support from 38.2% retracement of 1.0176 to 1.2081 at 1.1353 suggests that the pullback from 1.2081 is more likely a corrective move. Strong support was also found in 55 W EMA (now at 1.1530). Focus is back on 1.2 key cluster resistance level. Decisive break there will carry long term bullish implications. Nevertheless, break of 1.1408 support will revive the case of medium term bearish trend reversal.
GBP/USD Daily Outlook
Daily Pivots: (S1) 1.3446; (P) 1.3487; (R1) 1.3517; More...
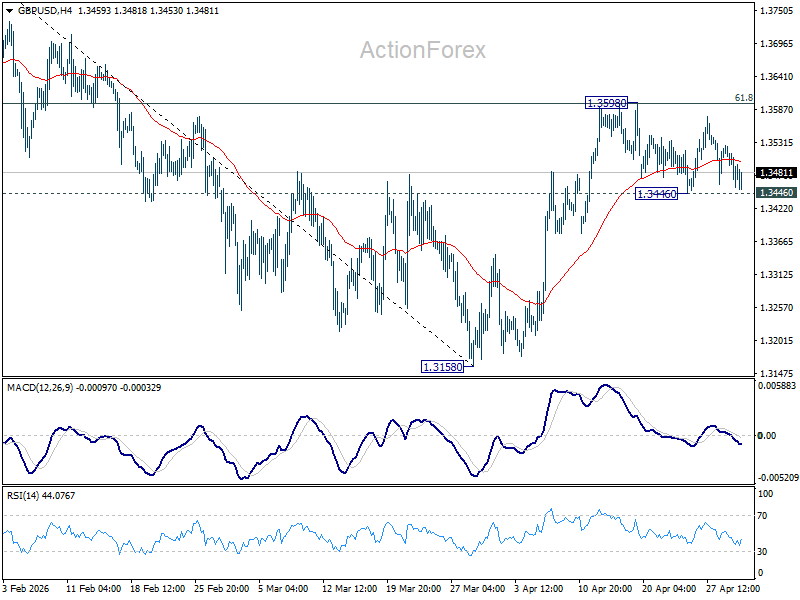
GBP/USD is still bounded in established range and intraday bias remains neutral. Further rise is still in favor with 1.3446 support intact. On the upside, firm break of 61.8% retracement of 1.3867 to 1.3158 at 1.3596 will pave the way to retest 1.3867 high. However, break of 1.3446 will turn bias back to the downside for deeper pullback.
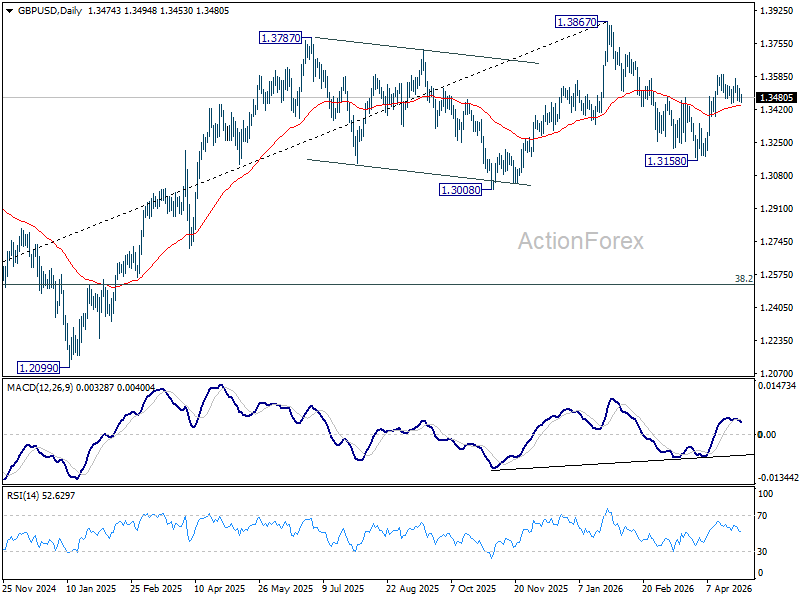
In the bigger picture, current development suggests that price actions from 1.3867 are merely a corrective pattern within the broader up trend from 1.0351 (2022 low). With 1.3008 support intact, medium term bullishness is maintained and break of 1.3867 is back in favor for a later stage, towards 1.4248 key resistance (2021 high).
USD/CHF Daily Outlook
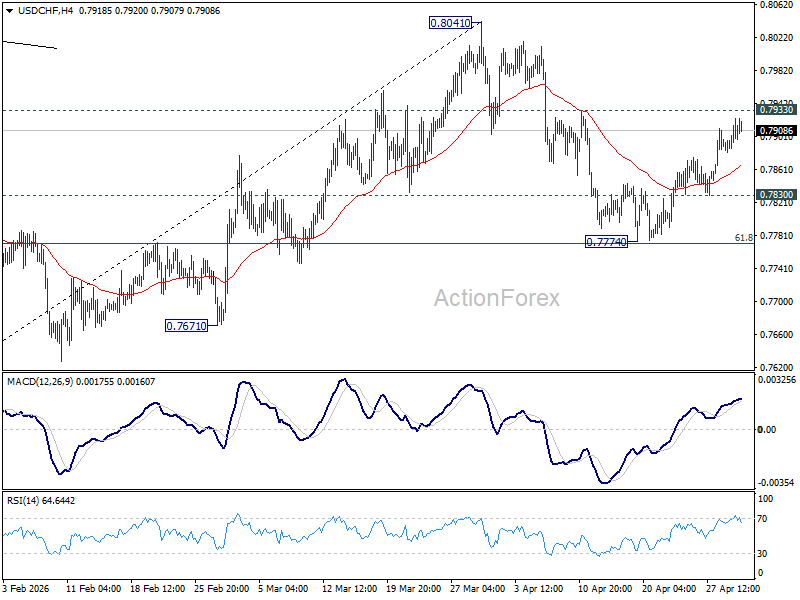
Daily Pivots: (S1) 0.7891; (P) 0.7908; (R1) 0.7933; More….
Intraday bias in USD/CHF remains neutral at this point. On the downside, below 0.7830 will turn bias to the downside for 0.7774 support. Sustained break of 61.8% retracement of 0.7603 to 0.8041 at 0.7770 will pave the way to retest 0.7603 low. However, decisive break of 0.7933 will argue that fall from 0.8041 has completed as a corrective move. Further rise should then be seen through 0.8041 to resume the whole rebound from 0.7603.
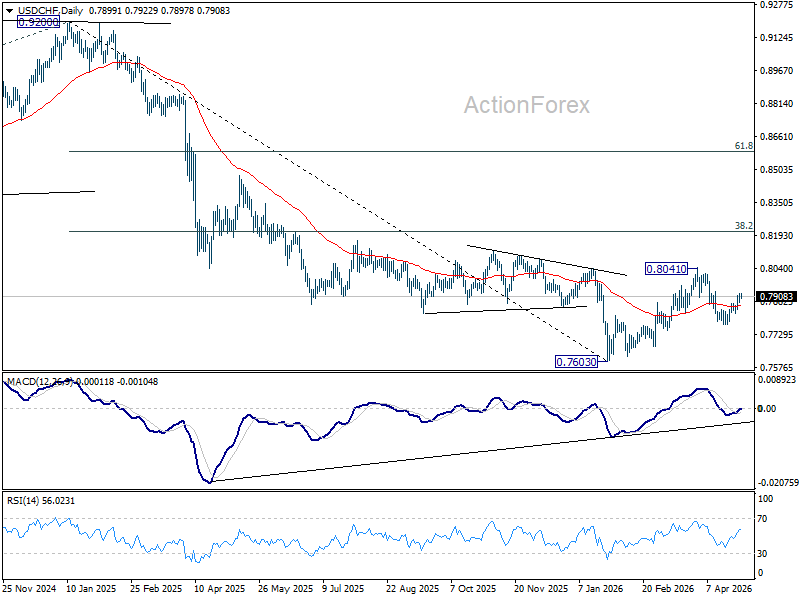
In the bigger picture, rebound from 0.7603 medium term bottom is seen as correcting the fall from 0.9200 only. Rejection by 55 W EMA (now at 0.8053) will affirm this bearish case, and setup down trend resumption to 100% projection of 1.0146 (2022 high) to 0.8332 from 0.9200 at 0.7382 at a later stage. Though, sustained break of 55 W EMA will suggest that it's probably correcting the larger scale down trend from 1.0146 (2022 high).
Fed on Hold, Brent Crude Climbs to USD 126/bbl
In focus today
We anticipate the ECB will keep the deposit rate steady at 2.00% today, consistent with consensus and market expectations. Attention will be centred on signals, as we expect Lagarde to maintain flexibility by keeping the option of summer hikes open to anchor inflation expectations, while refraining from committing to any specific action. We expect the ECB will raise policy rates by 25bp in both June and July. On the strategy side, we favour playing the move for lower short-end swap rates, highlighting the negative growth effects from the negative supply shock. For details, see ECB preview - No rush before summer hikes, 24 April.
In the UK, the Bank of England is widely expected to hold the bank rate at 3.75%, with market pricing indicating an 86% probability of no change. Read more in Bank of England Preview - On hold amid solid macro data, 24 April.
In the euro area, we expect the flash April HICP data to rise to 2.9% y/y from 2.6% y/y due to energy prices while core inflation is expected to decline to at 2.2 % y/y. Data from Germany and Spain released yesterday revealed no significant changes to the monthly momentum of core inflation, so we are still only seeing "first round" effects of the oil shock, which supports the ECB's "wait and see" approach today.
In the US, the main focus will be on Q1 flash GDP data. We forecast growth at +1.7% Q/Q AR, somewhat below consensus of 2.3%. March PCE inflation data will also be released at the same time.
We also get the flash Euro Area Q1 GDP data today. We forecast GDP rose 0.3% q/q in line with the ECB's baseline and adverse scenarios. Furthermore, we received the unemployment rate for March which we expect remained at 6.2% which should not be affected by the war in Iran.
In Norway, the labour market appears to remain tight, with relatively many vacancies and moderate but positive employment growth. Hence, we expect that the unemployment rate (SA) from NAV was unchanged at 2.1%. There is a risk that the small increase we saw in the number of unemployed in March was due to Easter being somewhat earlier than last year, in which case the unemployment rate could fall to 2.0%.
Economic and market news
What happened overnight
In China, the official manufacturing PMI dipped slightly to 50.3 in April (March: 50.4) but remained in expansion territory, driven by strong export orders as buyers stockpile amid Iran war concerns. Meanwhile, the private RatingDog Manufacturing PMI rose sharply to 52.2 (March: 50.8), reflecting robust external demand. However, rising energy prices and weak domestic consumption pose risks to sustained growth. The non-manufacturing PMI fell into contraction at 49.4, underscoring persistent fragility in services and construction sectors.
What happened yesterday
In the US, the Fed held rates steady at 3.50-3.75% as expected. Miran supported a quarter-point rate cut, while Kashkari, Hammack, and Logan opposed the inclusion of an easing bias in the statement. All three have been in the FOMC's hawkish camp for a while now, as they vocally opposed also the final rate cut last fall.
Powell announced he will remain as a Fed Governor past his term as the Chair but did not specify for how long. This is hawkish on the margin, as it blocks Trump from nominating a potentially more dovish replacement, and means that Miran will not continue as a Governor in June. Yields rose and the USD strengthened, as markets erased bets for further rate cuts, and instead price in a slim chance of rate hike in 2027. We still call for two more rate cuts in September and December, read more in Fed review: Not quite done yet, 29 April.
Separately, the Senate Banking Committee advanced Kevin Warsh's nomination to succeed Powell as Fed Chair. The Senate is expected to confirm Warsh in May.
Oil prices climbed further, with Brent crude reaching USD 126/bbl at the time of writing, toppling the recent USD 119.5/bbl high from 9 March. The increase follows reports that the US is considering military strikes to break the negotiation deadlock with Iran, intensifying concerns over prolonged supply disruptions. Market sentiment remains cautious, with Polymarket investors assigning less than a 30% probability of normalised traffic through the Strait of Hormuz by the end of May and a 45% likelihood of the US lifting its naval blockade.
In the euro area, the European Commission's April survey revealed a significant increase in selling price expectations across all business sectors, with industry seeing its largest-ever monthly rise. Expectations remain elevated above long-term averages, bolstering the case for further ECB rate hikes. However, the relatively subdued rise in services price expectations compared to 2022 offers some reassurance. Consumers also sharply revised up their inflation expectations, with April marking the highest level recorded since April 2022.
The EU Commission adopted a temporary state aid framework allowing governments to subsidise up to 70% of extra energy costs for impacted industries, agriculture, and transport. While the measures may limit short-term consumer price increases, they risk stimulating demand and adding to medium-term inflation pressures, supporting the case for further ECB rate hikes.
In Canada, the Bank of Canada (BoC) held its overnight target rate at 2.25%, aligning with expectations and prior guidance. The BoC avoided providing clear forward guidance, acknowledging upward pressure on inflation expectations while noting that higher energy prices have yet to significantly impact broader sectors of the economy.
In Sweden, preliminary GDP figures for Q1 showed a decline of 0.2% q/q, below expectations of +0.1% q/q growth, but with strong momentum in March (+1.9% m/m). Retail sales surged 3.1% m/m and 6.2% y/y in March, driven by broad-based gains, particularly in durable goods, while February's figures were revised lower to -0.8% m/m and 2.2% y/y. In the NIER survey for April, overall business sentiment dropped slightly to 99.0 (prior: 99.9) and inflation expectations among firms rose sharply to 2.6%, while consumer confidence weakened to 91.5 from 95.2.
Equities: Equities fell yesterday, but the decline was marginal on balance, as US tech continued to hold up relatively well. In other words, tech is still providing the floor under the market.
Some of what we saw yesterday is likely to be repeated today. Investors need to keep their heads clear, as markets are currently being hit by several powerful forces at the same time: Iran and an oil price heading sharply higher, macro data surprising in very different directions depending on where you look, a large round of central bank meetings yesterday and again today, and a heavy earnings calendar across both sessions. In other words, it is difficult to separate the signal from the noise. But one thing is becoming increasingly clear: the US is performing much better both from a macro and micro perspective than other regions. Tech, tech investment and therefore broader corporate investment, much more than private consumption, are the areas standing out positively right now. That is also visible in the rotations we are seeing, both across sectors and across styles.
Overall, the Iran situation and the oil price are still conducting the orchestra, as we can also see this morning. But from an equity market perspective, earnings are strong enough to act as a partial counterweight to the negative geopolitical impulse. Put differently, with oil at new highs in the Iran conflict and equities still close to all-time highs, one can only speculate where equities would have been without the negative impact from Iran, Hormuz, the Persian Gulf and oil.
This morning, the focus is mostly on Iran and higher oil prices, leaving most of Asia in red. European futures are materially lower, and the same is true in the US. However, the tech-growth segment is still holding up best in futures.
FI and FX: An unchanged policy rate from the FOMC combined with a hawkish tilt pushed EUR/USD below 1.17 and shifted market expectations from a slight cutting bias to a slight hiking bias in 2026. The announcement from Powell to continue as a Governor was a contributing factor to the hawkish repricing as it means that biggest dove Miran will have to leave as a Governor in June. Oil prices climbed to a new high since the start of the US-Iran war with the June Brent contract reaching USD 124 as Trump shows no willingness to open his naval blockade without a nuclear deal. Aside from geopolitical developments in the Middle East today's focus will be on the ECB meeting where the communication will be key as no changes to the key interest rates are expected. After preliminary inflation numbers from Germany (below expectations) and Spain (above expectations) we expect the preliminary euro area numbers for HICP to print at 2.8% y/y.
USD/JPY Daily Outlook
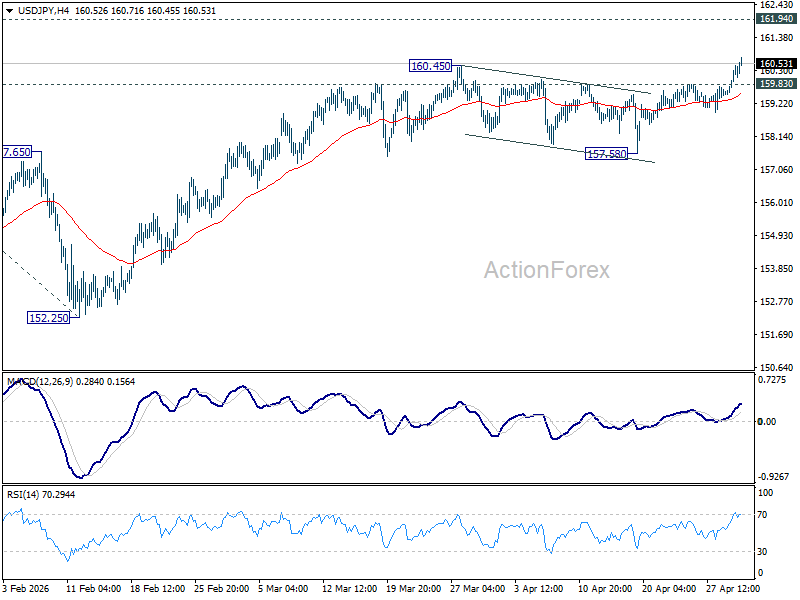
Daily Pivots: (S1) 159.79; (P) 160.14; (R1) 160.79; More...
USD/JPY's break of 160.45 resistance confirms resumption of rally from 152.25. Intraday bias is on the upside for retesting 161.94 high. Decisive break there will target 61.8% projection of 139.87 to 159.44 from 152.25 at 164.34 next. On the downside, below 159.83 minor support will turn intraday bias neutral first. But downside of retreat should be contained well above 157.58 support to bring another rally.
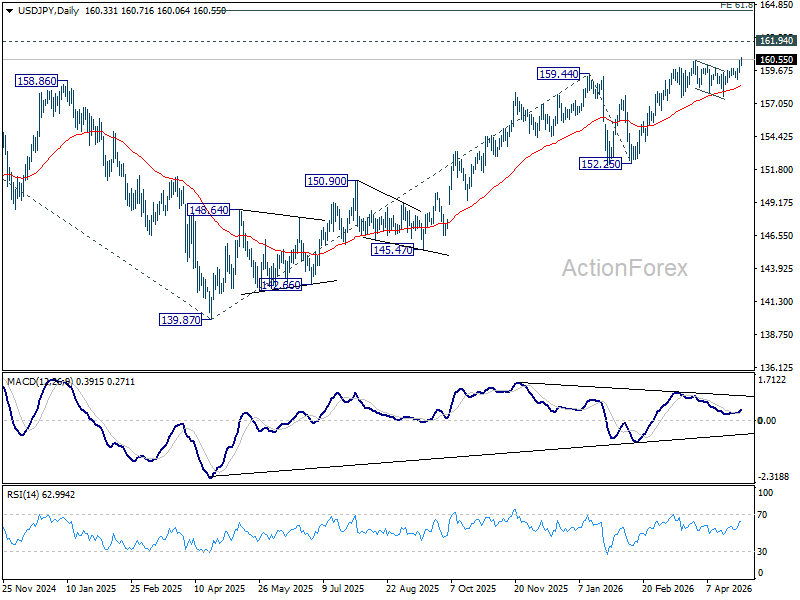
In the bigger picture, outlook is unchanged that corrective pattern from 161.94 (2024 high) should have completed with three waves at 139.87. Larger up trend from 102.58 (2021 low) could be ready to resume through 161.94. This will remain the favored case as long as 55 W EMA (now at 153.81) holds. Firm break of 161.94 will pave the way to 61.8% projection of 102.58 to 161.94 from 139.87 at 176.75.
Oil Surge Above $120 Drives Markets as BoE, ECB and Key Data Take Back Seat
Today’s calendar is packed with major data releases including GDP and inflation from Eurozone and the US, ECB and BoE rate decision, and escalating geopolitical risks all converging. But markets are not struggling to find direction. Oil is doing that job. Brent crude has surged above the key $120 psychological level, hitting a four-year high, forcing markets to reprice inflation, policy expectations, and currencies simultaneously.
The trigger is a clear escalation in rhetoric and positioning. Reports that U.S. Central Command will brief President Donald Trump on potential military action against Iran have rattled markets. Additionally, the messaging from Washington has turned more aggressive. Trump’s public statements, including a stark “No More Mr. Nice Guy” stance, are being interpreted by markets as a shift from “maximum pressure” to “active deterrence.” This raises the risk that current tensions could evolve into a more direct confrontation.
Traders are now moving away from a “resolution” mindset and toward a “prolonged standoff” scenario, with risk of re-escalation in conflicts. The break above $120 is more than a technical move. It signals that markets are beginning to price in further prolonged supply disruption. If tensions escalate further, this level could quickly become the new baseline rather than the peak.
This oil surge is feeding directly into inflation expectations and, by extension, central bank policy outlooks. That is particularly relevant today as both the Bank of England and the European Central Bank are set to announce rate decisions.
For the Bank of England, a hold at 3.75% remains the overwhelming consensus. However, the focus will be on the vote split and forward guidance. After a unanimous hold in March, there is now a possibility of hawkish dissent in favor of a rate hike, especially as policymakers assess the risk of second-round effects from rising energy prices on wages and services inflation.
Governor Andrew Bailey’s commentary will be closely watched, particularly for any indication that the BoE sees the oil shock as more persistent. If policymakers signal concern about inflation becoming embedded, market expectations for further tightening could firm quickly.
At the European Central Bank, a hold at the 2.00% deposit rate is also almost certain. However, the meeting carries significant forward guidance risk. Markets are currently pricing in two 25bps hikes for the remainder of 2026, with June seen as the “live” meeting for the first move.
The key question is whether President Christine Lagarde will signal that timeline more explicitly. Any hint toward a June hike would effectively validate market pricing and could push European yields higher, reinforcing the broader tightening narrative.
At the same time, a heavy data calendar looms. U.S. GDP and PCE inflation, alongside Eurozone GDP and CPI, would normally drive markets. But today, their role is secondary. Instead, they will be filtered through the oil narrative. Strong inflation data will reinforce the current trajectory, while weaker growth may be overlooked unless it becomes severe enough to challenge the tightening bias.
In currency markets, Dollar is the strongest performer so far this week, supported by safe-haven demand and a subtle shift in Fed expectations following the latest decision. With three policymakers opposing even an easing bias, markets are now pricing less than a 5% chance of a rate cut by year-end.
Canadian Dollar is the second strongest, benefiting from the surge in oil prices. Australian Dollar also remains firm, as higher energy costs reinforce expectations that the RBA will proceed with a rate hike in May and more thereafter.
At the other end of the spectrum, Swiss Franc is the weakest performer. The widening interest rate gap is weighing heavily, as other central banks lean toward tightening while the SNB is expected to remain on hold.
Yen remains under pressure despite the risk environment. USD/JPY has surged beyond the 160 intervention red line, but Japanese authorities are unlikely to act decisively in the current volatile environment. Instead, the currency is continuing to reflect the impact of higher global yields and energy costs.
With so many moving parts, markets are navigating a complex maze. But the hierarchy is clear—oil and geopolitics are setting the direction, while central banks and data are being forced to react.
In Asia, at the time of writing, Nikkei is down -1.32%. Hong Kong HSI is down -1.20%. China Shanghai SSE is up 0.16%. Singapore Strait Times is up 0.61%. Japan 10-year JGB yield is up 0.058 at 2.523. Overnight, DOW fell -0.57%. S&P 500 fell -0.04%. NASDAQ rose 0.04%. 10-year yield rose 0.06 to 4.42.
Gold Hit by Double Whammy, Heading Back Toward 4,000
Oil and yields are squeezing Gold from both sides. With downside momentum building, the 4,000 level is coming back into view. Read More.
Japan Industrial Output Falls -0.5% as Petrochemical Weakness Dominates
Japan’s factory output is slipping as energy-linked sectors are hit by supply disruptions, even as retail sales rebound and consumption holds up. Read More.
NZ ANZ Business Confidence Slumps to -10.6, Inflation Expectations Highest Since Feb 2024
Cost pressures are surging in New Zealand, driving inflation expectations higher and pushing business confidence back into negative territory. Read More.
China PMI Signals Modest Growth as Services Slip and Cost Pressures Build
China’s PMI data shows resilient output but growing divergence and rising inflation pressures within the economy. Read More.
USD/JPY Daily Outlook
Daily Pivots: (S1) 159.79; (P) 160.14; (R1) 160.79; More...
USD/JPY's break of 160.45 resistance confirms resumption of rally from 152.25. Intraday bias is on the upside for retesting 161.94 high. Decisive break there will target 61.8% projection of 139.87 to 159.44 from 152.25 at 164.34 next. On the downside, below 159.83 minor support will turn intraday bias neutral first. But downside of retreat should be contained well above 157.58 support to bring another rally.
In the bigger picture, outlook is unchanged that corrective pattern from 161.94 (2024 high) should have completed with three waves at 139.87. Larger up trend from 102.58 (2021 low) could be ready to resume through 161.94. This will remain the favored case as long as 55 W EMA (now at 153.81) holds. Firm break of 161.94 will pave the way to 61.8% projection of 102.58 to 161.94 from 139.87 at 176.75.