Sample Category Title
Sunset Market Commentary
Markets
The ECB received some last-minute input at the very moment policymakers were discussing the monetary course. Q1 GDP numbers showed the Euro area economy unexpectedly slowing to a 0.1% quarterly growth pace (0.8% y/y). Details are not available yet but its arguably not an ideal situation, particularly since Q1 only captures one month of the Iranian conflict and the ensuing energy price surge. The latter resulted in higher CPI with the April number, also on tap today, accelerating from 2.5% to 3% - the fastest pace since mid-2023. Energy prices soared from 5.1% to 10.9% (y/y) with monthly dynamics, although slowing from an eyepopping 7% in March, coming in at 3%. With oil prices (June contract) today temporarily hitting a post-war high of as much as $126 we could see further pressure in the month(s) ahead. Non-energy industrial goods inflation quickened too, from 0.5% to 0.8% to hit the highest in two years. Services inflation eased from 3.2% to 3%, allowing for a minor fall in core inflation to 2.2%. Accelerating actual headline inflation is to be combined with the April PMIs and a slew of other soft data that pointed at sharply intensifying price pressures going forward, and puts the ECB in a tough spot.
Frankfurt kept the policy rate unchanged at 2%. The status quo was unanimous but was discussed alongside the option of a rate hike, both at length and in depth. This suggests that there is appetite for such a move, though not enough (yet). The statement noted that incoming data has been broadly consistent with the outlook. However, upside inflation and downside growth risks have intensified. Going into the conflict, inflation was around 2% and the economy resilient. The ECB states that it is well positioned to navigate through this shock, of which the impact for the medium-term inflation outlook and economy depends on the intensity and duration and the scale of its indirect and second-round effects. The statement offered little clues for policy going forward hike and neither would Lagarde confirm (nor reject, though) market pricing for a June hike. She instead referred to the three-pronged reaction function specified at the ECB and its Watchers Conference. In terms of where the ECB is according to the three scenarios outlined in March, Lagarde only wanted to note that they are “certainly moving away” from the baseline without saying if that’s closer to the base or the adverse case. We’ll have to wait until June for that. Asked why the ECB is not acting to its baseline scenario, which embedded two rate hikes and sees inflation just barely easing back to 2%, Lagarde said that they are in a position to wait it out before acting immediately because they are not seeing second round effects so far. In addition, anticipative market positioning is doing some of the tightening work already. But at least Lagarde thinks she “knows which direction they are headed at”. The market reaction was an extremely muted one. A sudden intraday drop in oil prices in fact triggered the biggest (and only) move of the day, dragging European yields up to 10 bps lower at the front. EUR/USD is trading little changed around 1.17. The US dumped a batch of eco data in between the ECB announcement and press conference but triggered additional volatility. Q1 growth fell slightly short of expectations with 2% Q/Q annualized. Imports was a major drag though, subtracting 2.62% ppts, while all other major categories contributed: personal consumption added 1.08 ppts, investments 1.48 ppts and exports 1.32%. Quarterly PCE data surprised to the downside on a headline level (3.6% vs 3.9% and from 3.7%) but to the upside when looking at the core (4.3% vs 4.1% and from 2.7%), the latter being the fastest since Q1 2023.
The Bank of England today left its policy rate unchanged at 3.75% in 8-1 vote. Huw Pill preferred to raise the rate to 4%. Governor Bailey labeled the decision as an ‘active hold’. In its quarterly report the BoE replaced central forecasts by three scenarios with different paths for energy prices and potential second round effects. Even as the BoE sees inflation above current 3.3% for the remainder of this year, the MPC made a balanced assessment. There is a material risk of second round-effects which policy needs to lean against via higher interest rates. But at the same time, the bank also elaborated on a further loosening of labour market conditions, a weakening of the economy and a tightening of financial conditions since the start of the conflict. The BoE in this respect finds itself in a difficult position where it has to balance the cost of doing too much vs too little. The balanced approach (and an intraday decline in the oil price) caused markets to scale back expectations for a June BoE rate hike to about 65% from 80% yesterday evening. Gilt yields ease between 10 bps (2-y) and 5 bps (30-y). Sterling gains modestly (EUR/GBP 0.865).
Fragmentation Within OPEC+: UEA Exit Signals Structural Shift in Oil Market Dynamics
- The United Arab Emirates exit from OPEC+ highlights growing internal tensions and weakens the cartel’s ability to coordinate supply
- Short term market impact remains limited due to supply disruptions linked to the blockade of the Strait of Hormuz
- In the medium term, the UAE’s spare capacity may increase global supply once logistical constraints ease
- Recent price declines in Brent crude oil likely reflect profit taking after a strong rally driven by geopolitical risk
A smaller coalition from eight to seven producers
The global oil market is entering a phase of growing institutional uncertainty, as the ability of OPEC+ to coordinate supply continues to weaken. A clear manifestation of this trend is the decision by the United Arab Emirates to leave both OPEC and OPEC+, effective May 1, 2026. As a result, only seven countries, down from the original eight that agreed in April 2023 to implement additional production cuts, will participate in the upcoming policy meeting.
Underlying tensions quotas compliance and strategic divergence
The UAE’s departure is not a sudden development but the outcome of prolonged internal tensions. Disagreements have centered on production levels and, crucially, on compliance with agreed quotas. The UAE repeatedly exceeded its production limits, undermining the credibility of the group’s supply management framework. At the same time, the country has been expanding its production capacity, putting it at odds with the restriction focused strategy led by key players such as Saudi Arabia.
These economic frictions have been compounded by geopolitical considerations. Amid escalating regional conflict and instability in the Gulf, Abu Dhabi has grown increasingly dissatisfied with the level of political and strategic support received from its neighbors. This has accelerated the shift toward a more independent energy policy focused on maximizing national output and flexibility.
Limited short term impact amid supply disruptions
Despite the significance of the UAE’s exit, its immediate impact on the oil market is limited. Production across the Gulf region is already well below capacity due to the blockade of the Strait of Hormuz, one of the most critical transit routes for global oil flows. In this context, physical export constraints outweigh formal production quotas, rendering OPEC+ decisions largely symbolic in the short term.
Although new quotas are likely to be announced at the routine meeting, their practical relevance remains minimal. The cartel continues to operate within a formal framework, but its ability to effectively control supply has been significantly diminished.
Medium term risks unconstrained capacity and market rebalancing
The implications of the UAE’s exit become more meaningful in a scenario where logistical constraints ease and export routes normalize. The UAE possesses substantial spare production capacity, estimated at around 700,000 - 800,000 barrels per day, which it can deploy without being bound by OPEC+ agreements. This creates the potential for a faster supply response and a shift in market balance once normal conditions resume.
Long term outlook rising competition and price volatility
Over the longer term, the erosion of quota discipline and the increasing number of producers operating outside coordinated frameworks could lead to a more competitive supply environment. This raises the likelihood of heightened price volatility and, in extreme scenarios, the risk of a price war among major oil exporters.
While the UAE’s withdrawal does not immediately alter global supply dynamics, it represents a significant structural development. It highlights the weakening cohesion within OPEC+ and signals a gradual transition from coordinated market management toward a more fragmented and competitive oil landscape.
Technical view on the oil market
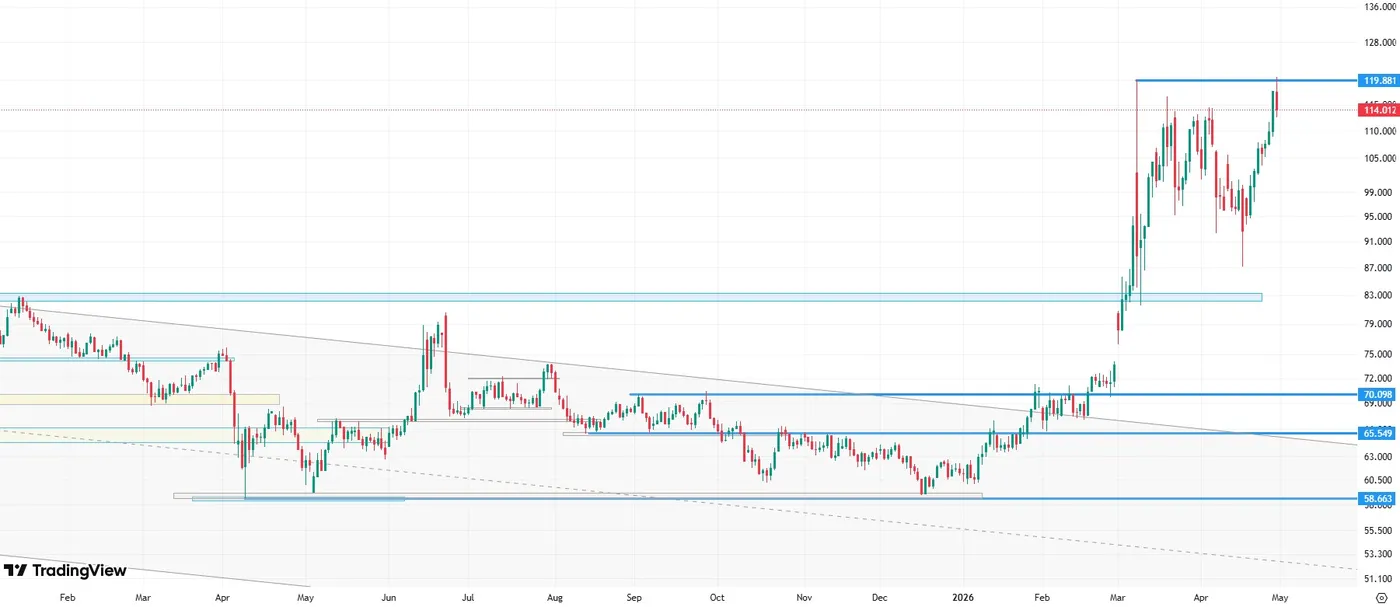
Brent crude oil price (CFD), daily data, source: TradingView
Oil prices are declining today, which may be driven by news regarding the decision of the United Arab Emirates to leave OPEC+. The market appears to be reacting to the potential for increased supply in the medium term, as well as weakening cohesion within the cartel, both of which are putting short term downward pressure on prices. Currently, Brent crude oil is trading around 114 USD per barrel, while West Texas Intermediate stands near 106.5 USD.
At the same time, Brent crude oil prices have matched and even exceeded the highs seen at the beginning of the Middle East tensions. This could indicate that the market has entered a phase of profit taking, particularly among short term investors who entered positions during the recent upward momentum driven by geopolitical risk.
As a result, the current pullback does not necessarily signal a reversal of the broader trend, but rather a natural correction following a strong rally and a retest of previous highs.
U.S. Economy Expands by a Healthy 2% in Q1
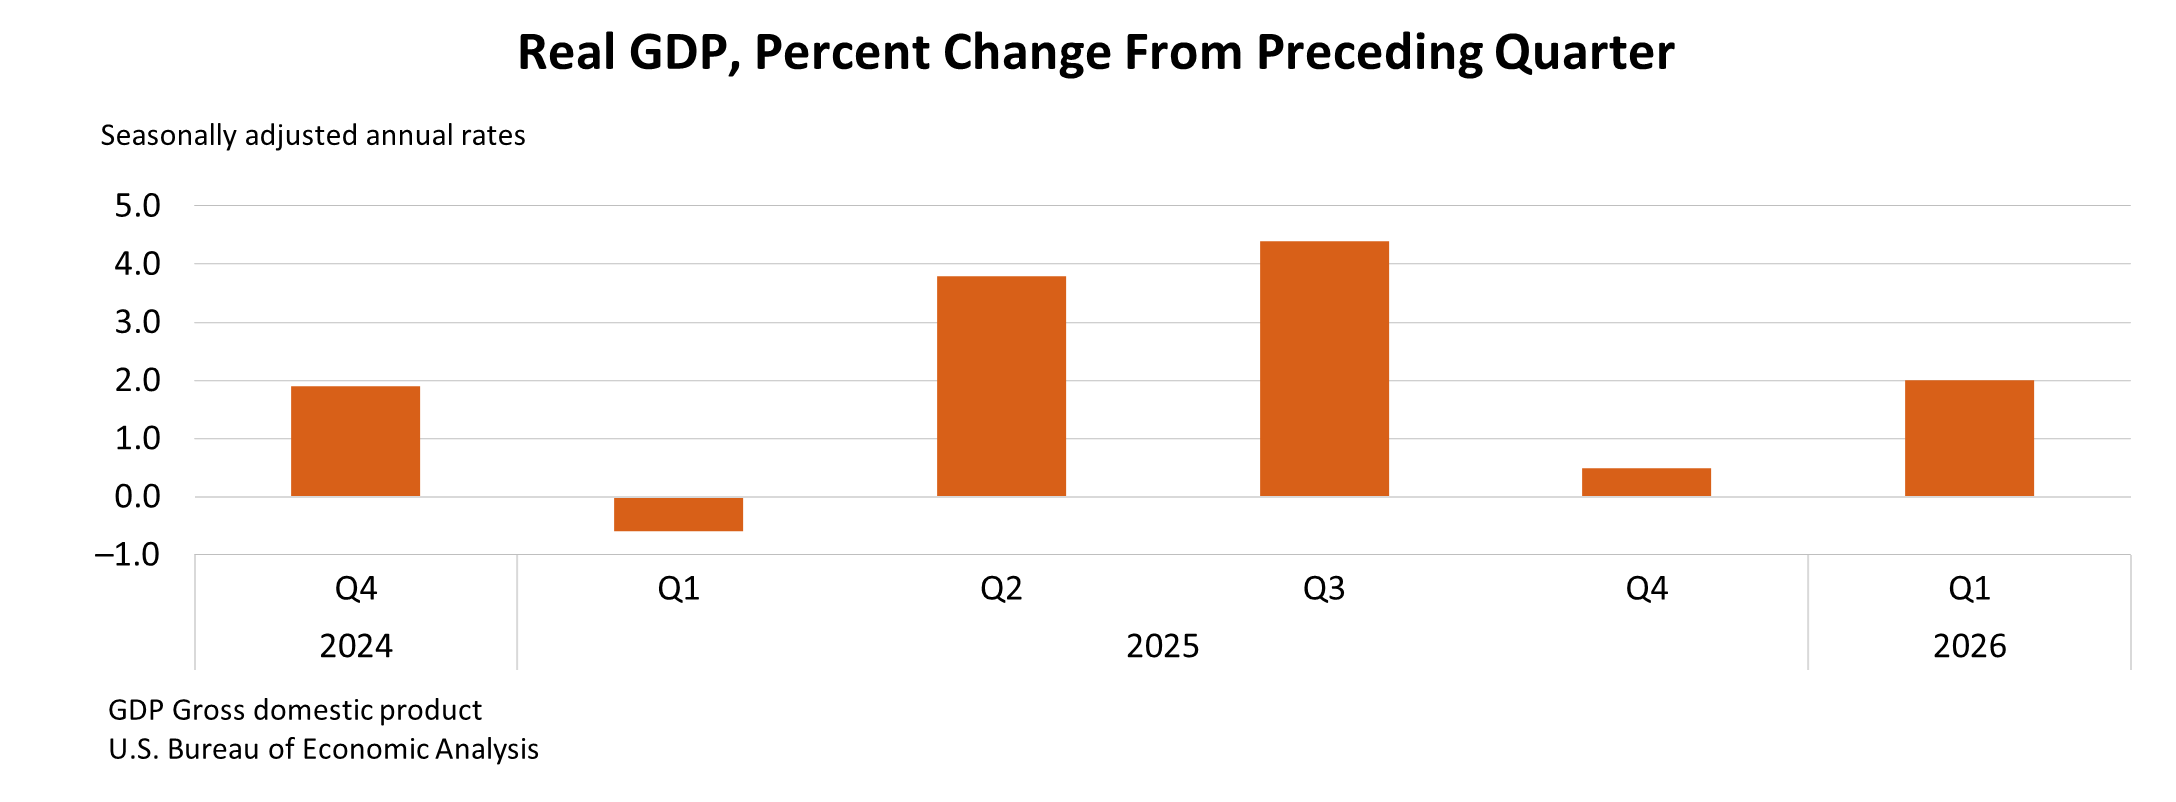
The U.S. economy expanded by 2.0% quarter-on-quarter (q/q, annualized) in the first quarter – a touch weaker than the consensus forecast of 2.3% – and an acceleration from Q4-2025's 0.5%. Major contributors to last quarter's growth included investment, exports, consumer spending, and government outlays. Imports were a meaningful drag.
Consumer spending rose by 1.6% q/q, or a similar pace to Q4's1.9%. Goods spending was flat on the quarter, while services rose by a healthy 2.4%.
Business investment grew by 10.4% q/q, led by a sharp acceleration in equipment spending (+17.2%) and another solid gain in intellectual property products (+13.0%). Meanwhile, spending on structures (-6.7% q/q) declined for the nineth consecutive quarter. Residential investment (-8.0%) also declined sharply, amid a further softening in home sales and little growth in construction activity.
Government spending (+4.4%) rebounded following a sharp decline in Q4 due to the 43-day government shutdown.
International trade shaved 1.3 percentage points (pp) from growth, as surge in imports (+21.4%) was only partly offset by a solid gain in exports (12.9%). Most of the gain in imports was driven by a pick-up in goods, though services were also higher. Inventory investment added a modest 0.4 percentage points to Q1 GDP.
Final sales to private domestic purchasers, a better gauge of underlying demand as it includes only household consumption and fixed investment rose by a healthy 2.5%, an acceleration from Q4's gain of 1.8%.
Core PCE inflation rose 4.3% q/q annualized, up sharpy from Q4's 2.7% - marking the fastest quarterly gain since Q1-2023.
Key Implications
The U.S. economy remained resilient though the first three-months of the year, with growth rebounding after a sluggish end to 2025. In part, the uptick was driven by a rebound from Q4's sharp decline in federal outlays, stemming from the record-long government shutdown. Business investment remained a bright spot, with gains driven by further investments in AI and some broadening in capital expenditures to more traditional areas of investment.
Consumer spending was a soft spot in Q1. While some of the weakness can be chalked up to weather related effects, the March figures (also released this morning) also came in a bit softer than expected, suggesting the recent jump in gasoline prices is already having some impact on spending patterns. Higher tax refunds should offer some near-term cushion for households, which alongside continued investments in AI, is likely to keep the economy expanding at around a 2% pace in Q2.
Canada’s Economy Continued to Grow in February
Canadian GDP ticked higher by 0.2% month-on-month (m/m) in February, in line Statistics Canada's advanced guidance and market expectations.
Growth was not particularly broad based. Only 8 of 20 industries registered an increase on the month. Goods industries rose for a third consecutive month (+0.4% m/m), while the services sector ticked higher by 0.1% m/m.
The manufacturing sector (1.8% m/m) contributed most to goods-side growth with strong gains in both machinery and transportation subsectors. The mining/oil/gas sector (+0.4% m/m) also pitched into the headline gain. Meanwhile, the construction sector slipped after three consecutive monthly gains.
On the services side increases in the finance and insurance sector (+0.3% m/m), wholesale trade (0.9% m/m), and transportation and warehousing (1.2% m/m) were slightly offset by declines in the public sector aggregate (-0.3% m/m).
Advanced guidance calls for no growth in March, with further gains in wholesale and transportation sectors being offset by a pullback in retail trade and the mining, oil and gas sector.
Key Implications
Canada's economy looks to be off to a solid start in 2026 after GDP contracted in Q4-2025. With February's print and a flash estimate for March, Q1-2026 growth is tracking around 1.7%, broadly consistent with the Bank of Canada's recently updated economic projections and our own forecast.
How growth evolves beyond Q1 will matter more for the policy outlook than the near term momentum itself, as the Canadian economy faces significant cross currents – most notably elevated trade uncertainty and, more recently, spillovers from the ongoing Middle East conflict. The BoC has emphasized that these forces leave two sided risks to the outlook, and policy remains data dependent, with the Governing Council prepared to respond if growth or inflation deviates materially from expectations. That said, our base case remains that the Bank holds the policy rate steady for the remainder of the year.
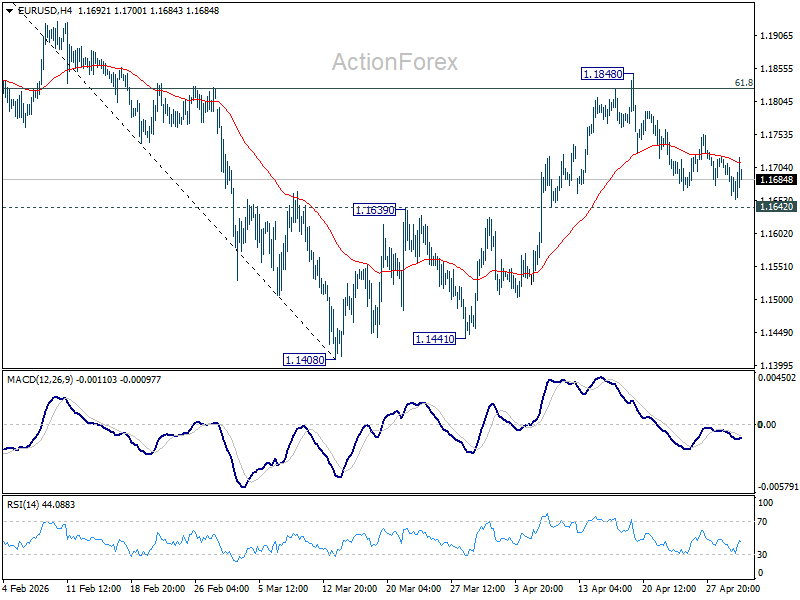
EUR/USD Mid-Day Outlook
Daily Pivots: (S1) 1.1650; (P) 1.1687; (R1) 1.1713; More….
Outlook is unchanged in EUR/USD and intraday bias stays neutral. Further rise will remain in favor as long as 1.1642 support holds. On the upside, sustained trading above 61.8% retracement of 1.2081 to 1.1408 at 1.1824 will pave the way to retest 1.2081 high. However, firm break of 1.1642 support will indicate the the rebound from 1.1408 has completed, and bring deeper decline back towards this low instead.
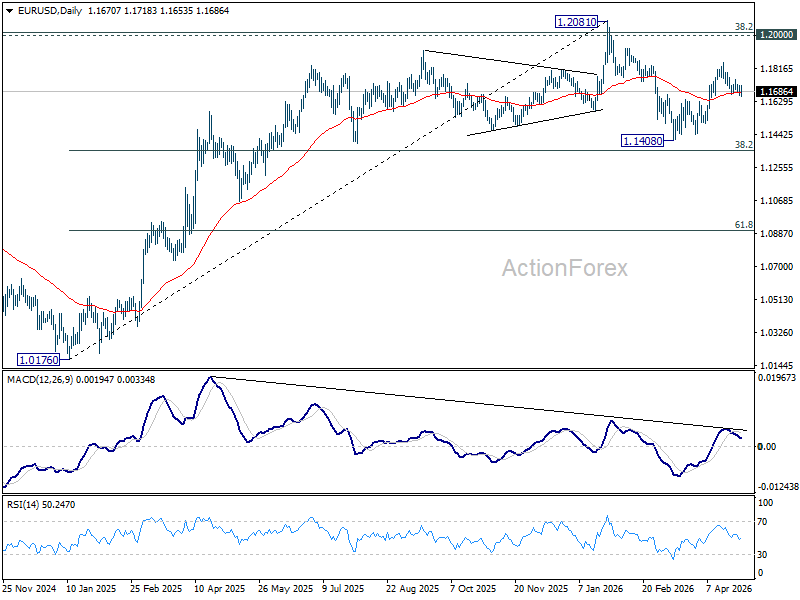
In the bigger picture, the strong support from 38.2% retracement of 1.0176 to 1.2081 at 1.1353 suggests that the pullback from 1.2081 is more likely a corrective move. Strong support was also found in 55 W EMA (now at 1.1530). Focus is back on 1.2 key cluster resistance level. Decisive break there will carry long term bullish implications. Nevertheless, break of 1.1408 support will revive the case of medium term bearish trend reversal.
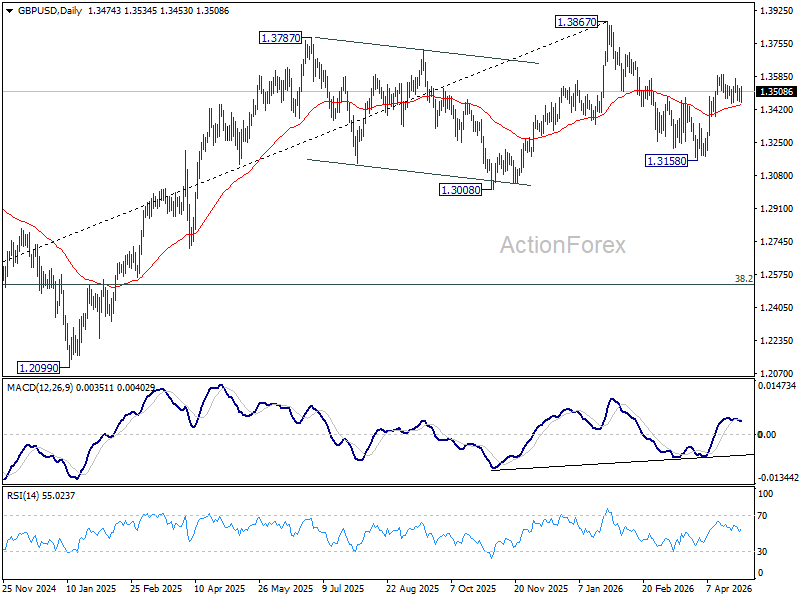
GBP/USD Mid-Day Outlook
Daily Pivots: (S1) 1.3446; (P) 1.3487; (R1) 1.3517; More...
Range trading continues in GBP/USD and intraday bias stays neutral. Further rise is still in favor with 1.3446 support intact. On the upside, firm break of 61.8% retracement of 1.3867 to 1.3158 at 1.3596 will pave the way to retest 1.3867 high. However, break of 1.3446 will turn bias back to the downside for deeper pullback.
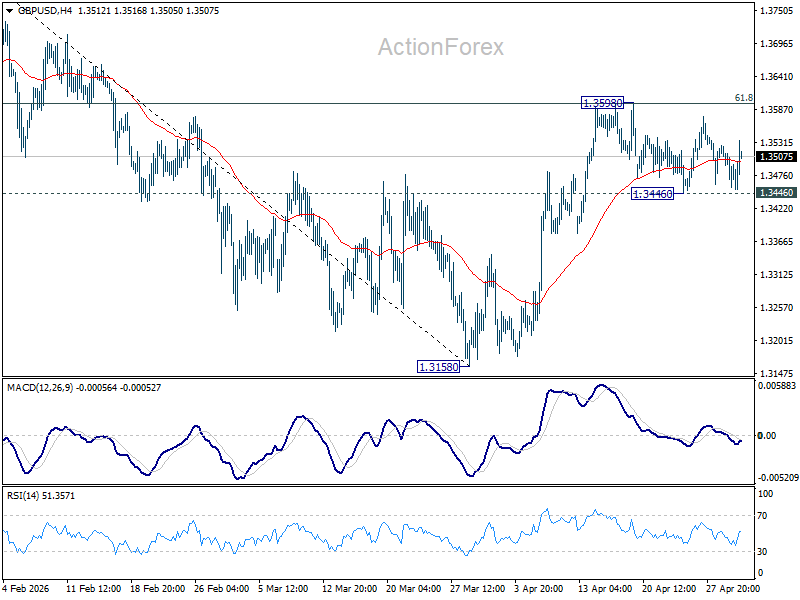
In the bigger picture, current development suggests that price actions from 1.3867 are merely a corrective pattern within the broader up trend from 1.0351 (2022 low). With 1.3008 support intact, medium term bullishness is maintained and break of 1.3867 is back in favor for a later stage, towards 1.4248 key resistance (2021 high).
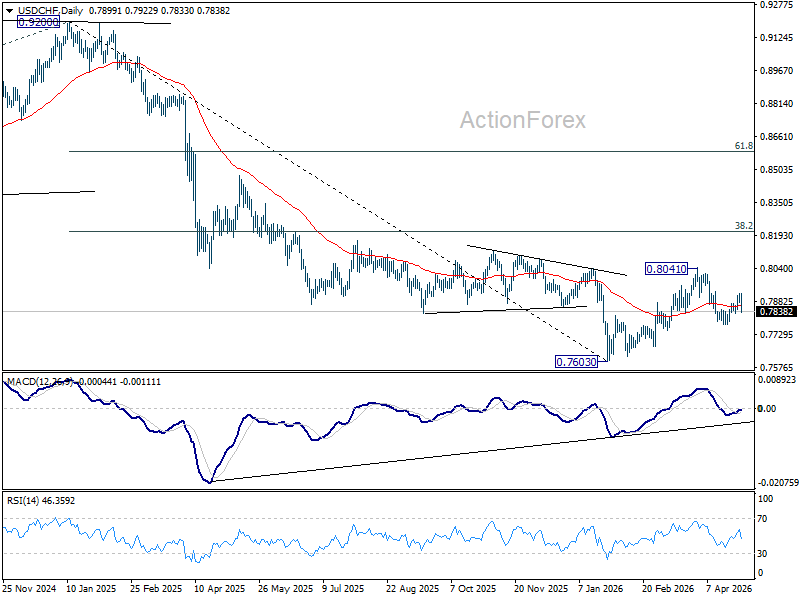
USD/CHF Mid-Day Outlook
Daily Pivots: (S1) 0.7891; (P) 0.7908; (R1) 0.7933; More….
Intraday bias in USD/CHF stays neutral and outlook is unchanged. Further decline is expected as long as 0.7933 resistance holds. Break of 0.7830 will bring retest of 0.7774 support. Sustained break of 61.8% retracement of 0.7603 to 0.8041 at 0.7770 will pave the way to retest 0.7603 low. However, decisive break of 0.7933 will argue that fall from 0.8041 has completed as a corrective move. Further rise should then be seen through 0.8041 to resume the whole rebound from 0.7603.
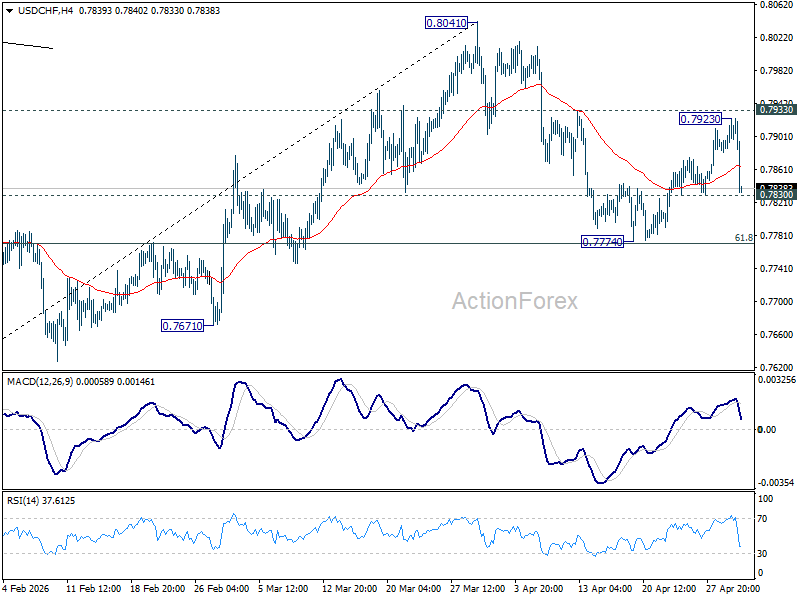
In the bigger picture, rebound from 0.7603 medium term bottom is seen as correcting the fall from 0.9200 only. Rejection by 55 W EMA (now at 0.8053) will affirm this bearish case, and setup down trend resumption to 100% projection of 1.0146 (2022 high) to 0.8332 from 0.9200 at 0.7382 at a later stage. Though, sustained break of 55 W EMA will suggest that it's probably correcting the larger scale down trend from 1.0146 (2022 high).
Japan Moves Markets Without Spending a Yen as USD/JPY Reversal Triggers FX Shake-Up
Yen is stealing the spotlight in an otherwise crowded macro day—and it did not take actual intervention to do it. After pushing through the 160 level earlier this week and hitting 160.71, USD/JPY has staged a dramatic reversal, plunging back toward 155 in a move that has caught traders off guard. The speed and scale of the shift point to a powerful repositioning dynamic, driven by a surge in intervention fears, and then amplified by opportunistic buying..
The catalyst was a “final warning” from Finance Minister Satsuki Katayama, who said the timing for “bold steps” is “now nearing.” That phrase, in Japan’s policy language, is widely understood as a direct precursor to intervention. Katayama’s follow-up message—“don’t put your smartphones down”—reinforced the urgency, particularly heading into Golden Week, when thinner liquidity can amplify market moves.
Markets reacted immediately. Short Yen positions were aggressively unwound, triggering a sharp squeeze. At the same time, new longs began to build, with traders betting that authorities will continue to apply pressure until USD/JPY stabilizes at lower levels, potentially closer to 155 or beyond. Whether Japan has intervened or not is almost secondary—the psychological impact alone has been enough to force a major repositioning.
This episode underscores the power of verbal intervention. Without spending a single Yen—at least officially—Japan has managed to engineer a nearly 500-pip move. More importantly, it has broken the one-way momentum that had dominated the currency, restoring uncertainty and two-way risk.
Meanwhile, Oil is providing the other half of today’s volatility story. Brent surged to a four-year high above $126 earlier in the session, reflecting ongoing geopolitical tensions. But the rally proved unstable, with prices reversing sharply back toward $114.
The pullback appears to be driven more by market mechanics than fundamentals. With April 30 marking the expiry of the June Brent contract, position adjustments and rollover flows likely played a role in the sudden reversal. The result is a highly volatile environment where oil is amplifying, rather than stabilizing, broader market dynamics.
In FX, the ripple effects are clear. Yen is by far the strongest performer, while Swiss Franc is benefiting from the unwind of carry trades. As Yen-funded positions are reduced, the Franc gains too.
Dollar, by contrast, is lagging. The retreat in oil prices has undermined its recent strength, and the greenback is largely ignoring macro data releases. Instead, flows are being driven by positioning and cross-market adjustments.
Sterling is finding modest support from a hawkish signal at the Bank of England, where Chief Economist Huw Pill voted for a rate hike. Euro remains steady, with the ECB’s hold offering little surprise and limited market impact.
The bigger picture is that today’s market is being driven less by data and more by positioning and policy signaling. Japan has shown that credible threats alone can move markets. And for now, the Yen’s dramatic comeback is the clearest sign that traders are no longer willing to test authorities without consequence.
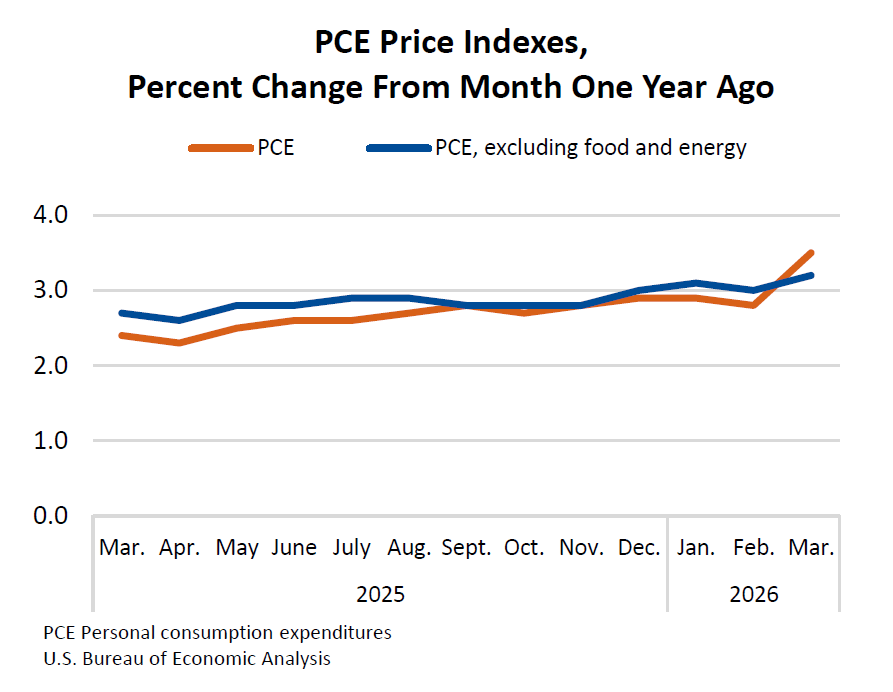
US Personal Income Beats, Spending Solid as PCE Inflation Accelerates to 3.5%
US personal income jumps 0.6% and spending rises 0.9% in March, while PCE inflation accelerates to 3.5%, signaling resurging price pressures. Read More.
US GDP Growth Picks Up to 2.0% but Misses Expectations as Inflation Surges
US GDP grows 2.0% in Q1, missing expectations, as PCE inflation surges to 4.5%, signaling rising price pressures despite solid demand. Read More.
ECB Holds Deposit Rate at 2.00% as Energy Shock Lifts Inflation Risks
ECB holds rates, but the real message is rising risk. Energy prices are pushing inflation higher while threatening growth. Read More.
BoE Holds at 3.75% as Pill Dissent for Hike on Second-Round Inflation Risks
BoE holds rates, but a hawkish dissent is the real story. Rising energy costs are raising fears of persistent inflation. Read More.
Eurozone Inflation Jumps to 3.0% in April, But Core CPI Ticks Down to 2.2%
Eurozone inflation is rising again—but it’s all about energy. Core pressures are easing, leaving policymakers with a difficult call. Read More.
Eurozone Economic Growth Slows in Q1 as GDP Misses Expectations at 0.1% qoq
Eurozone growth is slowing again. Germany is holding up, but France is stalling and overall momentum remains fragile. Read More.
Japan Industrial Output Falls -0.5% as Petrochemical Weakness Dominates
Japan’s factory output is slipping as energy-linked sectors are hit by supply disruptions, even as retail sales rebound and consumption holds up. Read More.
NZ ANZ Business Confidence Slumps to -10.6, Inflation Expectations Highest Since Feb 2024
Cost pressures are surging in New Zealand, driving inflation expectations higher and pushing business confidence back into negative territory. Read More.
China PMI Signals Modest Growth as Services Slip and Cost Pressures Build
China’s PMI data shows resilient output but growing divergence and rising inflation pressures within the economy. Read More.
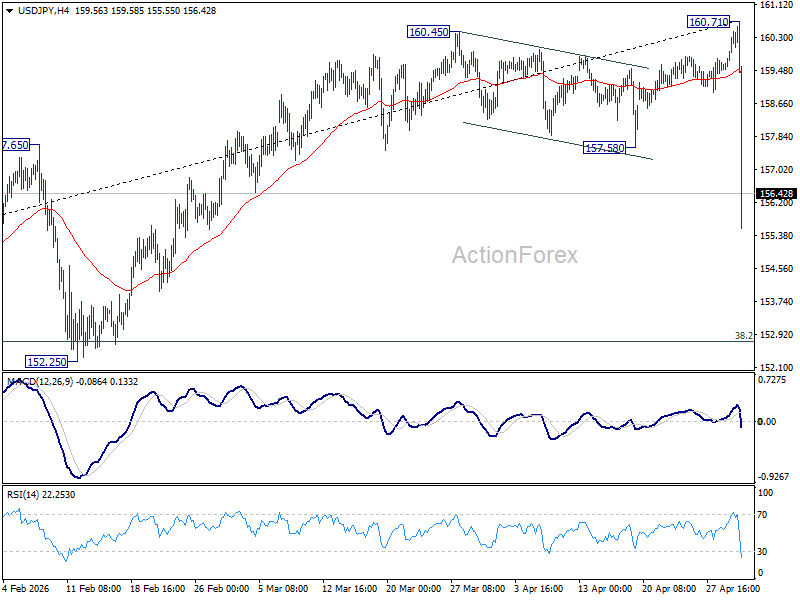
USD/JPY Mid-Day Outlook
Daily Pivots: (S1) 159.79; (P) 160.14; (R1) 160.79; More...
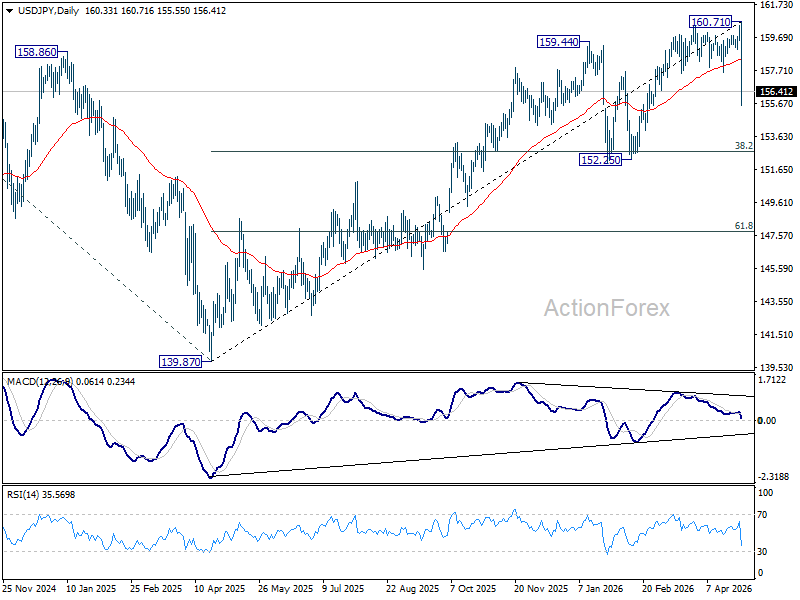
USD/JPY steep decline today suggests medium term topping at 160.71, on bearish divergence condition in D MACD. Deeper fall should be seen to 152.25 cluster support (38.2% retracement of 139.87 to 160.71 at 152.74). Strong support should emerge there to bring rebound, at least on first attempt. However, decisive break of 152.25/75 will confirm rejection by 161.94 high. That would pave the way back to 61.8% retracement at 147.83 next.
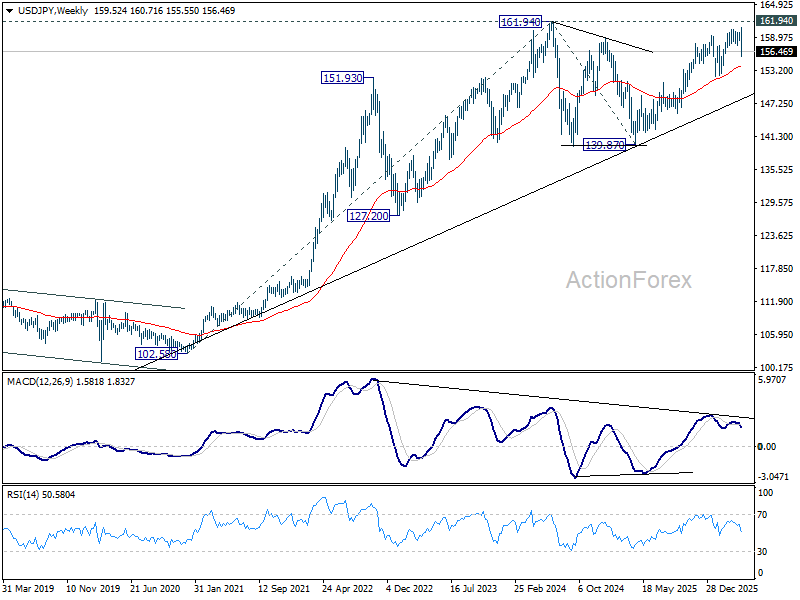
In the bigger picture, for now, corrective pattern from 161.94 (2024 high) is still seen as completed at 139.87. Rise from there is seen as resuming the long term up trend. So, break of 161.94 is expected at a later stage to resume the long term up trend. However, sustained break of 55 W EMA (now at 153.90) will dampen this view and bring deeper fall back towards 139.87 to extend the pattern from 161.94.
US Personal Income Beats, Spending Solid as PCE Inflation Accelerates to 3.5%
US personal income rose 0.6% mom in March, beating expectations of 0.3% mom, signaling stronger household income growth. At the same time, personal consumption expenditures increased 0.9% mom, in line with expectations, indicating that consumer demand remains resilient despite rising price pressures.
The inflation picture, however, showed a clear pickup. The PCE price index rose 0.7% mom, while core PCE increased 0.3% mom, both matching expectations.
On an annual basis, headline PCE accelerated from 2.8% yoy to 3.5% yoy, while core PCE edged up from 3.0% yoy to 3.2% yoy. The data suggests that price pressures are re-intensifying, even as monthly core readings remain relatively contained.
| Indicator | February | March |
|---|---|---|
| PCE Price Index (MoM) | — | 0.7% |
| Core PCE (MoM) | — | 0.3% |
| PCE Price Index (YoY) | 2.8% | 3.5% |
| Core PCE (YoY) | 3.0% | 3.2% |
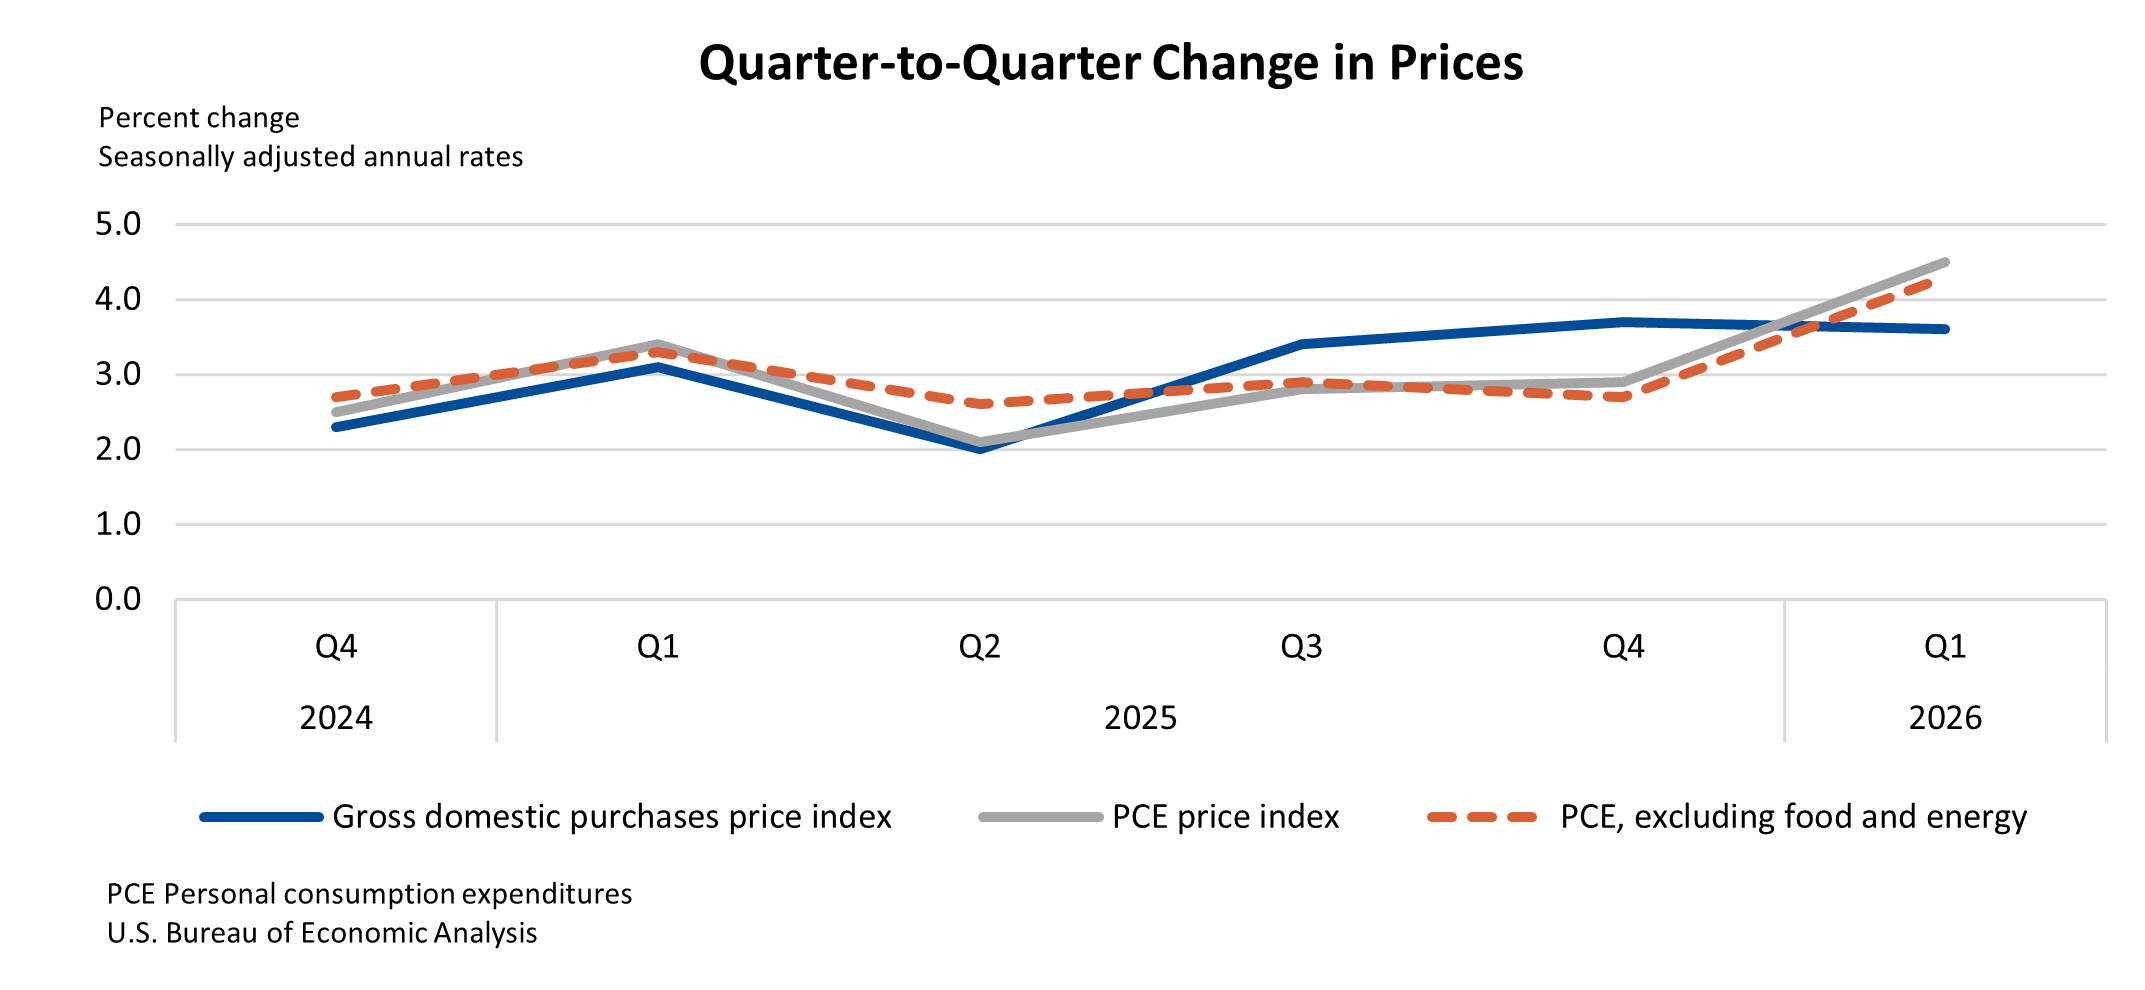
US GDP Growth Picks Up to 2.0% but Misses Expectations as Inflation Surges
US economy expanded at an annualized pace of 2.0% in Q1, accelerating from 0.5% in Q4 2025 but falling short of expectations for 2.2% growth. The rebound was driven by stronger investment, exports, government spending, and continued consumer activity, although a rise in imports—subtracting from GDP—partly offset the overall gain.
The composition of growth points to a shift in momentum. Investment and exports provided a stronger contribution, while government spending also turned higher. However, consumer spending decelerated compared to the previous quarter, suggesting some moderation in household demand. Still, underlying domestic demand remained firm, with real final sales to private domestic purchasers rising 2.5%, up from 1.8% in Q4.
Inflation pressures, however, intensified sharply. The PCE price index jumped to 4.5% from 2.9%, while core PCE rose to 4.3% from 2.7%, signaling a significant pickup in underlying price pressures. Although the broader price index for domestic purchases eased slightly to 3.6%, the surge in PCE inflation underscores a challenging backdrop for policymakers, where growth remains resilient but inflation risks are rising again.