Sample Category Title
Gold (XAU/USD) Slides 1% as Concerns Rise of Prolonged Middle East Conflict, Can Bulls Hold the Line at $4,500?
- Gold (XAU/USD) is sliding due to heightened fears of a prolonged Middle East conflict and increased US Dollar strength.
- Technical analysis confirms a structural shift to bearish on the H4 chart, breaking key support levels
- Bulls' ultimate "line in the sand" is the major psychological support at $4,500, with the short-term outlook remaining bearish while the price stays below the $4,601–$4,615 resistance zone.
Gold prices fell in early European trade today as markets saw fears rise of a prolonged Middle East conflict. This comes at a time when major Central Banks including the Federal Reserve, ECB and BoE warned this week that a prolonged conflict could have significant implications for inflation and thus monetary policy.
Reports suggest the US might launch new military attacks on Iran. This renews worries for market participants that the situation will get even worse and lead to more fighting. Due to the US dollar being seen as the safest money to hold during scary times, these tensions actually make the dollar stronger.
However, when the dollar is strong and the world is focused on this type of conflict, it usually weighs on the price of gold. Add to that the inflation picture and Gold bulls may struggle in the near-term until clarity is forthcoming.
The Higher Timeframe: H4 Chart Analysis
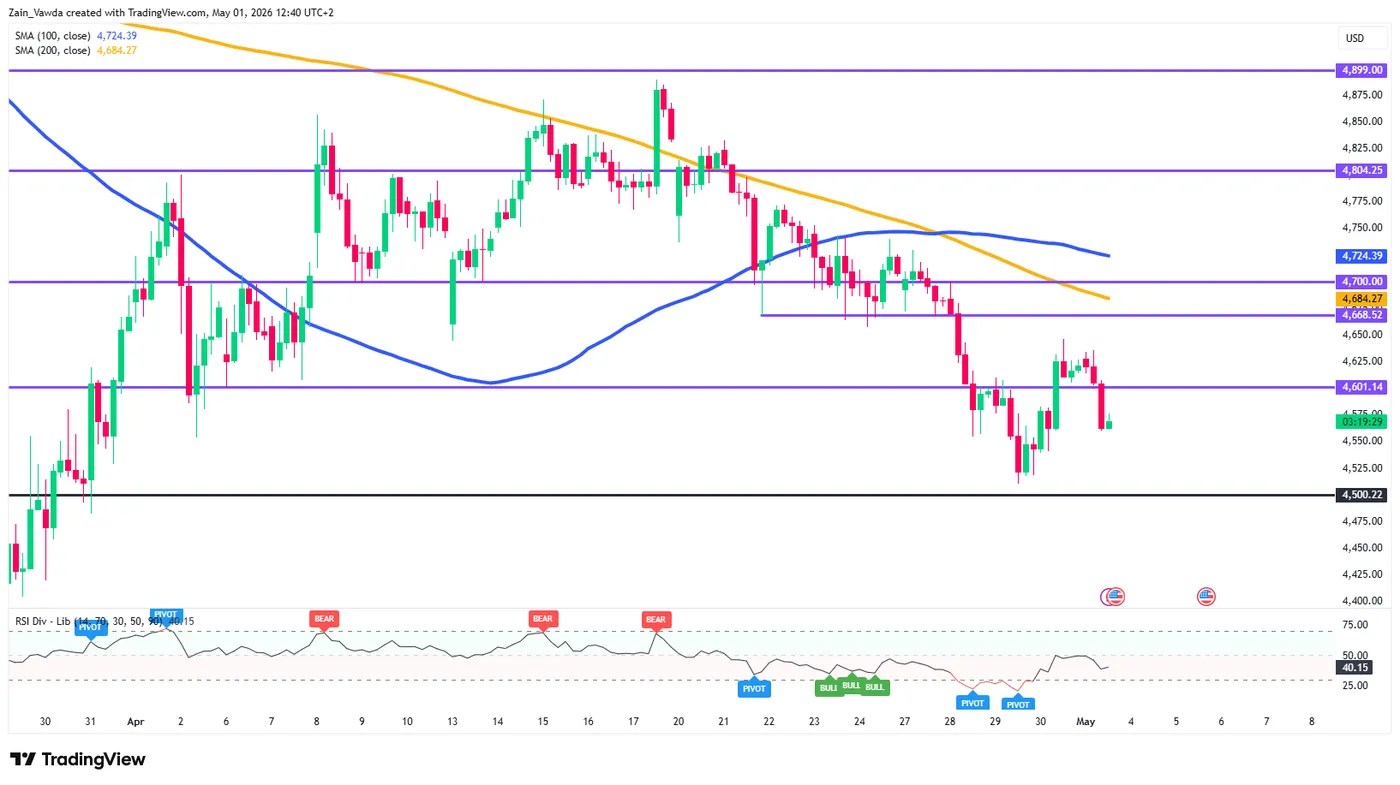
On the H4 timeframe, the structural shift from bullish to bearish is evident. Gold has broken below several key horizontal support levels, most notably the 4,700 and 4,668 handles.
The price is currently trading well below both the 100-period Simple Moving Average (MA - Blue) and the 200-period MA (Orange).
The RSI on this timeframe is hovering near the 40 mark; while not yet oversold, it suggests that the path of least resistance remains to the downside. The major psychological level of 4,500 stands as the ultimate "line in the sand" for bulls.
Gold (XAU/USD) Four-Hour Chart, May 1, 2026
Source: TradingView (click to enlarge)
The Intermediate View: H1 Chart Analysis
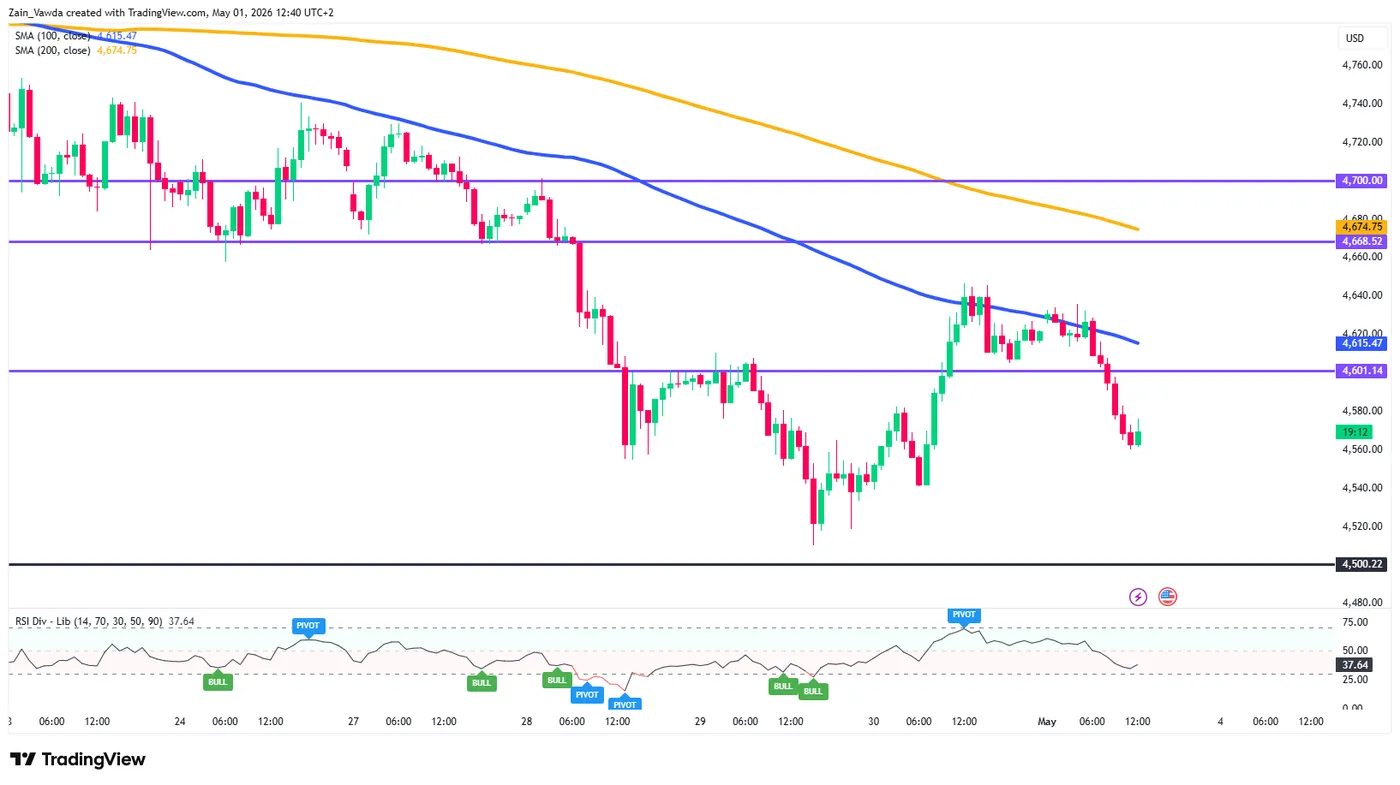
The H1 chart highlights the rejection at the 4,615 resistance level, which aligns closely with the 100-hour MA. After a brief corrective bounce on April 30th, the price failed to reclaim the 4,620 area, resulting in a sharp sell-off during the early May 1st sessions.
We can observe that the 4,601 level, previously a support zone, has now transitioned into a formidable resistance.
The H1 RSI shows a series of lower highs, indicating that buying exhaustion is setting in every time the metal attempts a minor recovery.
As long as Gold remains capped by the 4,601–4,615 zone, the short-term outlook remains decidedly bearish.
Gold (XAU/USD) One-Hour Chart, May 1, 2026
Source: TradingView (click to enlarge)
Intraday Outlook: M15 Potential Scenarios
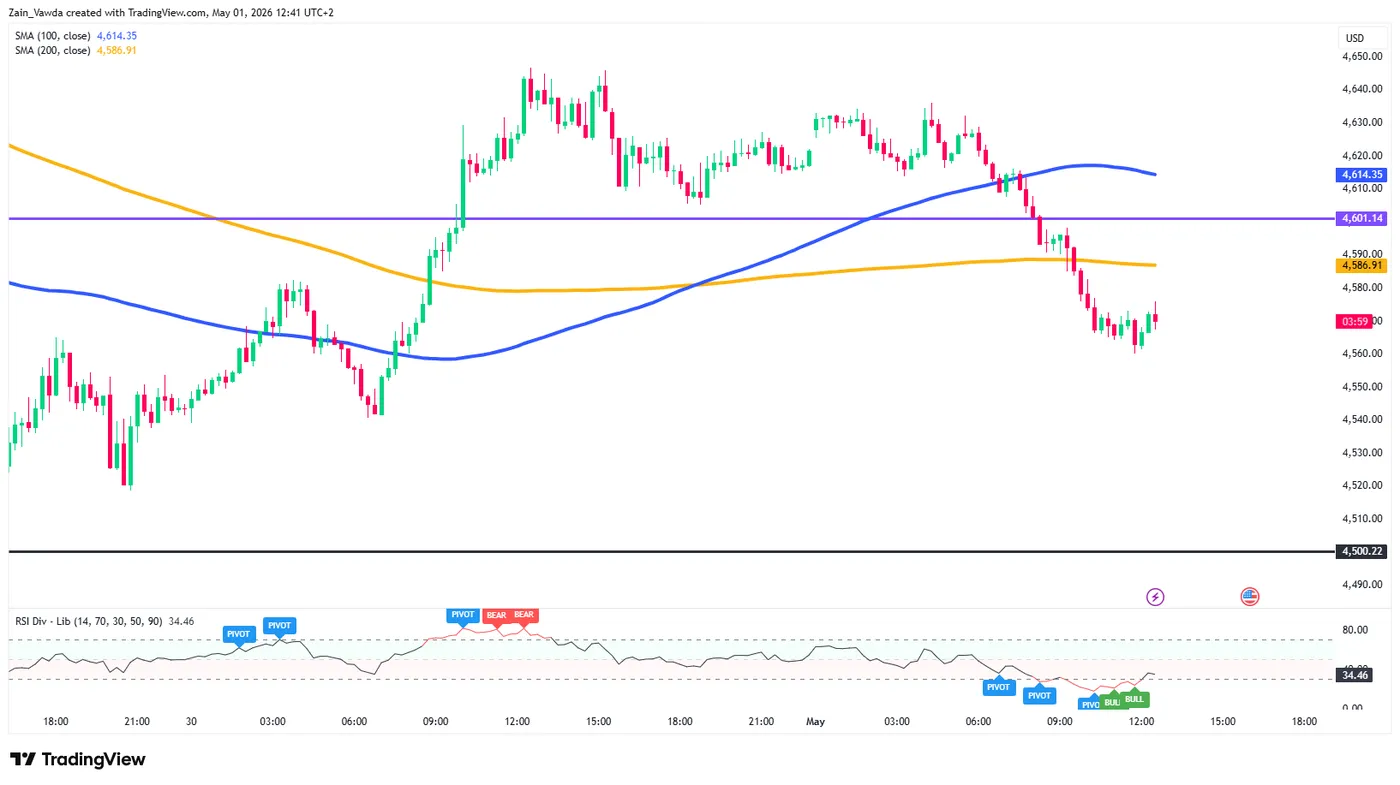
The M15 chart provides a granular look at the current price action, which is currently consolidating after a drop toward the 4,560 area. The intraday trend is defined by the 100-period MA (Blue) providing constant dynamic resistance.
The Bearish Scenario
The immediate focus for bears is a break below the recent swing low at 4,560. If the New York session brings further dollar strength or higher yields, a break of this level could trigger a rapid descent toward the 4,520 support area, followed by the major psychological floor at 4,500. Any rallies toward the 4,586 (200 MA) or 4,601 levels are likely to be viewed as selling opportunities by intraday traders.
The Bullish Scenario
For a bullish recovery to take shape, XAU/USD needs a sustained break above the 4,601 pivot level. A "Bullish Divergence" on the M15 RSI (where price makes a lower low but RSI makes a higher low) would be the first signal of a potential reversal. If bulls can reclaim 4,614, it opens the door for a corrective move back toward 4,640.
However, given the current alignment of the moving averages, any move higher is currently classified as a "dead cat bounce" rather than a trend reversal.
Technical Levels to Watch:
- Resistance: 4,586, 4,601, 4,615
- Support: 4,560, 4,520, 4,500
Gold (XAU/USD) M15 Chart, May 1, 2026
Source: TradingView (click to enlarge)
UK Manufacturing PMI Finalized at Near Four-Year High, but Cost Pressures Surge
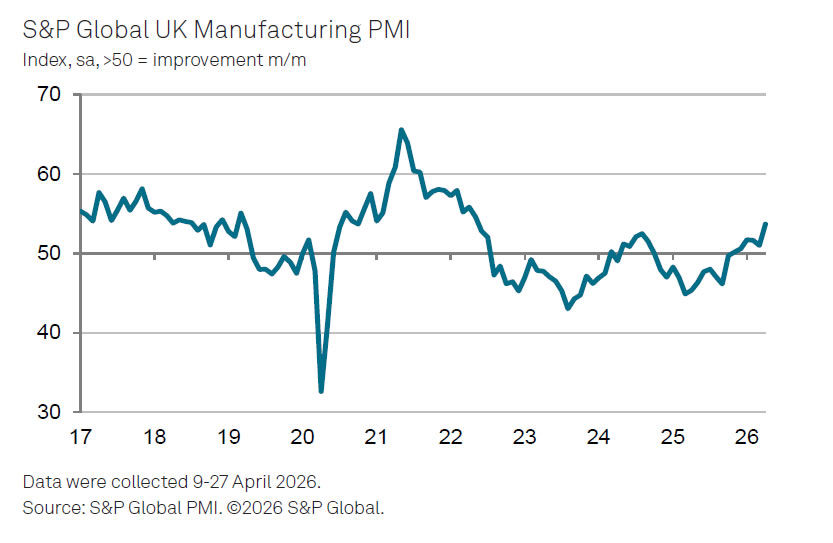
UK PMI Manufacturing was finalized at 53.7 in April, up strongly and marking the highest level since May 2022. The rebound reflects a recovery from March’s weakness, with output, new orders, and employment all improving, while staffing levels rose for the first time in 18 months.
However, the strength comes with clear underlying strains. According to S&P Global Market Intelligence, supply chain disruptions linked to restrictions in the Strait of Hormuz are significantly affecting input deliveries. Supplier lead times lengthened at the fastest pace in almost four years, while input price inflation surged to near a four-year high, highlighting intensifying cost pressures across the sector.
As Rob Dobson noted, part of the current output strength reflects front-loaded demand rather than sustained momentum. “The gain in production is partly the result of clients bringing forward purchases,” he said, warning that growth could cool later in the year as this effect unwinds. At the same time, elevated cost pressures suggest inflation risks will remain a key concern for the sector.
Elliott Wave Perspective: S&P 500 (SPX) Impulsive Rally from March 2026 Low Nears End
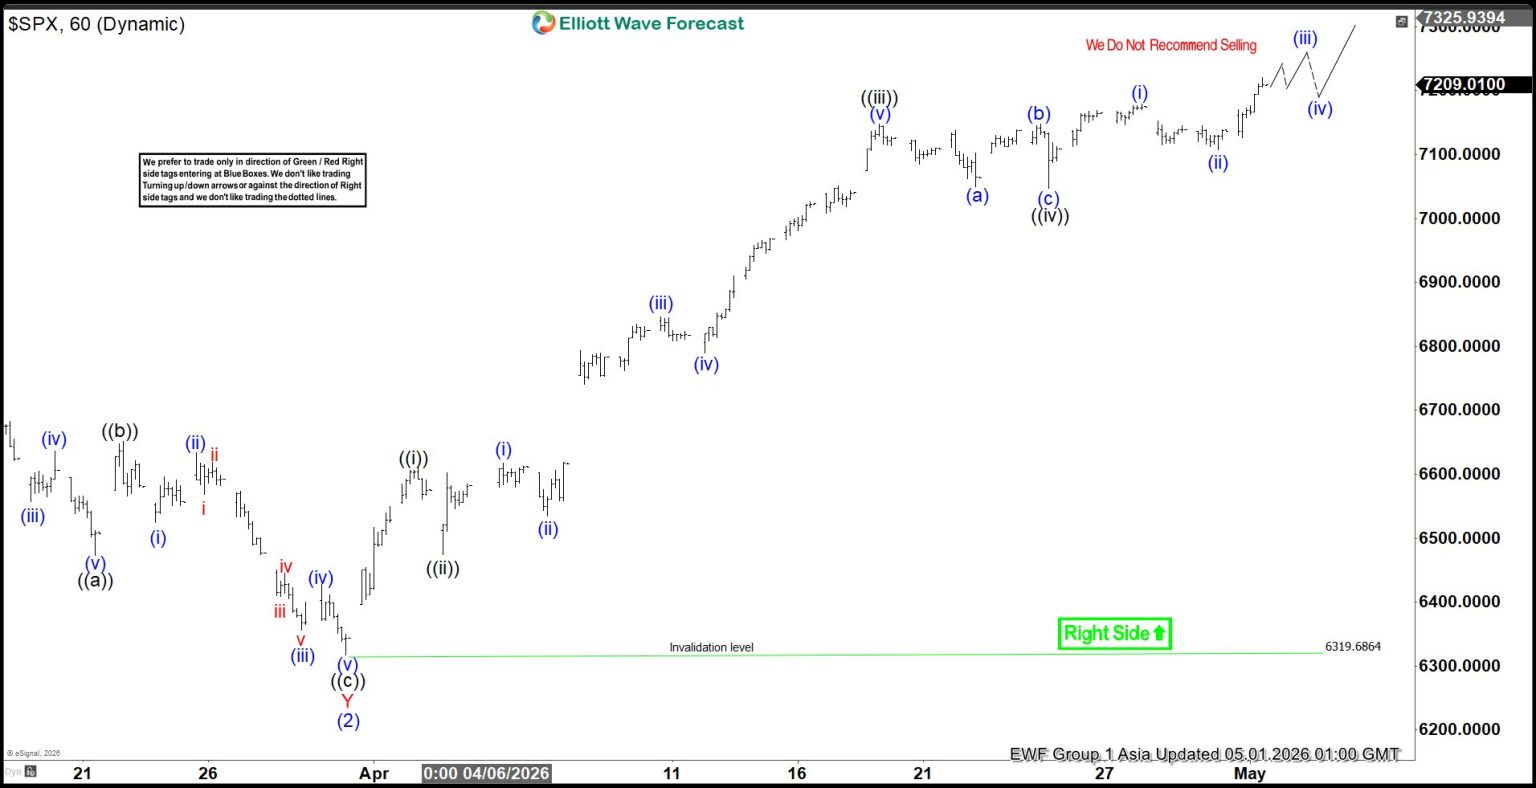
The S&P 500 Index (SPX) ended its correction from the April 2025 low at 6319.68, which we identify as wave (2). From that level, the Index advanced in wave (3) and broke to a new all‑time high. This confirmed the start of the next bullish leg and established a bullish sequence from the April 2025 low. The 100% Fibonacci extension target for wave (3) is projected at 8476.
Wave (3) is unfolding as an impulsive Elliott Wave structure, with wave 1 of (3) approaching completion. From the wave (2) low, wave ((i)) advanced to 6609.67. A corrective pullback in wave ((ii)) followed, ending at 6474.94. The Index then rallied in wave ((iii)) toward 7147.52. A modest retracement in wave ((iv)) concluded at 7046.55. The final leg, wave ((v)) of 1, should end soon, completing the cycle from the March 31, 2026 low. Afterward, the Index will enter wave 2, correcting the cycle from the March 31 low, before resuming its broader rally.
In the near term, as long as the pivot at 6319.68 remains intact, pullbacks should find support within a three‑ or seven‑swing sequence. This reinforces the bullish outlook and suggests further upside potential as the larger trend continues to progress.
S&P 500 (SPX) 60-Minute Elliott Wave Chart
SPX Elliott Wave Video:
https://www.youtube.com/watch?v=vXA9Bj7ciDU
EUR/USD Eyes Gains As USD/CHF Weakness Deepens Again
EUR/USD started a fresh increase above 1.1700 and 1.1720. USD/CHF declined further and is now struggling below 0.7835.
Important Takeaways for EUR/USD and USD/CHF Analysis Today
- The Euro started a decent increase from 1.1650 against the US Dollar.
- There was a break above a bearish trend line with resistance at 1.1685 on the hourly chart of EUR/USD at FXOpen.
- USD/CHF declined below the 0.7865 and 0.7850 support levels.
- There was a break below a bullish trend line with support at 0.7910 on the hourly chart at FXOpen.
EUR/USD Technical Analysis
On the hourly chart of EUR/USD at FXOpen, the pair started a fresh increase from the 1.1650 zone. The Euro cleared the 1.1700 barrier to move into a bullish zone against the US Dollar.
There was a break above a bearish trend line with resistance at 1.1685. The bulls pushed the pair above the 50-hour simple moving average and 1.1720. Finally, the pair cleared 1.1735. A high was formed near 1.1740 and the pair is now consolidating gains.
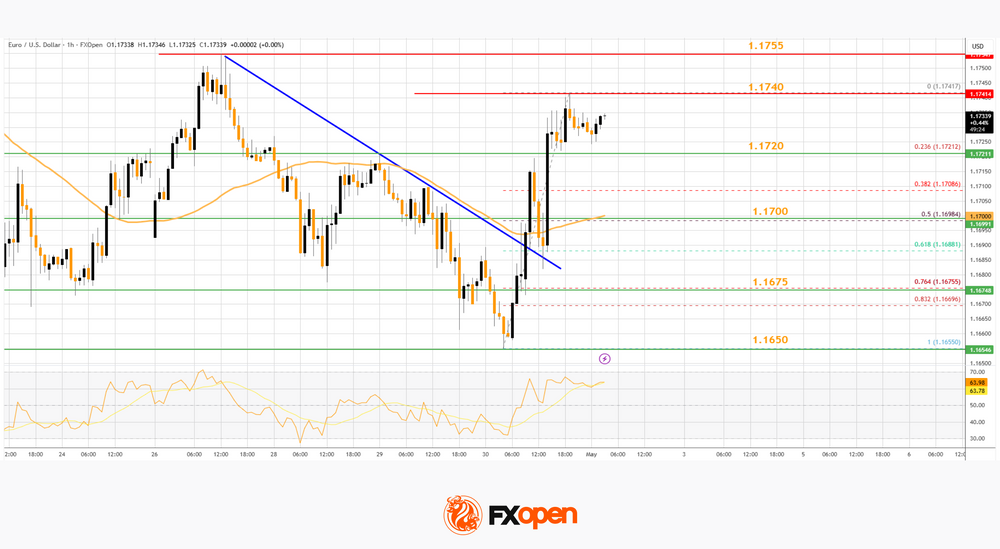
An Immediate bid zone on the downside is near the 23.6% Fib retracement level of the upward wave from the 1.1655 swing low to the 1.1740 high at 1.1720.
The next area of interest could be near 1.1700, the 50% Fib retracement level, and the 50-hour simple moving average. A downside break below 1.1700 might send the pair toward 1.1675. Any more losses might send the pair into a bearish zone toward 1.1650.
If there is a fresh increase, an immediate hurdle on the EUR/USD chart is 1.1750. The first major pivot level for the bulls could be 1.1755. An upside break above 1.1755 might send the pair to 1.1800. The next selling zone could be 1.1850. Any more gains might open the doors for a move toward 1.1920.
USD/CHF Technical Analysis
On the hourly chart of USD/CHF at FXOpen, the pair started a fresh decline from well above 0.7900. The US Dollar dropped below 0.7880 to move into a negative zone against the Swiss Franc.
There was a break below a bullish trend line with support at 0.7910. The bears pushed the pair below the 50-hour simple moving average and 0.7850. Finally, the bulls appeared near 0.7800. A low was formed near 0.7805, and the pair is now consolidating losses.
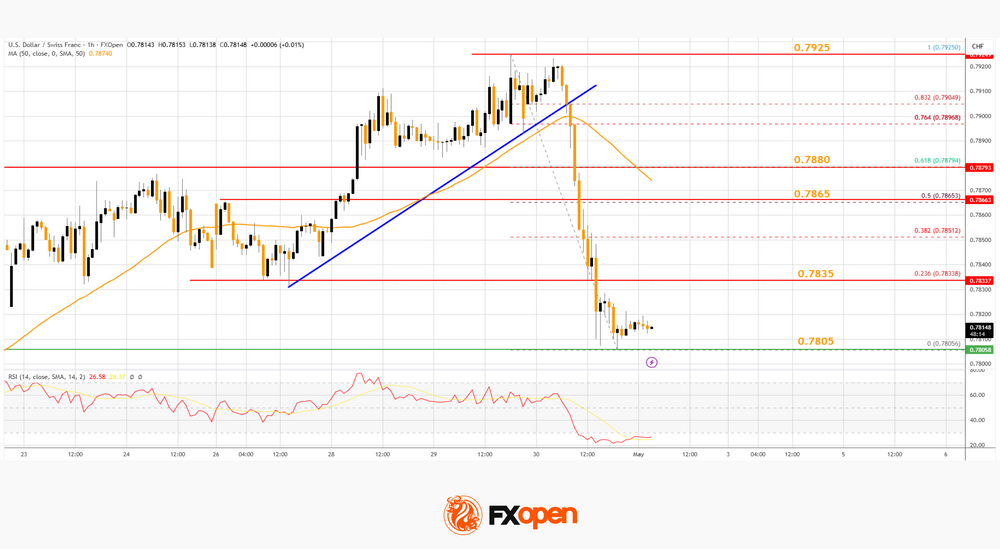
On the upside, the pair could face bears near the 23.6% Fib retracement level of the downward move from the 0.7925 swing high to the 0.7805 low at 0.7835.
The first major resistance sits near the 50% Fib retracement level at 0.7865. The main barrier for an upside break could be near the 50-hour simple moving average at 0.7880. A daily close above 0.7880 could start a fresh increase. In the stated case, the pair could rise toward 0.7925. The next stop for the bulls might be 0.7965.
On the downside, immediate support on the USD/CHF chart is 0.7805. The first major breakdown zone could be 0.7780. A close below 0.7780 might send the pair to 0.7750. Any more losses may possibly open the doors for a move toward 0.7700 in the coming days.
Trade over 50 forex markets 24 hours a day with FXOpen. Take advantage of low commissions, deep liquidity, and spreads from 0.0 pips (additional fees may apply). Open your FXOpen account now or learn more about trading forex with FXOpen.
This article represents the opinion of the Companies operating under the FXOpen brand only. It is not to be construed as an offer, solicitation, or recommendation with respect to products and services provided by the Companies operating under the FXOpen brand, nor is it to be considered financial advice.
Weekly Review: Markets at Highs, Fed Bolstering USD, That Creates Headwinds for Gold and Bitcoin
US Dollar
The US dollar has received positive news from the Fed, the oil market and the US economy. Jerome Powell is staying in the FOMC, Brent crude has surpassed $120 per barrel, and orders for durable goods excluding aircraft and military equipment jumped by 3.3% in March. This was the best reading for the leading indicator in the last six years.
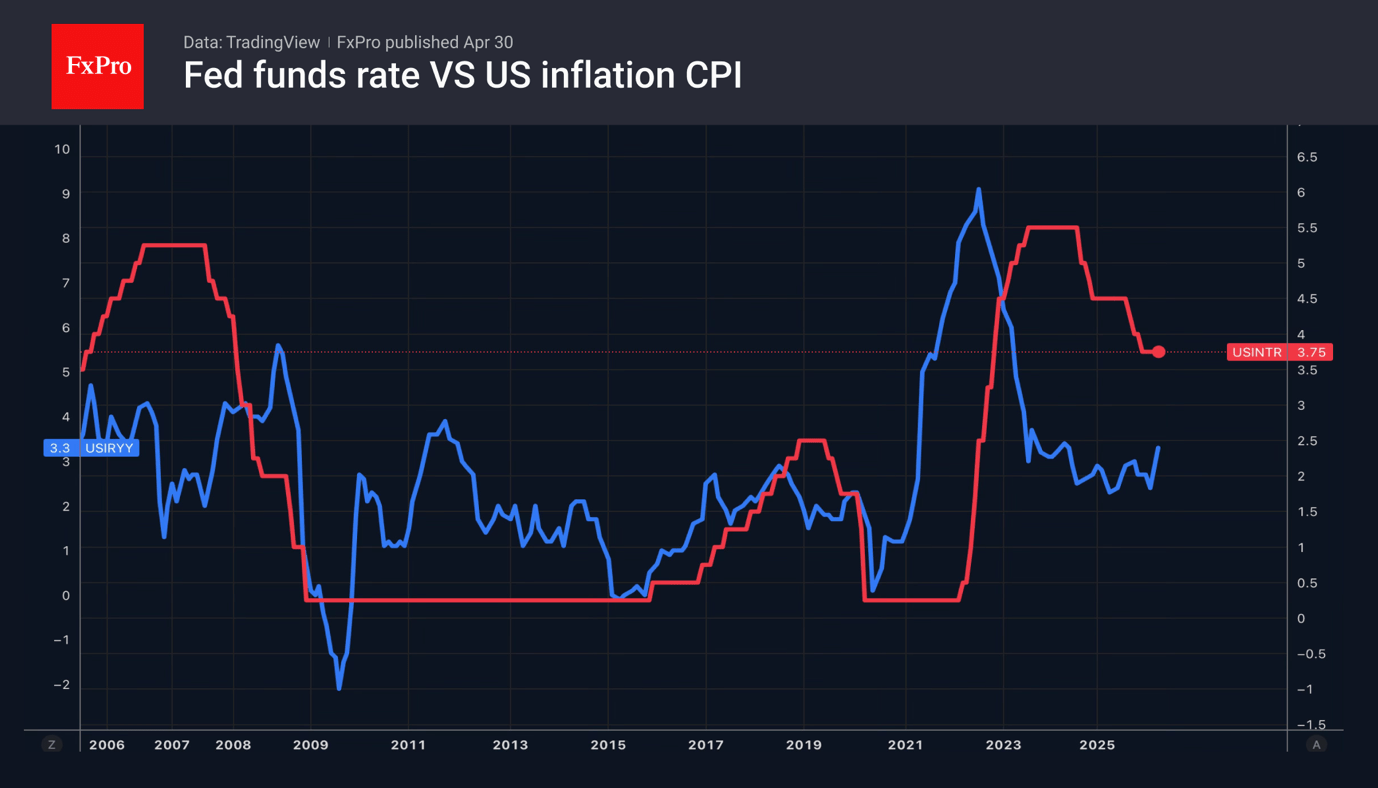
Powell believes that the US labour market is stabilising, while inflation is set to accelerate due to the conflict in the Middle East. This combination provides a strong case for a rate hike. The futures market has raised the odds of such an outcome in 2026, playing into the hands of EURUSD bears.
He also says he will remain at the Fed as Governor, with Kevin Warsh taking over as Chairman. Powell is prepared to defend the Fed’s independence, which has been threatened by the White House, undermining investor confidence in the US dollar and contributing to its decline. The task facing Kevin Warsh, recently appointed by Congress to reform the Federal Reserve, is becoming more complicated.
Stock indices
US stock indices continue to ignore geopolitics. Had someone said at the start of the conflict in the Middle East that the Strait of Hormuz would be closed until the end of April, there would have been no shortage of bearish forecasts for shares. Currently, Polymarket puts the odds at 52% that the world’s main oil artery will remain blocked until the end of June, while the S&P 500 is trading near its record highs.
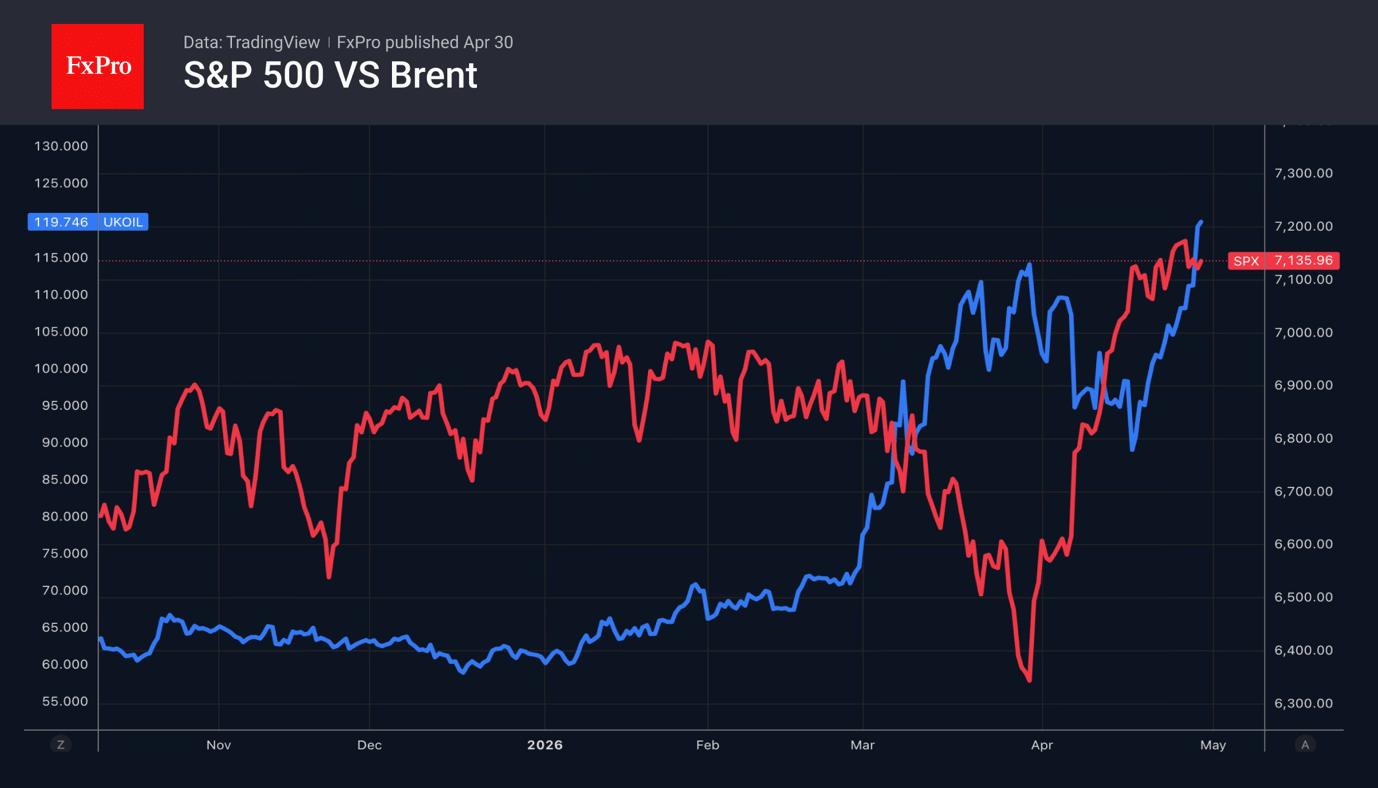
Investors believe that a recession may not materialise, but they cannot afford to miss out on a strong corporate earnings season. From March lows, the Magnificent Seven has risen by 21% on expectations of higher first- and second-quarter profits. The earnings-per-share forecast for the information technology sector stands at 41%, double that of the materials sector, which ranks second.
Investors are once again captivated by artificial intelligence. However, the same fears that were present in the market before the conflict resurface from time to time. For instance, news that OpenAI had failed to meet its profit and user growth forecasts led to the share prices of related companies plummeting. Investors feared that the colossal investments in AI would fail to generate decent financial returns.
Gold
Soaring oil prices, the sharpest rise in 2-year Treasury yields since the April 2022 FOMC meeting, and a strengthening US dollar are forcing gold to retreat. The precious metal is concerned about the threat of central banks, led by the Fed, keeping rates high for an extended period, and the growing risks of further hikes amid rising inflationary pressures against the backdrop of the Middle East conflict.
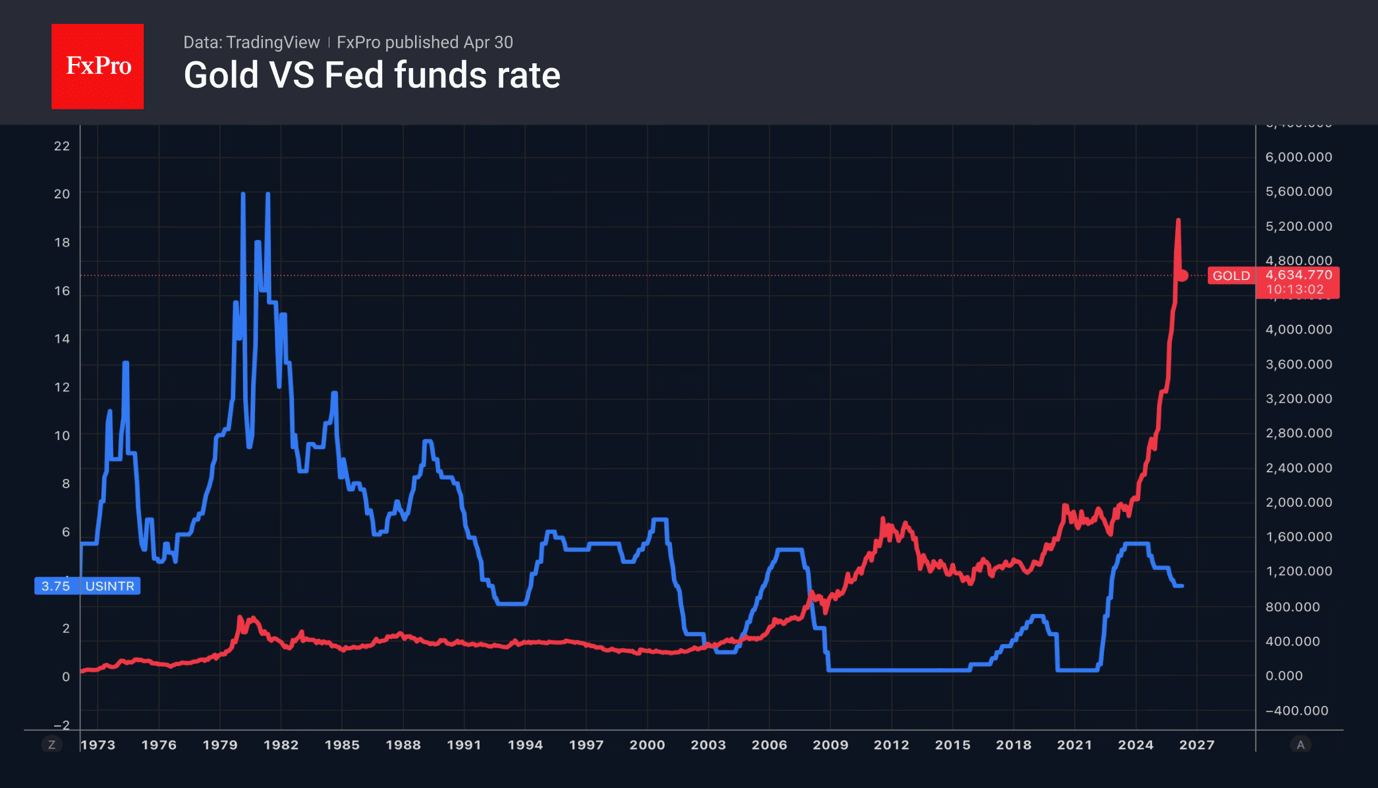
Jerome Powell maintains that the US labour market is gradually stabilising, while inflation risks rising further due to geopolitical factors. Three of his FOMC colleagues dissented, arguing that rates are more likely to fall than rise. The result was a rally in Treasury bond yields and a strengthening of the US dollar. A combination that creates headwinds for Gold.
Gold might have fallen even further had it not been for renewed central bank interest in bullion. According to the World Gold Council, their purchases rose from 208 tonnes to 240 tonnes in the first quarter. Poland, Uzbekistan and China were particularly active. In contrast, Turkey, Russia and Azerbaijan became net sellers.
Cryptocurrency
Bitcoin is not seeing the same bullish momentum as the stock market. A key barrier around 80,000 is holding the price back, prompting investors to take profits.
Strong demand for derivatives at this level is forcing market makers to hedge by selling as Bitcoin approaches it. As a result, each attempt to extend the rally is quickly capped.
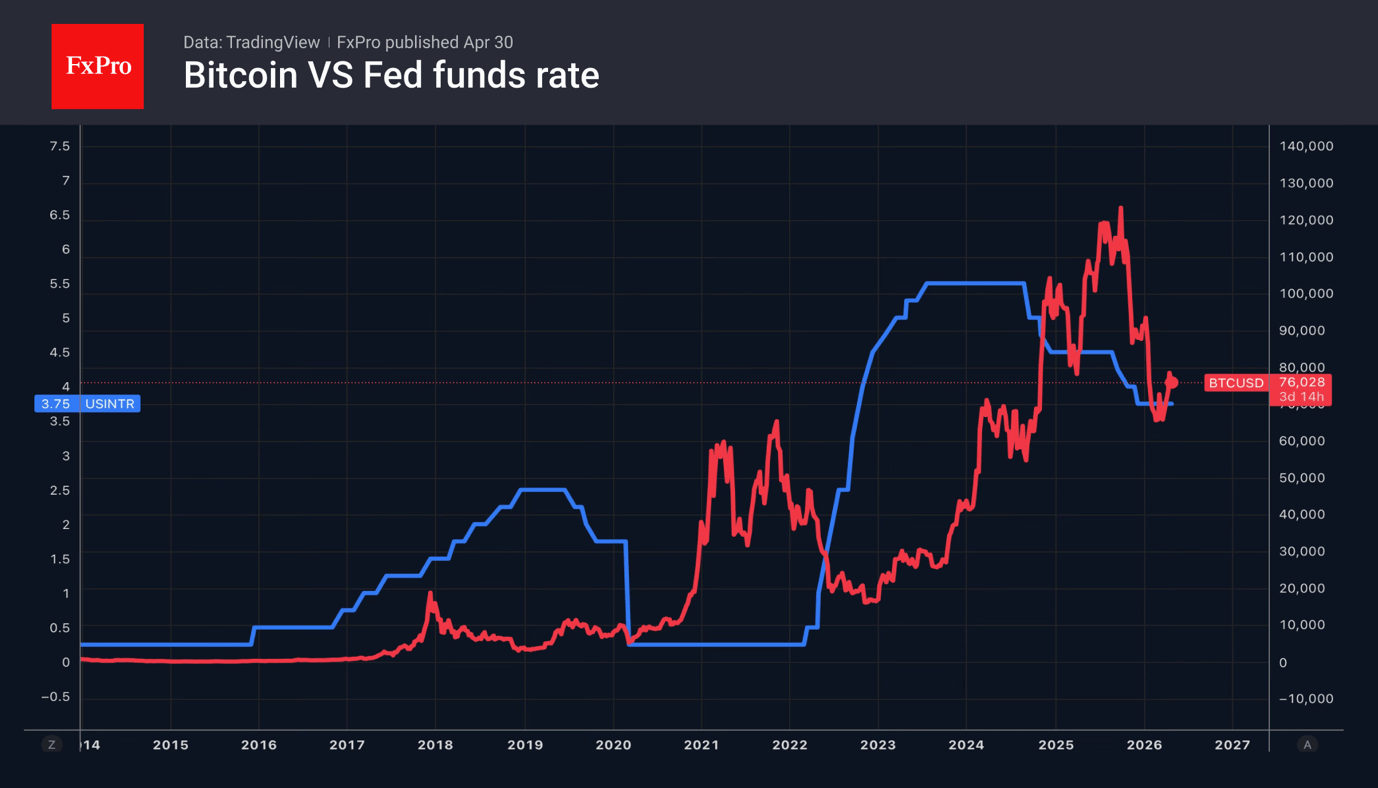
Also, the macroeconomic backdrop is not conducive to a resumption of the uptrend. Galaxy Digital notes that when Bitcoin was trading near record highs in the autumn of 2025, the Fed was cutting rates. Doing so now would be problematic, as rising oil prices stemming from the conflict in the Middle East are forcing central banks to maintain tight monetary policy.
What next?
The key event on the economic calendar for the first full five-day week of May will be the US April jobs report. The data will either confirm or refute Jerome Powell’s suggestion that the labour market is stabilising. If this is indeed the case, accelerating US inflation driven by rising energy prices and second-order effects will pave the way for a federal funds rate hike in 2026, which would be good news for the dollar.
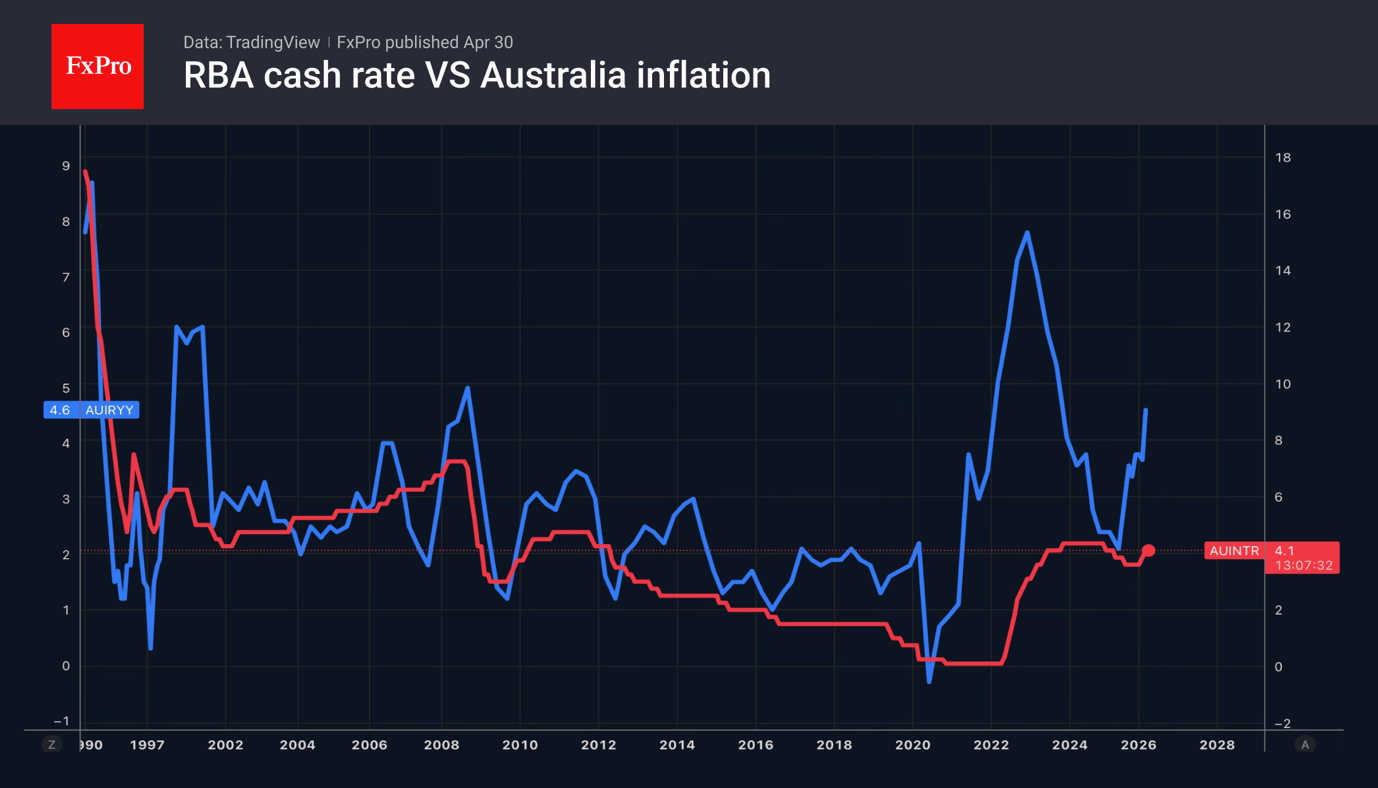
Other key events this week include the Reserve Bank of Australia meeting, where markets are pricing in the risk of another 25-basis point rate hike to 4.35 per cent, which could support AUDUSD. In the US, attention will be on the March trade balance data and the April ISM services figures. Meanwhile, New Zealand will release its first-quarter employment data.
Investors will continue to monitor developments in the Middle East. The current lack of major updates may suggest a period of calm before potential volatility returns. The longer this lasts, the higher the risks of conflict escalation, including a return to hostilities between the US and Iran.
Equities Once Again Buoy Crypto Market, But Ethereum a Cause for Concern
Market Overview
The crypto market capitalisation rose by 1.29% over the past 24 hours to $2.57 trillion, supported by the Nasdaq-100 and S&P 500 indices hitting impressive new all-time highs. Furthermore, the strengthening of the Japanese yen caused the dollar index to fall, lowering the benchmark. The top performers were Zcash (+5%), Dash (+4.8%) and Aptos (+3.4%). The underperformers among the top coins were Theta (−1%), Cosmos (−1.4%) and NEAR (−1.4%).
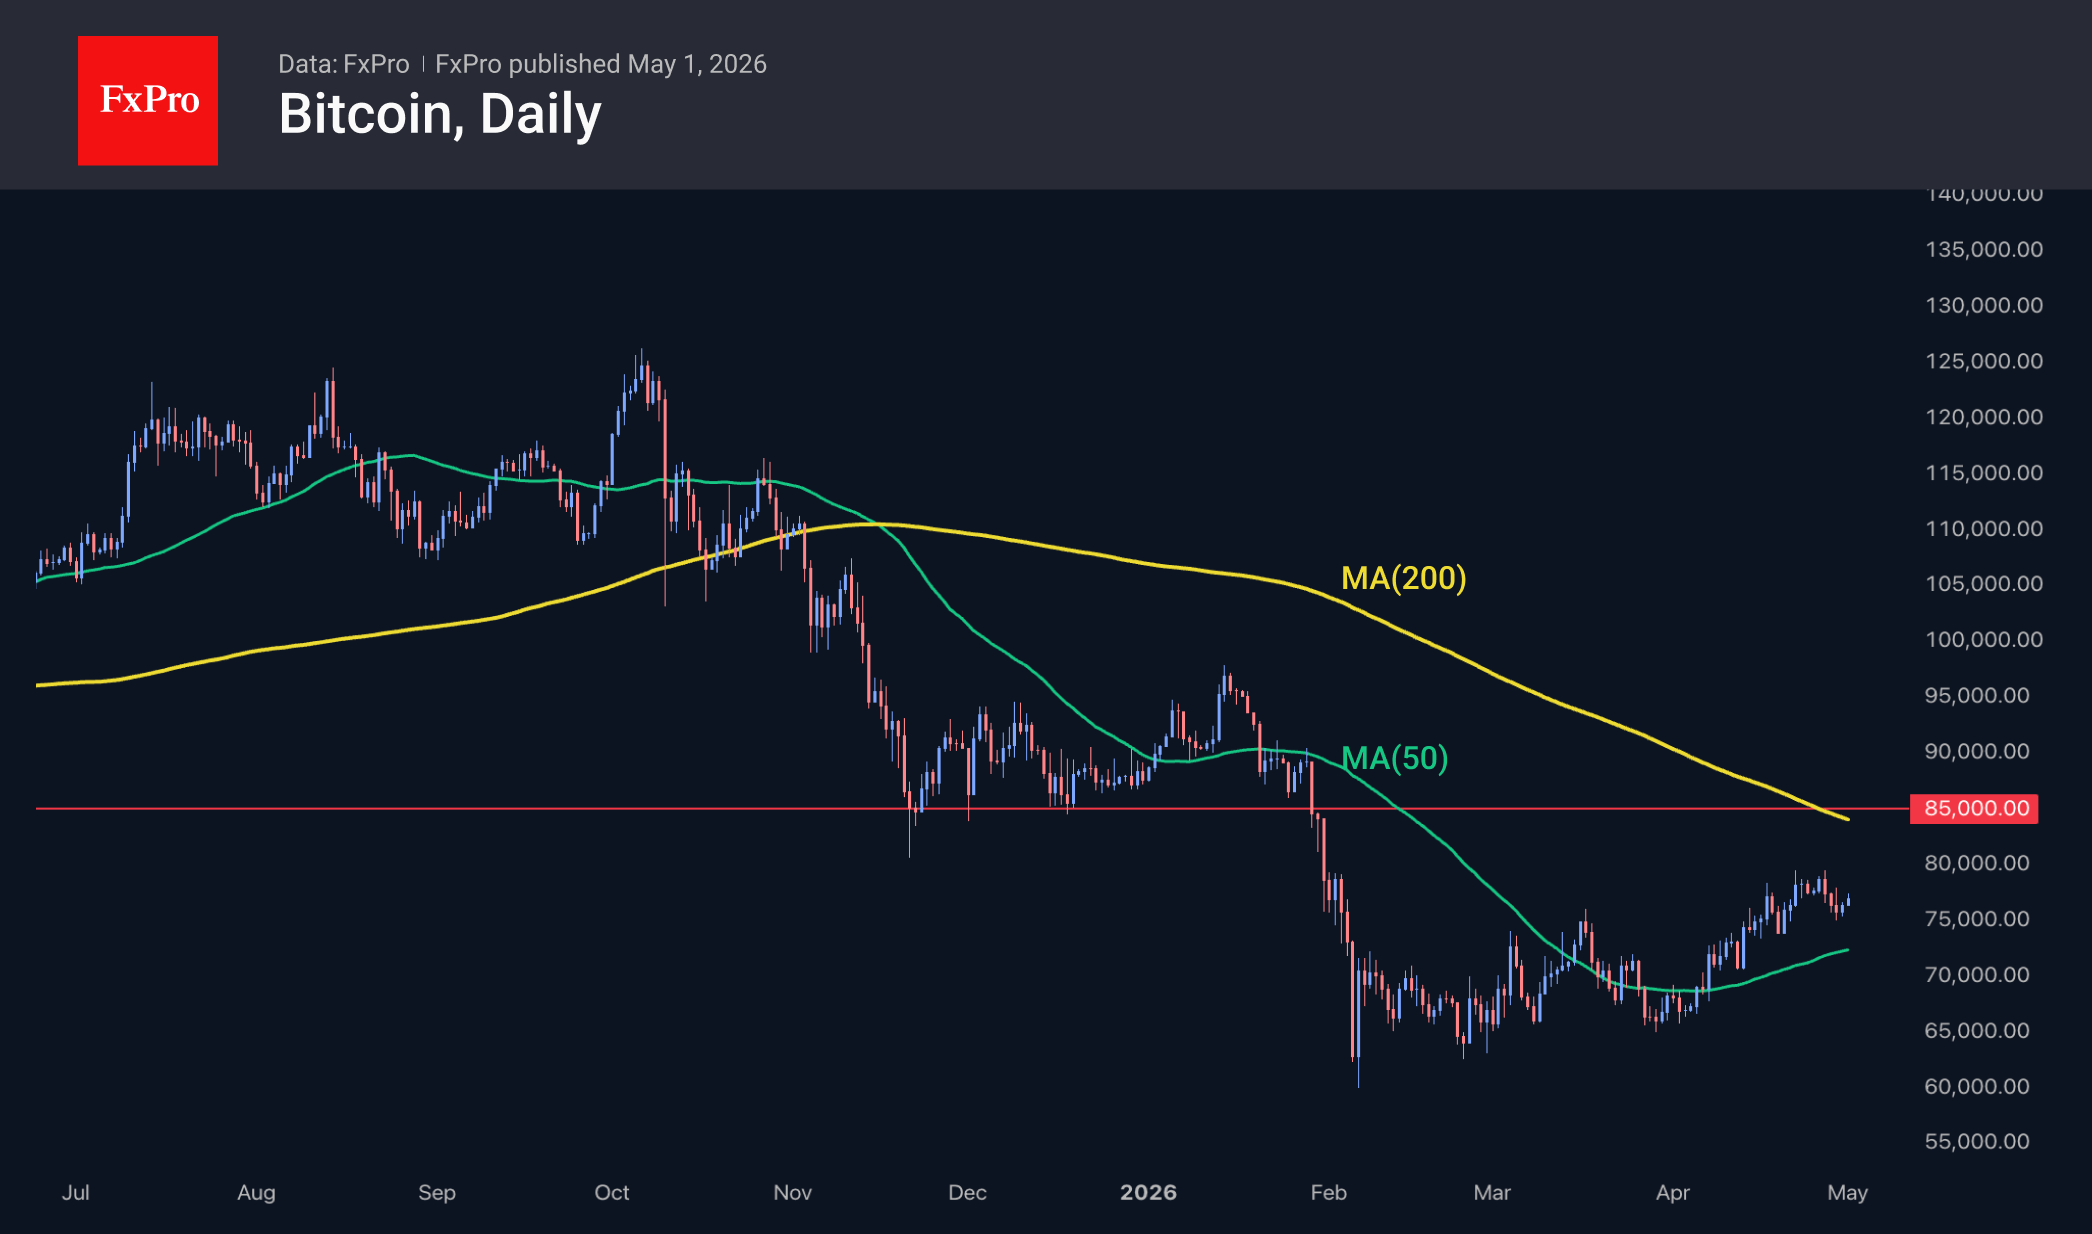
Bitcoin is once again attempting to climb above $77K, having found support from buyers during the dip to $75K. The shakeout of buyer positions proved to be quicker than might have been expected. However, it is too early to speak of bullish dominance until the leading cryptocurrency has confidently broken through the final resistance at $80K, which would open the way to $84K–$85K.
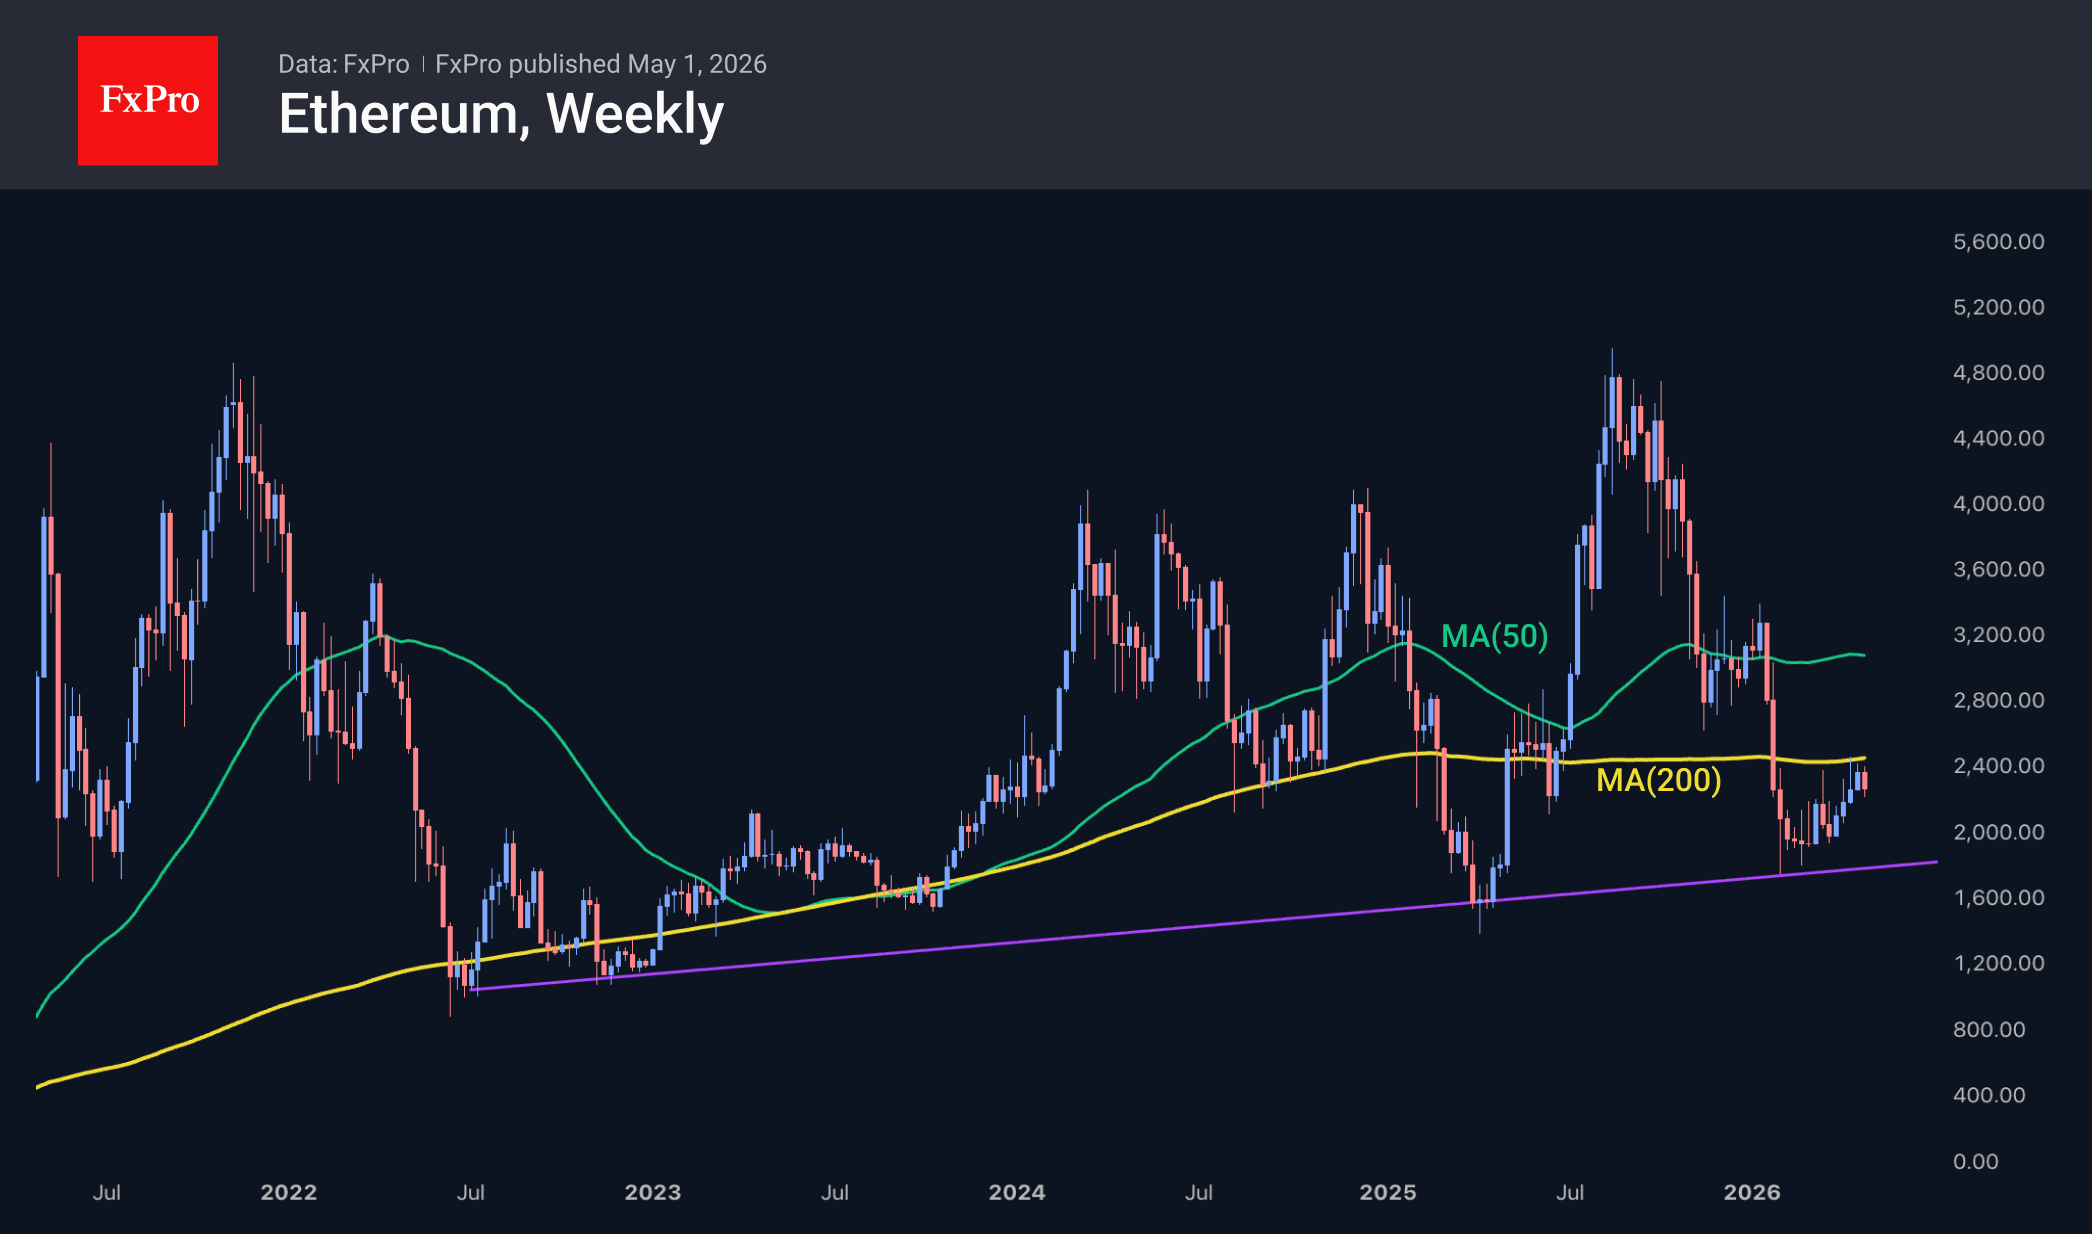
Ethereum is setting a more cautious tone. Over the past three weeks, the price has retreated after touching the 200-week moving average from below, which is an important signal of a bearish market prevailing across this asset and the whole altcoin market. However, the situation is balanced by ETH’s strong rebound at the start of the year from the long-term support line of the uptrend, which runs through the lows of 2022 and 2024.
News Background
Bitcoin rose by 12.2% in April to $76,500, marking its strongest growth in the last 12 months. Before this, in March, BTC showed a slight gain (+2%) following five months of decline.
From a seasonal perspective, May is considered a positive month for BTC. Over the past 15 years, Bitcoin has ended the month with gains on nine occasions and with losses on six. The average gain was 26.5%, while the average loss was 14.5%.
Bitcoin’s growth is being held back by market participants’ positions on the Deribit exchange, notes Bloomberg. Call options expiring in May and June, worth $1.5 billion, are concentrated around the $80K level. In such a situation, market makers are forced to sell the asset as its price rises to hedge their risk.
No fewer than 11 indicators are signalling the best buying opportunity in five years, points out MN Trading founder Michael van de Poppe. The last time the market saw a similar picture was in the fourth quarter of 2022.
Tether’s investment arm has proposed merging three companies to create a leading public organisation in the Bitcoin industry. This involves the merger of Twenty-One Capital (XXI), financial services provider Strike, and mining platform Elektron Energy.
GBP/JPY Daily Outlook
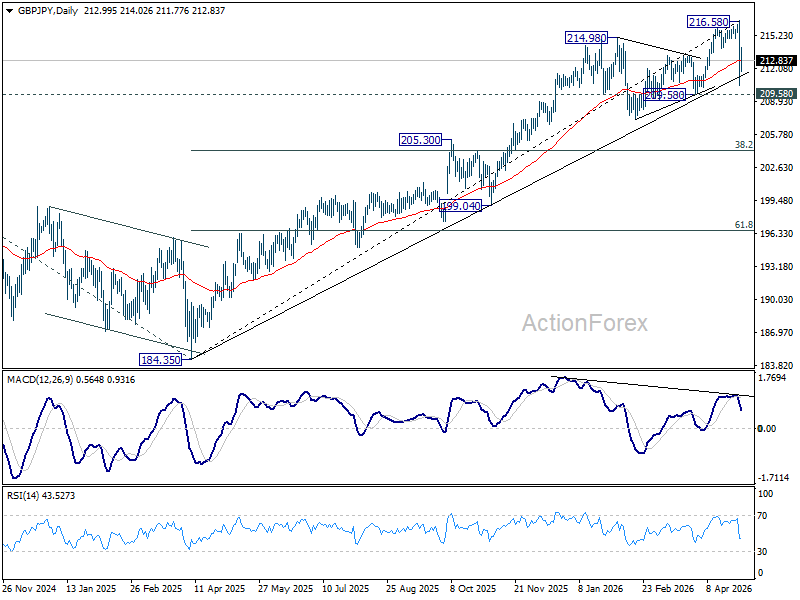
Daily Pivots: (S1) 210.12; (P) 213.40; (R1) 216.33; More...
Fall from 216.58 could still extend lower, but strong support should emerge from 209.58 to bring rebound, at least on first attempt. On the upside, above 214.02 minor resistance will turn intraday bias neutral first. However, firm break of 209.58 will solidify the case that it's already correcting the whole five-wave rally from 184.35. In this case, 38.2% retracement of 184.35 to 216.58 at 204.28 will be the next target.
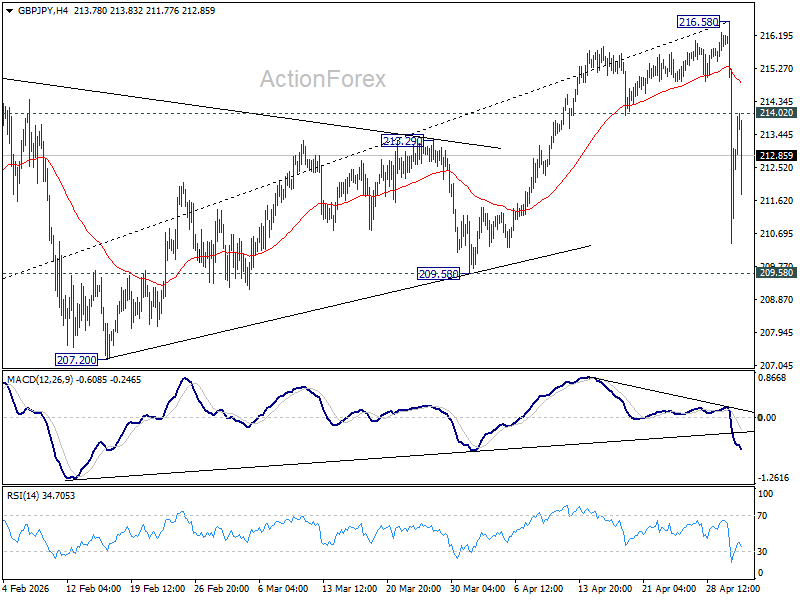
In the bigger picture, while the fall from 216.58 is steep, there is no clear sign of trend reversal yet. The long term up trend could still extend to 61.8% projection of 148.93 (2022 low) to 208.09 (2024 high) from 184.35 at 220.90 on resumption. However, sustained break of 55 W EMA (now at 205.09) will argue that it's already in medium term down trend for 184.35 support.
EUR/JPY Daily Outlook
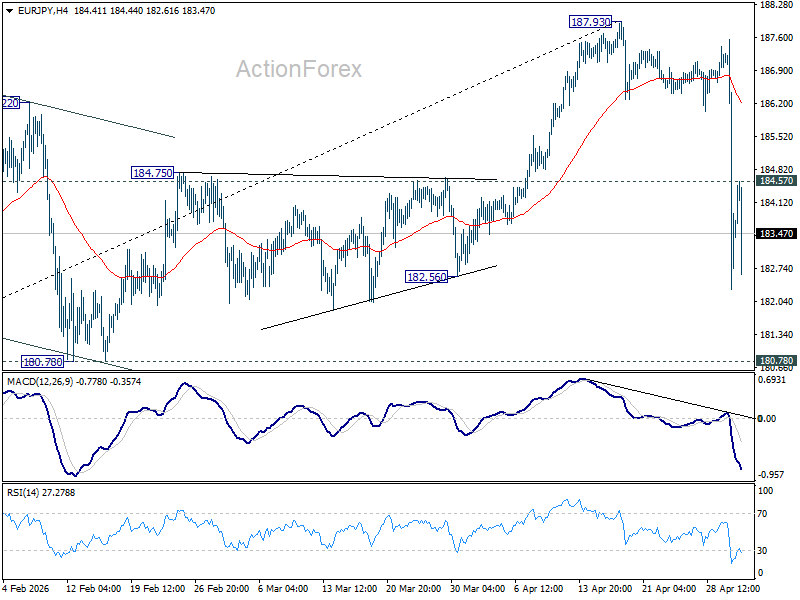
Daily Pivots: (S1) 181.48; (P) 184.53; (R1) 186.77; More...
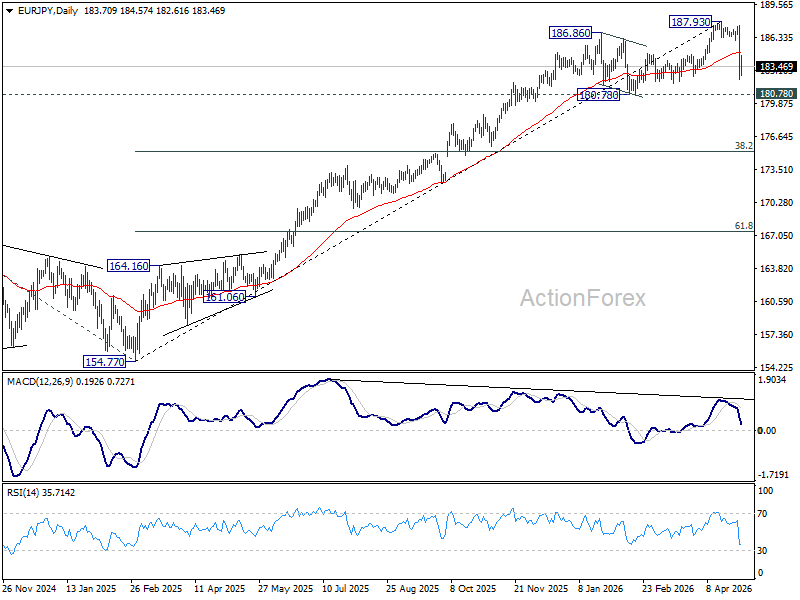
Intraday bias in EUR/JPY remains on the downside, and fall from 187.93 could extend lower to 180.78 support. But strong support should emerge there to bring rebound, at least on first attempt. On the upside, above 184.57 will turn intraday bias neutral first. However, decisive break of 180.78 will argue that it's already correcting whole five-wave impulse from 154.77. Next target will be 38.2% retracement of 154.77 to 187.93 at 175.26.
In the bigger picture, the pullback from 187.93 is steep, there is no sign of reversal yet. Uptrend from 114.42 is still expected to resume at a later stage to 78.6% projection of 124.37 (2022 low) to 175.41 (2025 high) from 154.77 at 194.88. However, sustained break of 55 W EMA (now at 177.50) will argue that it's already in a medium term down trend to 175.41 resistance turned support and below.
EUR/GBP Daily Outlook
Daily Pivots: (S1) 0.8608; (P) 0.8639; (R1) 0.8656; More…
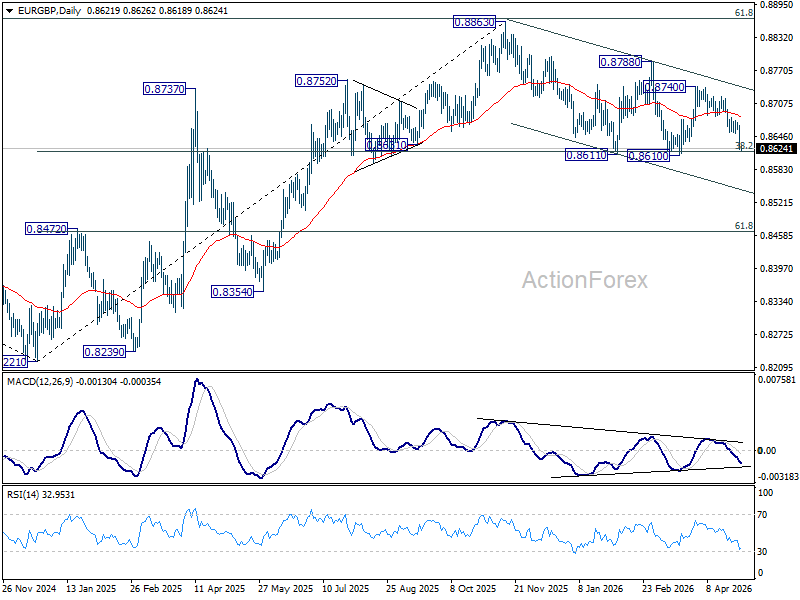
EUR/GBP's fall from 0.8740 resumed and accelerated after breaking through 0.8652. Intraday bias is back on the downside fro 0.8610 key support. Decisive break there will carry larger bearish implications and pave the way to 0.8466 fibonacci level next. On the upside, above 0.8652 support turned resistance will turn intraday bias neutral again first.
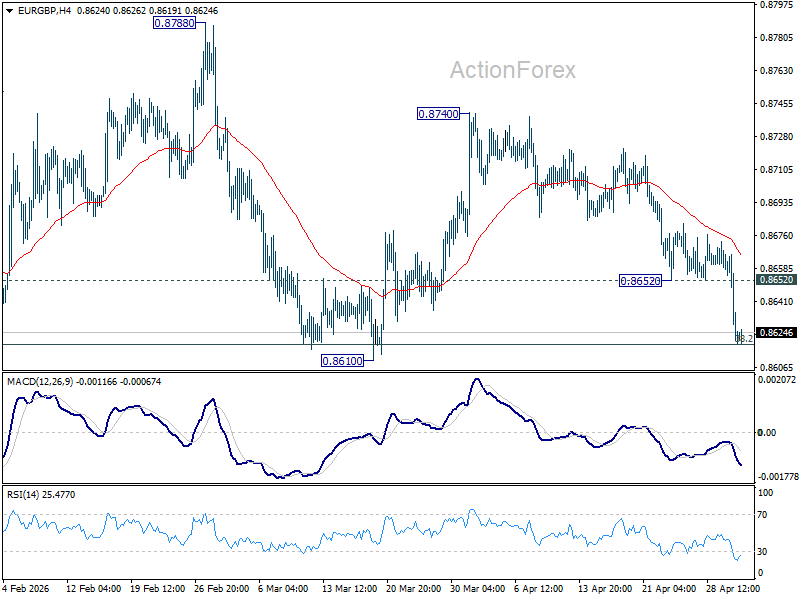
In the bigger picture, focus is back on 38.2% retracement of 0.8821 to 0.8863 at 0.8618. Sustained break there will confirm that whole rise from 0.8221 has completed at 0.8863. Deeper decline should then be seen to 61.8% retracement at 0.8466 at least. For now, risk will stay mildly on the downside as long as 55 D EMA (now at 0.8682) holds, in case of recovery.
EUR/AUD Daily Outlook
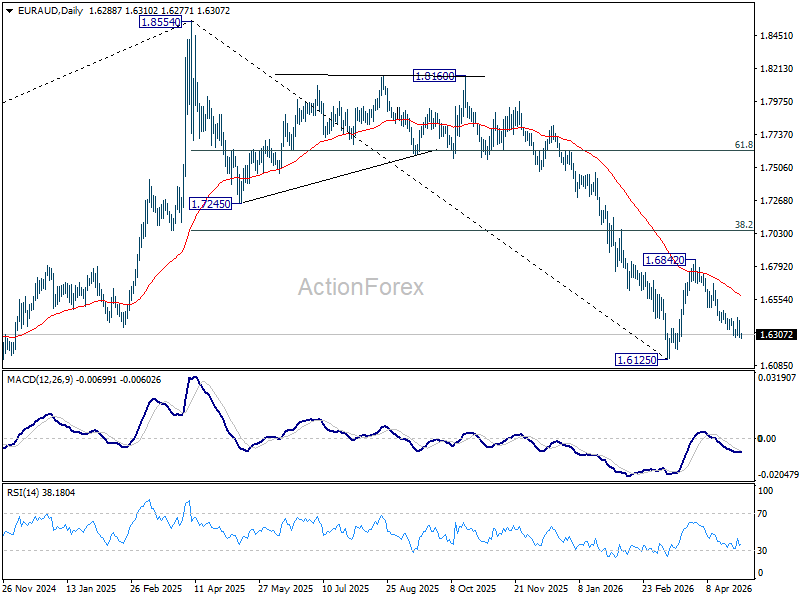
Daily Pivots: (S1) 1.6245; (P) 1.6334; (R1) 1.6381; More...
EUR/AUD's fall from 1.6482 resumed after brief recovery. Intraday bias is back on the downside for retesting 1.6126 low. Decisive break there will resume larger down trend from 1.8554. On the upside, break of 1.6423 resistance will turn bias back to the upside for stronger rebound.
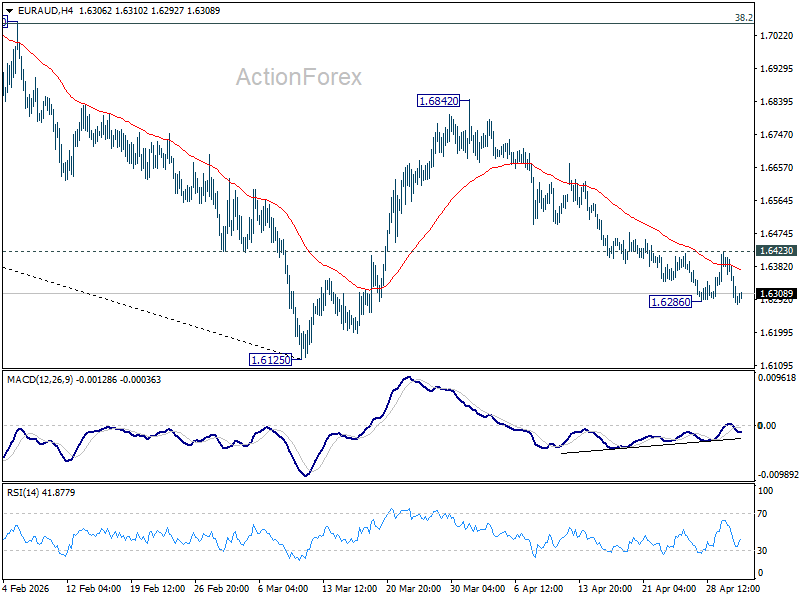
In the bigger picture, fall from 1.8554 (2025 high) is in progress and deeper decline should be seen to 61.8% retracement of 1.4281 to 1.8554 at 1.5913, which is slightly below 1.5963 structural support. Decisive break there will pave the way back to 1.4281 (2022 low). For now, risk will stay on the downside as long as 55 W EMA (now at 1.7129) holds, even in case of strong rebound.