

Sample Category Title
Fed’s Kashkari, Hammack and Logan Reject Easing Bias, Say Next Move Could Be Hike or Cut
Federal Reserve dissenters pushed back forcefully against the central bank’s perceived easing bias, signaling growing uncertainty over the policy path just days after the April 29 meeting. Minneapolis Fed President Neel Kashkari said current guidance is widely interpreted as pointing to a rate cut, but argued the Fed should instead make clear that “the next rate change could be either a cut or a hike, depending on how the economy evolves.”
Kashkari was joined by Cleveland Fed President Beth Hammack and Dallas Fed President Lorie Logan, all of whom supported holding rates steady last week but objected to language implying further easing.
Hammack described the wording as a “clear easing bias” that is “no longer appropriate given the outlook,” while Logan warned that forward guidance should reflect “two-sided risks” rather than signaling a directional lean toward cuts.
The pushback highlights a widening divide within the Fed as policymakers reassess the impact of the Middle East conflict and its implications for inflation. While the statement retained flexibility by referring to “additional adjustments,” dissenters argue markets are interpreting it as a continuation of the easing cycle, potentially loosening financial conditions prematurely.
Bitcoin Wave Analysis
Bitcoin: ⬆️ Buy
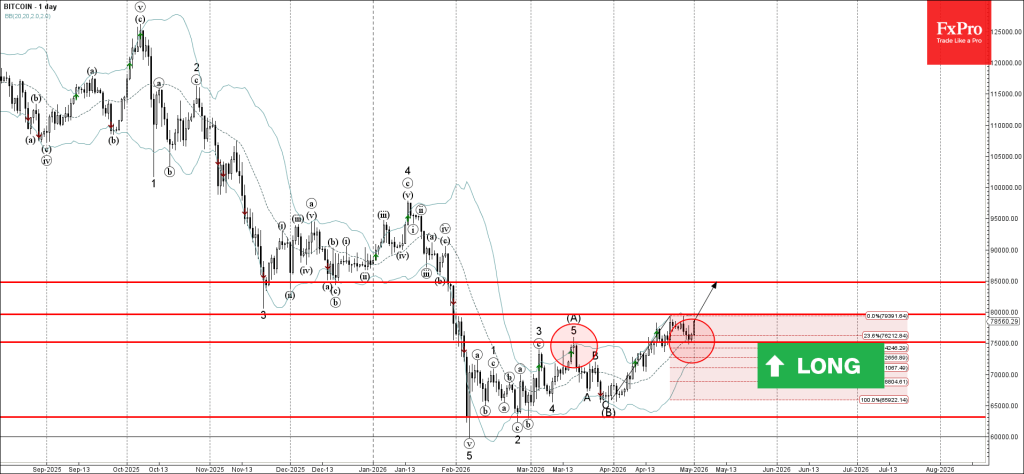
- Bitcoin reversed from support level 75000.00
- Likely to rise to resistance level 80000.00
Bitcoin cryptocurrency recently reversed up from the support level 75000.00 (former strong resistance from March), intersecting with the 20-day moving average and the 38.2% Fibonacci correction of the sharp upward impulse from March.
The upward reversal from the support level 75000.00 continues the active sharp intermediate impulse wave (C) from March. Given the bullish sentiment seen across the crypto markets, Bitcoin cryptocurrency can be expected to rise to the resistance level 80000.00 – the breakout of which can lead to further gains toward to the next resistance level 85000.00.
Eco Data 5/4/26
| GMT | Ccy | Events | Act | Cons | Prev | Rev |
|---|---|---|---|---|---|---|
| 01:00 | AUD | TD-MI Inflation Gauge M/M Apr | 0.60% | 1.30% | ||
| 07:30 | CHF | Manufacturing PMI Apr | 54.5 | 51.9 | 53.3 | |
| 07:50 | EUR | France Manufacturing PMI Apr F | 52.8 | 52.8 | 52.8 | |
| 07:55 | EUR | Germany Manufacturing PMI Apr F | 51.4 | 51.2 | 51.2 | |
| 08:00 | EUR | Eurozone Manufacturing PMI Apr F | 52.2 | 52.2 | 52.2 | |
| 08:30 | EUR | Eurozone Sentix Investor Confidence May | -16.4 | -20.5 | -19.2 | |
| 14:00 | USD | Factory Orders M/M Mar | 1.50% | 0.40% | 0.00% |
| 01:00 | AUD |
| TD-MI Inflation Gauge M/M Apr | |
| Actual | 0.60% |
| Consensus | |
| Previous | 1.30% |
| 07:30 | CHF |
| Manufacturing PMI Apr | |
| Actual | 54.5 |
| Consensus | 51.9 |
| Previous | 53.3 |
| 07:50 | EUR |
| France Manufacturing PMI Apr F | |
| Actual | 52.8 |
| Consensus | 52.8 |
| Previous | 52.8 |
| 07:55 | EUR |
| Germany Manufacturing PMI Apr F | |
| Actual | 51.4 |
| Consensus | 51.2 |
| Previous | 51.2 |
| 08:00 | EUR |
| Eurozone Manufacturing PMI Apr F | |
| Actual | 52.2 |
| Consensus | 52.2 |
| Previous | 52.2 |
| 08:30 | EUR |
| Eurozone Sentix Investor Confidence May | |
| Actual | -16.4 |
| Consensus | -20.5 |
| Previous | -19.2 |
| 14:00 | USD |
| Factory Orders M/M Mar | |
| Actual | 1.50% |
| Consensus | 0.40% |
| Previous | 0.00% |
Dollar on Thin Ice as Three Forces Hit: Risk Rally, Central Bank Divergence, Yen Shock
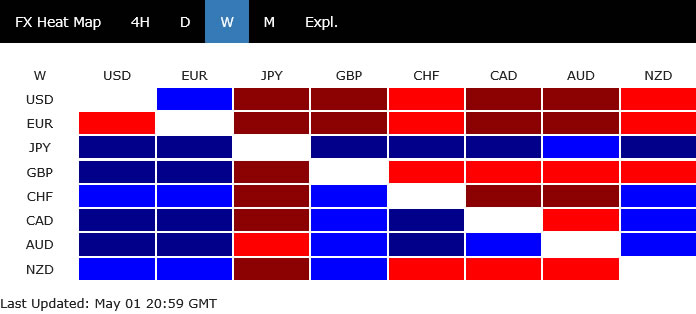
Dollar’s broader weakness reasserted itself last week, even as it managed a modest late rebound against Euro. Across the board, however, the greenback remains under pressure, with underlying momentum and sentiment pointing to further downside ahead. Technically and fundamentally, Dollar is now skating on thin ice, with recent price action suggesting the near-term rebound has already run its course.
The weakness is not driven by a single catalyst but rather a convergence of forces that are reshaping global markets. Strong risk-on sentiment has reduced demand for safe-haven assets. At the same time, shifting central bank dynamics are eroding Dollar’s advantage. Adding to these, a sharp and unexpected reversal in Japanese Yen has acted as a powerful trigger, accelerating repositioning and amplifying downside pressure on the greenback.
Taken together, these three drivers—equity market strength, policy divergence, and Yen intervention—are creating a powerful combination. What stands out is not just the presence of these factors, but their alignment.
AI-Led Earnings Surge Drives Risk Rally to Record Highs
Risk-on sentiment was the dominant force in markets last week, with US equities extending their rally to fresh record highs. Both S&P 500 and NASDAQ closed the week strongly, capping what turned out to be their best monthly performances since 2020. Even the more cyclical DOW posted its strongest gain since November 2024, underscoring the breadth of the move.
The rally was driven by a powerful earnings season that decisively beat expectations. Analysts had entered the quarter concerned that elevated interest rates and rising energy costs would compress corporate margins. Instead, results showed that companies have been able to maintain pricing power and manage costs effectively, reinforcing confidence in the resilience of the US economy.
Technology stocks, particularly those linked to artificial intelligence, remained at the center of the advance. Alphabet and Microsoft delivered strong results, highlighting that massive investments in AI are now translating into tangible revenue growth. Cloud and enterprise services showed particularly strong momentum, confirming that the AI theme is evolving beyond early-stage infrastructure spending into real-world implementation and monetization.
Perhaps most importantly, this equity strength persisted despite ongoing geopolitical tensions. Markets largely shrugged off the risks surrounding the Middle East conflict, with traders appearing increasingly desensitized to headlines. Instead, the focus remained firmly on growth prospects and earnings momentum. As long as this dynamic holds, risk appetite is likely to stay elevated, continuing to weigh on the Dollar and shape broader market direction.
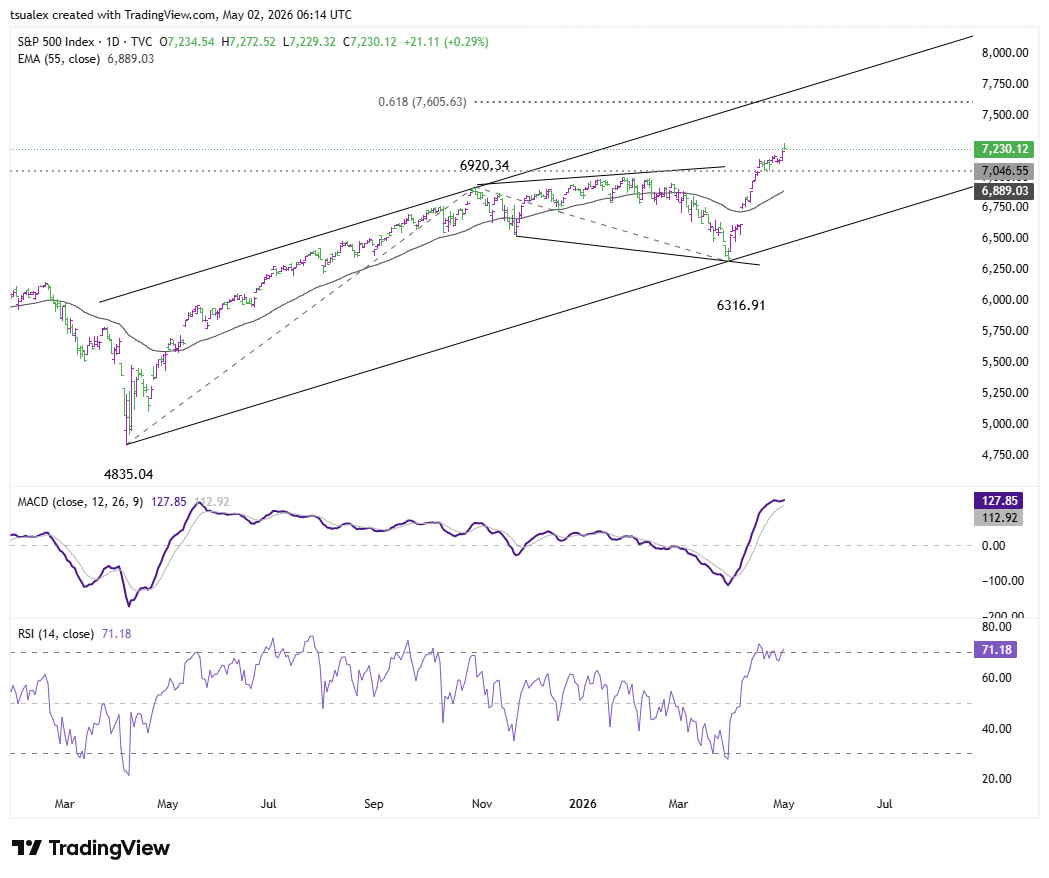
Technically, the long term up trend in equities remains firmly intact, with both S&P 500 and NASDAQ maintaining strong bullish structures. The recent breakout to record highs reinforces the view that the current uptrend is not yet exhausted, especially as pullbacks remain shallow and well-supported.
For S&P 500, near-term outlook stays bullish as long as 7,046.55 support holds. The next upside target is 61.8% projection of 4,835.04 to 6,902.34 from 6,316.91 at 7,605.63 .
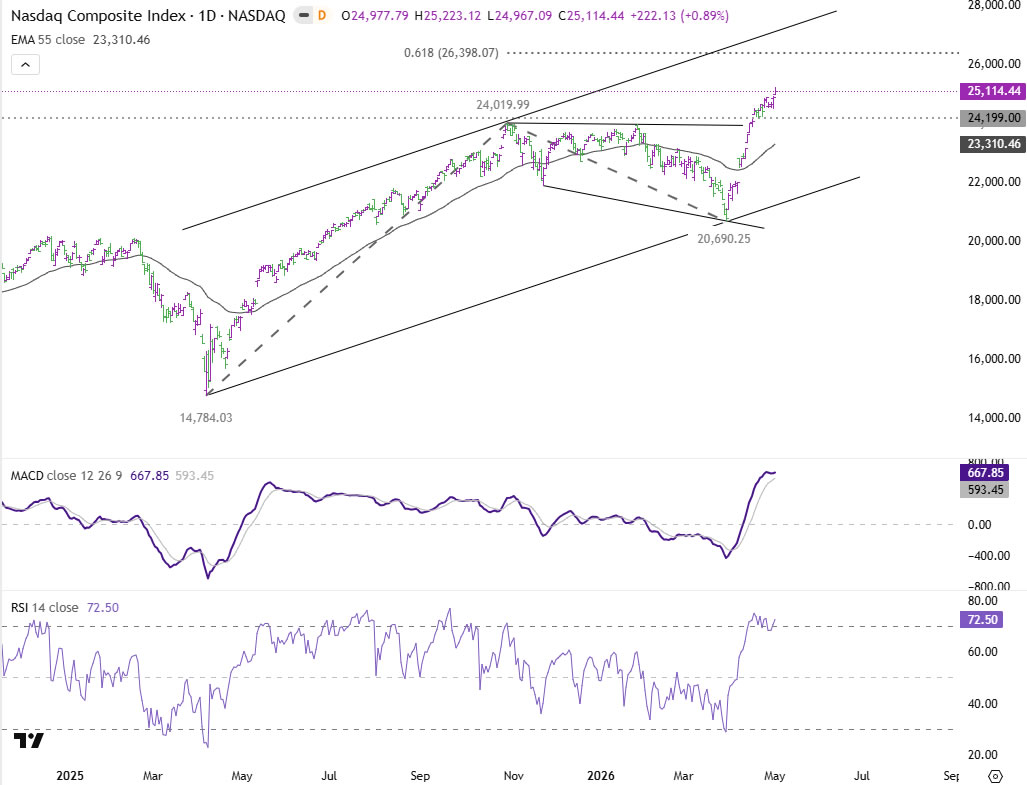
A similar structure is seen in NASDAQ. As long as 24,199.00 support holds, the current uptrend is expected to extend toward 61.8% projection of 14,784.03 to 24,019.99 from 20,690.25 at 26,398.07.
Hawkish Convergence Outside Fed Pressures Dollar
A key driver behind Dollar weakness last week was the shifting outlook of global monetary policy.
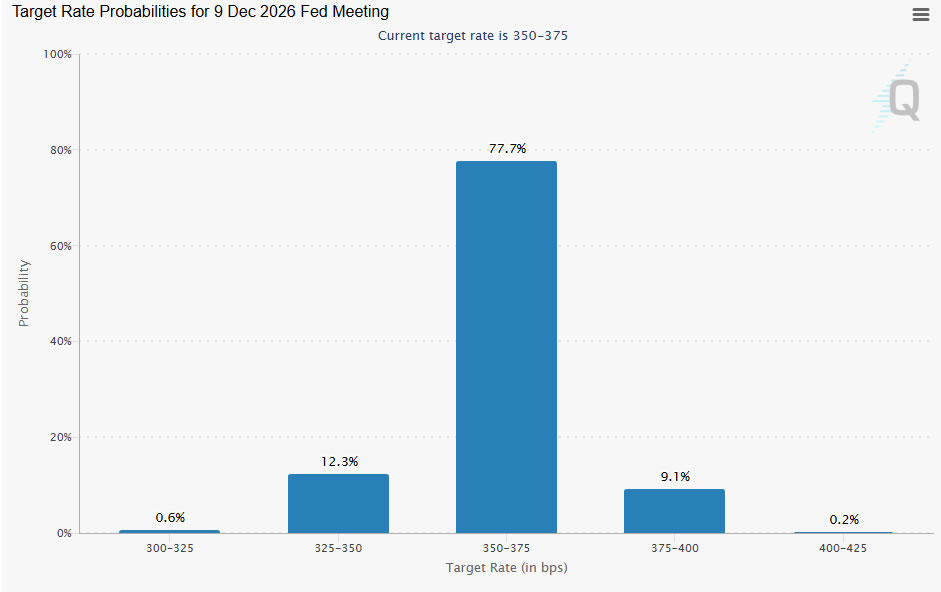
For the Federal Reserve, the decision to hold rates at 3.50%–3.75% was widely expected, but the internal dynamics were anything but calm. The meeting saw four dissents—the highest since 1992—with three regional presidents (Hammack, Kashkari, and Logan) opposing the inclusion of an easing bias in the statement. This reflects growing concern within the Committee that inflation risks remain elevated and that policy may not yet be restrictive enough.
Despite this hawkish dissent, the broader message from the Fed remains one of patience. With rates mildly restrictive at 3.50-3.75%, there is no urgency to tighten further. Market pricing reflects this balance, with around a 77% probability that rates will remain unchanged through year-end. Expectations for a rate cut have dropped sharply to roughly 12%. The Fed is no longer the most hawkish player—only that it is also not ready to ease.
The Bank of England, by contrast, is tilting more clearly toward tightening. The April 30 decision to hold at 3.75% came with an 8–1 vote split, with Chief Economist Huw Pill dissenting in favor of an immediate 25bps hike. His position highlights growing concern about persistent inflation, particularly from energy-driven cost pressures and the risk of second-round effects.
Markets have taken this signal seriously. Pricing for a June rate hike has settled around 60%, after jumping to 70% just after the rate announcement. Total tightening expectations stand at roughly 65bps for the year. Even as the BoE acknowledges fragile growth conditions, the bias is shifting toward further tightening,.
The European Central Bank is also moving closer to action. While it held its deposit rate at 2.00%, President Christine Lagarde’s neutral tone was quickly overshadowed by reports that policymakers are preparing for a June hike if energy prices remain elevated. The ECB is seen as “patiently waiting” rather than firmly on hold.
This shift is being driven by inflation dynamics. The jump in April CPI to 3.0%, combined with Lagarde’s acknowledgment that the Eurozone is moving toward the “adverse scenario,” has pushed markets to price in a 90% probability of a June hike. Expectations now extend to three 25bps increases by the end of 2026, targeting a terminal rate of 2.75%.
Perhaps the most dramatic shift is taking place in Japan. The Bank of Japan’s 6–3 vote on April 28 marked a significant departure from its historically unified stance. The three dissenters—Nakagawa, Takata, and Tamura—pushed for an immediate hike to 1.00%, arguing that the central bank risks falling behind the curve as inflation pressures build.
This internal split was reinforced by a sharp upward revision in the 2026 inflation forecast to 2.8%, a level well above the traditional target range. Market expectations have adjusted rapidly, with the probability of a June rate hike rising to around 74%. July remains a fallback option, particularly if geopolitical risks intensify and threaten growth.
Taken together, these developments highlight a clear convergence in global policy tightening. While the Fed remains on hold, others are catching up or even overtaking in terms of hawkish bias. This narrowing of rate differentials is a key structural driver of Dollar weakness, and unless the Fed reasserts its leadership, the pressure on the greenback is likely to persist.
Intervention Shock Triggers Yen Surge
The most dramatic development in FX markets last week was the sudden and forceful reversal in Japanese Yen. After USD/JPY breached the critical 160 "red line", Japanese authorities drew a clear line in the sand. What followed was a sharp and aggressive move that caught markets off guard and triggered a broad reassessment of positioning.
Intervention appears to have been decisive. Estimates suggest that more than USD 30 billion was deployed across April 30 and May 1, with reports from Nikkei citing Bank of Japan data indicating roughly JPY5 trillion (USD 32 billion) in Yen-buying operations. The scale of the move underlines the authorities’ determination to halt speculative excess and restore stability to the currency.
The impact was immediate and far-reaching. Yen surged around 2.2%, driving USD/JPY down toward the 156 area. More importantly, the move forced a rapid unwind of crowded carry trades, amplifying the effect beyond the Yen itself. Dollar, already under pressure from other factors, faced additional downside as positions were liquidated across the board.
This episode was not just about price action—it was a warning shot. The intervention effectively reintroduced two-way risk into what had become a one-sided market. Traders who had been comfortable pushing USD/JPY higher were forced to reassess, and opportunistic buying of Yen emerged as markets began to test how far authorities are willing to defend the currency.
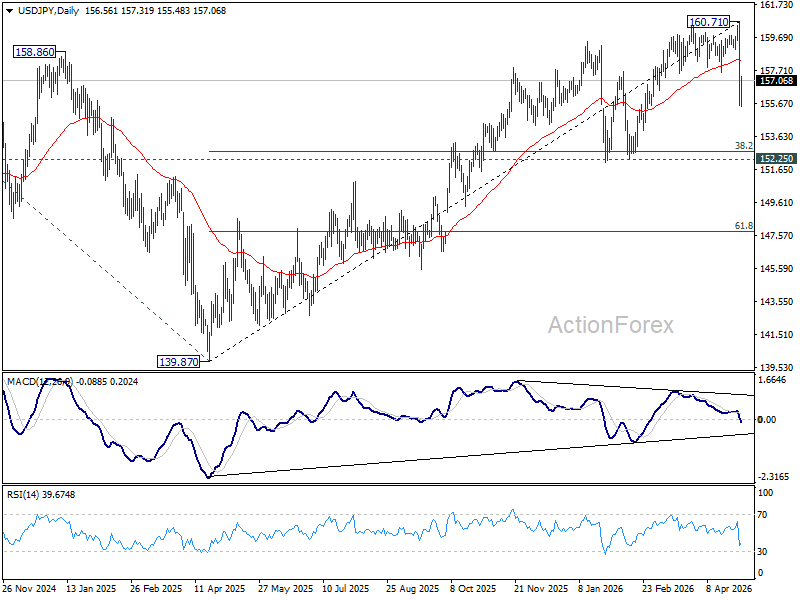
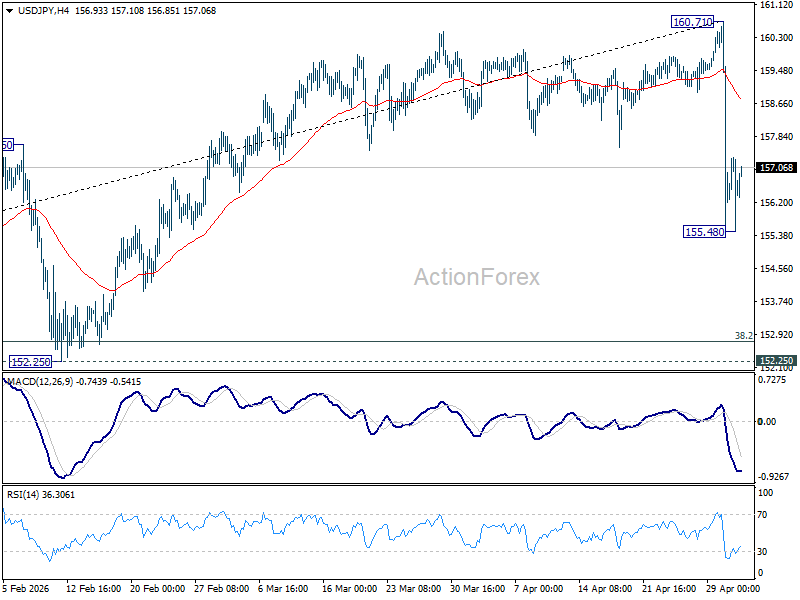
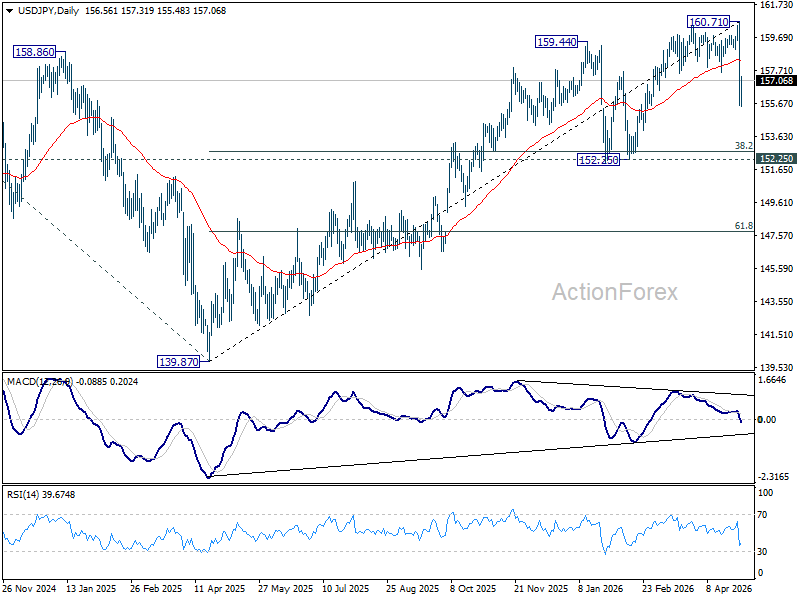
Technically, the sharp fall from 160.71 suggests that a medium-term top should have been formed, reinforced by bearish divergence on D MACD. Nevertheless, the subsequent decline is now viewed as a correction of the broader uptrend from 139.87, rather than a full reversal—at least for now.
Near-term risks point to a deeper pullback toward the 152.25–152.74 cluster support zone (38.2% retracement of 139.87 to 160.71 at 152.74). . Strong support is expected in this area, which should contain downside and allow for a rebound. In the meantime, USD/JPY is likely to consolidate within a broad 152–160 range, with future direction dependent on both policy developments and global risk dynamics.
DXY Bearish Bias Remains Intact for Retesting 95.55 Low
Dollar Index’s recovery last week did little to alter the broader bearish outlook. The rebound from 95.55 should have completed at 100.64, falling short of 38.2% retracement of 110.17 to 95.55 at 101.13. This failure to sustain gains reinforces the view that the move higher was corrective rather than the start of a new trend.
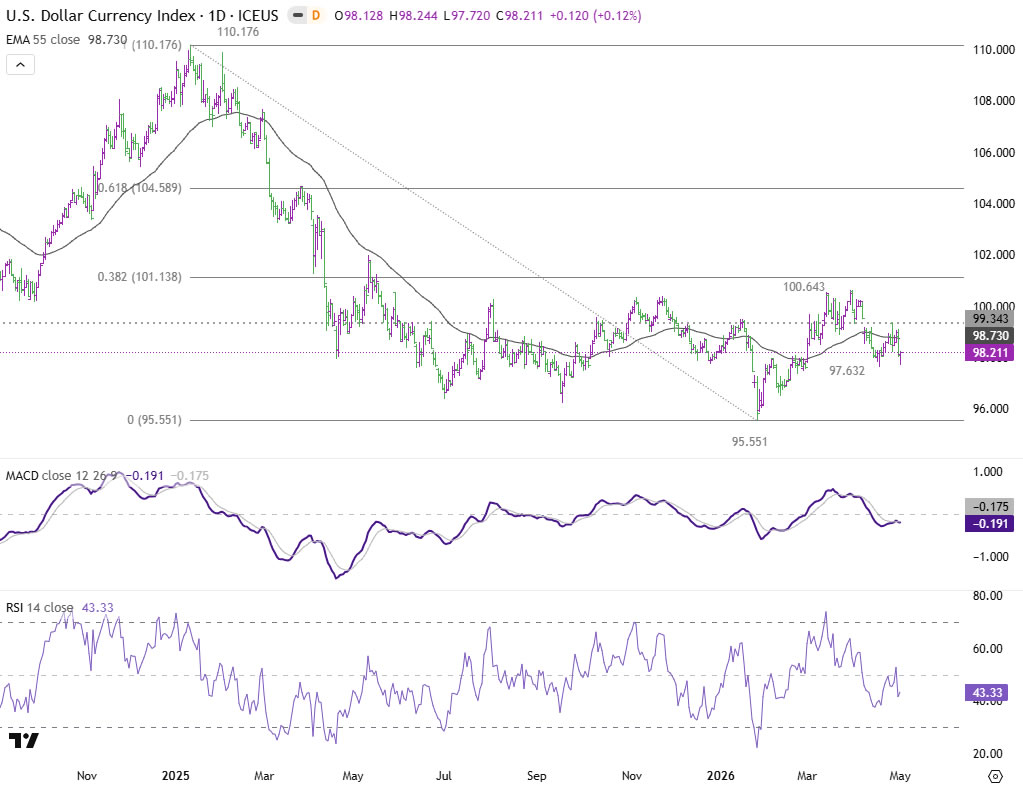
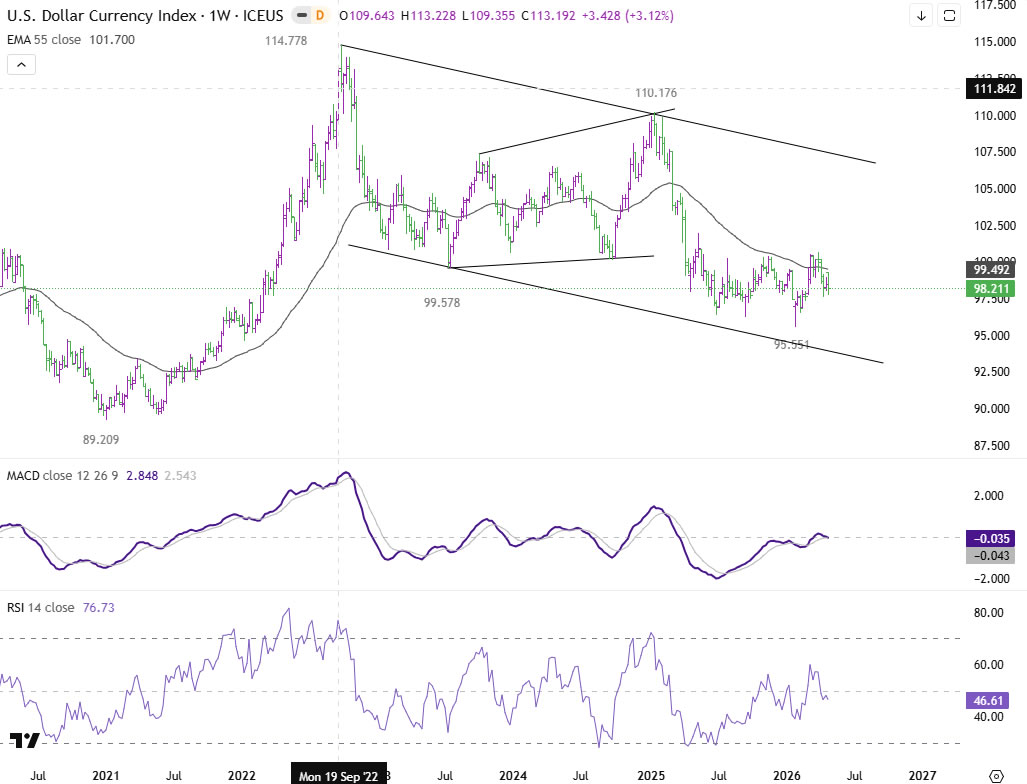
The rejection at key technical levels adds weight to this interpretation. Notably, DXY was turned back below both the 101.13 Fibonacci resistance and 55 W EMA, currently around 99.49. These levels have acted as a firm ceiling, keeping the medium-term bias tilted to the downside and signaling that sellers remain in control.
In the near term, the focus shifts to 97.63 support. Decisive break below this level would confirm the resumption of the decline from 100.64 and open the way for a retest of 95.55 low.
That said, downside momentum has not yet fully accelerated. While the bias remains bearish, the current pace of decline does not yet signal an imminent breakdown. Markets may require additional catalysts—such as further policy divergence or sustained risk-on flows—to trigger a more decisive decline through 95.55.
USD/CAD Weekly Outlook
USD/CAD's fall from 1.3965 continued last week after brief recovery. Initial bias stays on the downside this week for retesting 1.3480 low. Decisive break there will resume whole down trend from 1.4791. For now, risk will remain on the downside as long as 1.3709 resistance holds, in case of recovery.
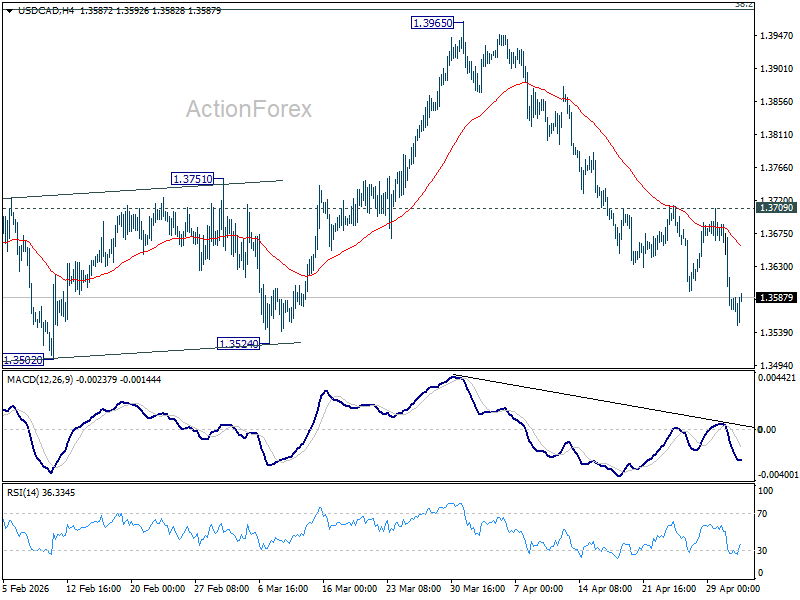
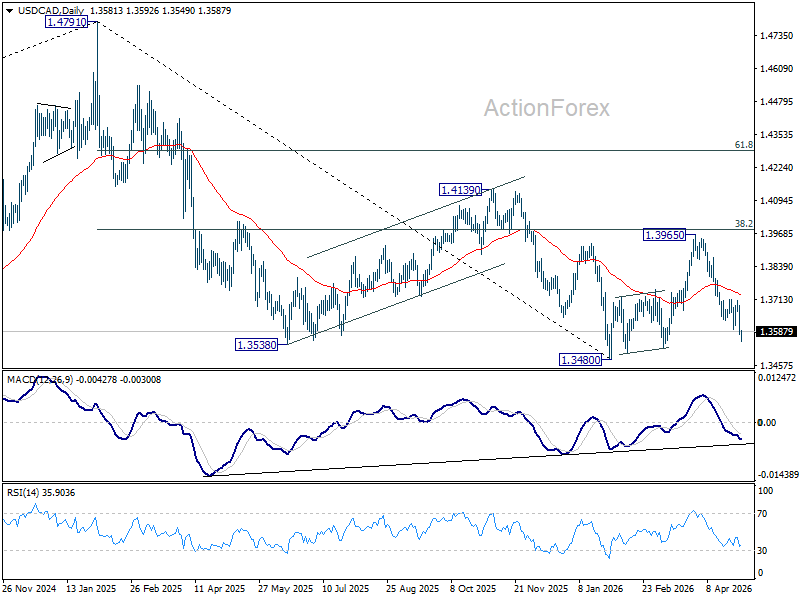
In the bigger picture, price actions from 1.4791 are seen as a corrective pattern to the whole up trend from 1.2005 (2021 low). Deeper fall could be seen, as the pattern extends, to 61.8% retracement of 1.2005 to 1.4791 at 1.3069. However, decisive break of 38.2% retracement of 1.4791 to 1.3480 at 1.3981 will argue that the correction has completed with three waves down to 1.3480 already.
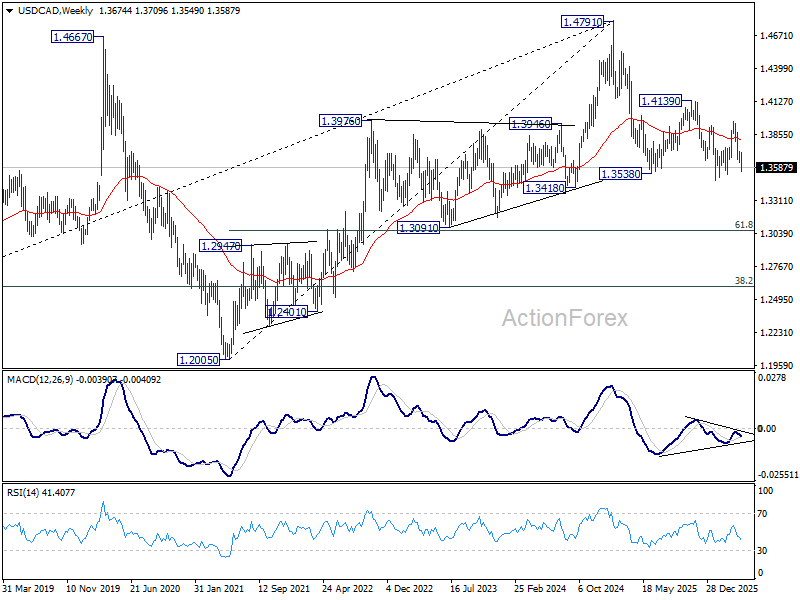
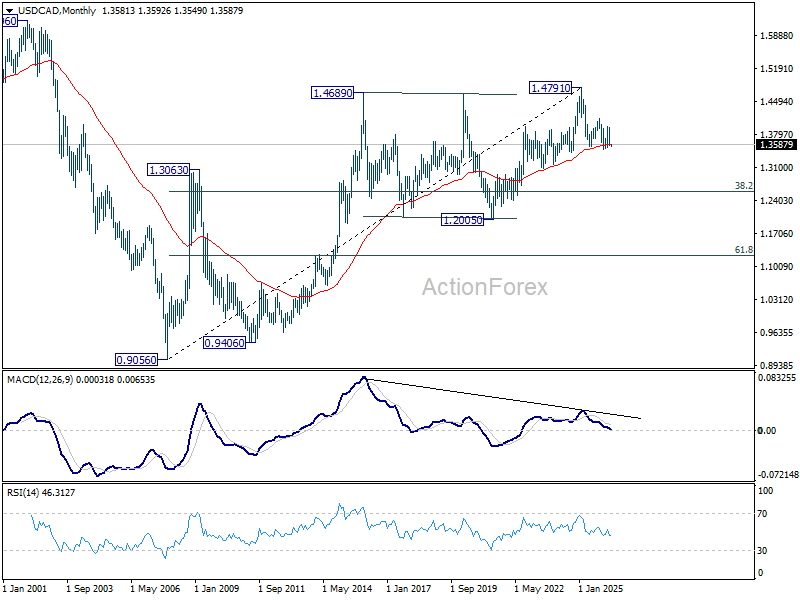
In the long term picture, rising 55 M EMA (now at 1.3581) remains intact. Thus, up trend from 0.9056 (2007 low) could still be in progress. However, considering bearish divergence condition M MACD, sustained trading below 55 M EMA will argue that the up trend has completed with five waves up to 1.4791, and turn medium term outlook bearish for correction to 38.2% retracement of 0.9056 to 1.4791 at 1.2600.
EUR/USD Weekly Outlook
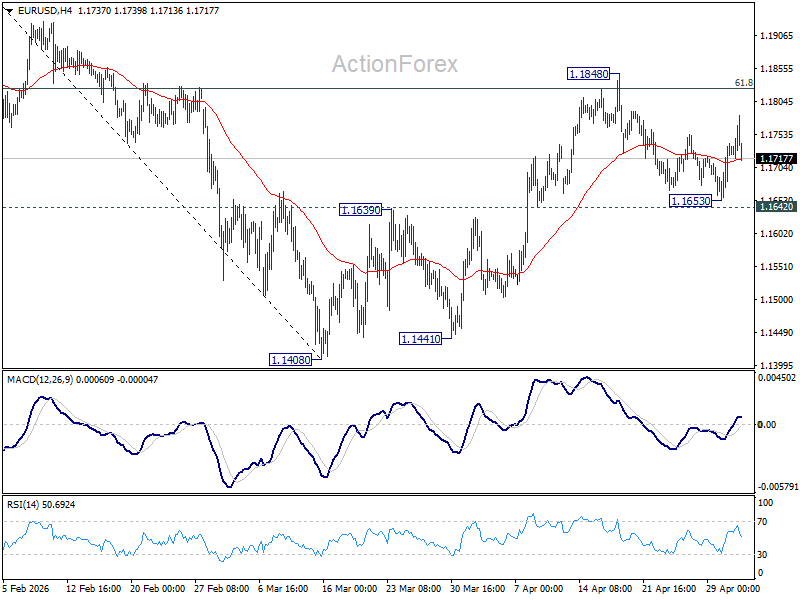
EUR/USD rebounded after initial dip to 1.1653 last week, but stayed in range below 1.1848. Initial bias remains neutral this week first. Rise from 1.1408 is extended to continue as long as 1.1642 support holds. Firm break of 1.1848 will target 1.2081 high next. However, firm break of 1.1662 support will indicate the the rebound from 1.1408 has completed, and bring deeper decline back towards this low instead.
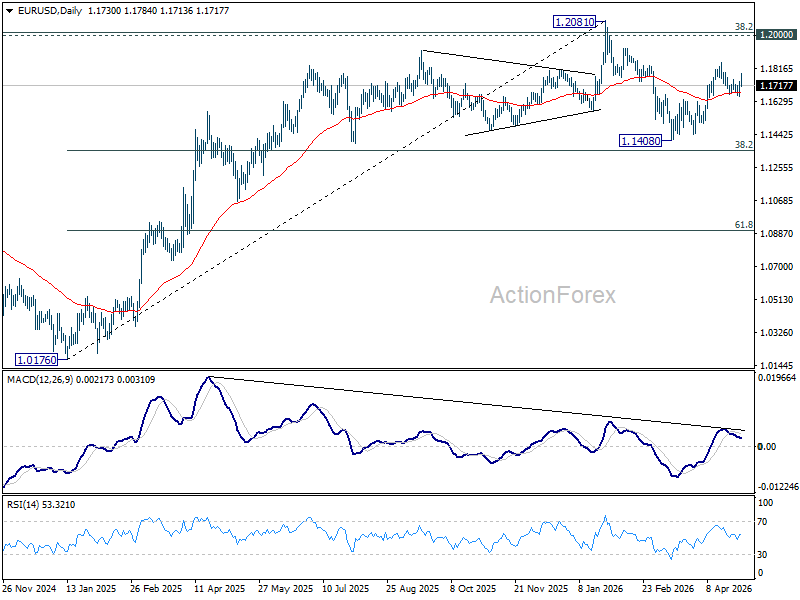
In the bigger picture, the strong support from 38.2% retracement of 1.0176 to 1.2081 at 1.1353 suggests that the pullback from 1.2081 is more likely a corrective move. Strong support was also found in 55 W EMA (now at 1.1523). Focus is back on 1.2 key cluster resistance level. Decisive break there will carry long term bullish implications. Nevertheless, break of 1.1408 support will revive the case of medium term bearish trend reversal.
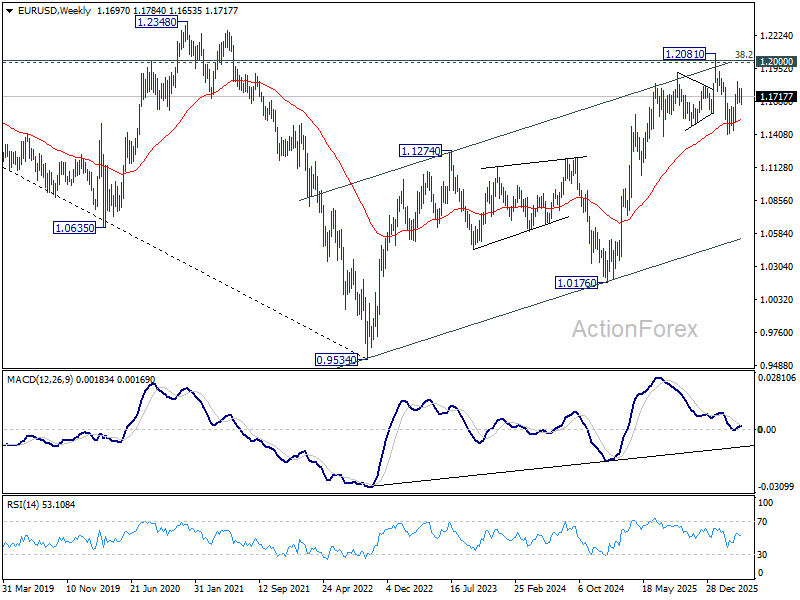
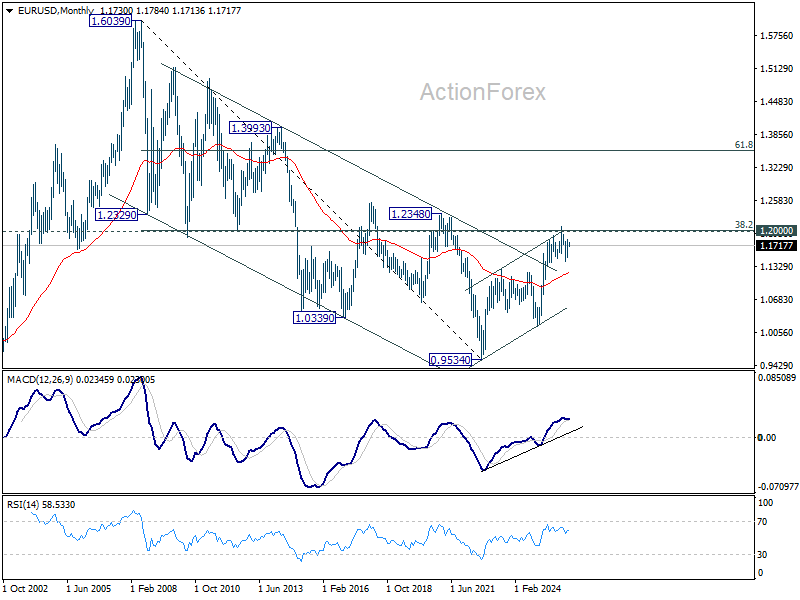
In the long term picture, 38.2% retracement of 1.6039 to 0.9534 at 1.2019, which is close to 1.2000 psychological level is the key for the outlook. Rejection by this level will keep the multi decade down trend from 1.6039 (2008 high) intact, and keep outlook neutral at best. However, decisive break of 1.2000/19, will suggest long term bullish trend reversal, and target 61.8% retracement at 1.3554.
USD/JPY Weekly Outlook
USD/JPY's steep decline last week indicates medium term topping at 160.71, on bearish divergence condition in D MACD. But as a temporary low should be formed at 155.48, initial bias is turned neutral this week first. Risk will stay on the downside as long as 55 4H EMA (now at 158.81) holds. Below 155.48 will target 152.25 cluster support (38.2% retracement of 139.87 to 160.71 at 152.74).
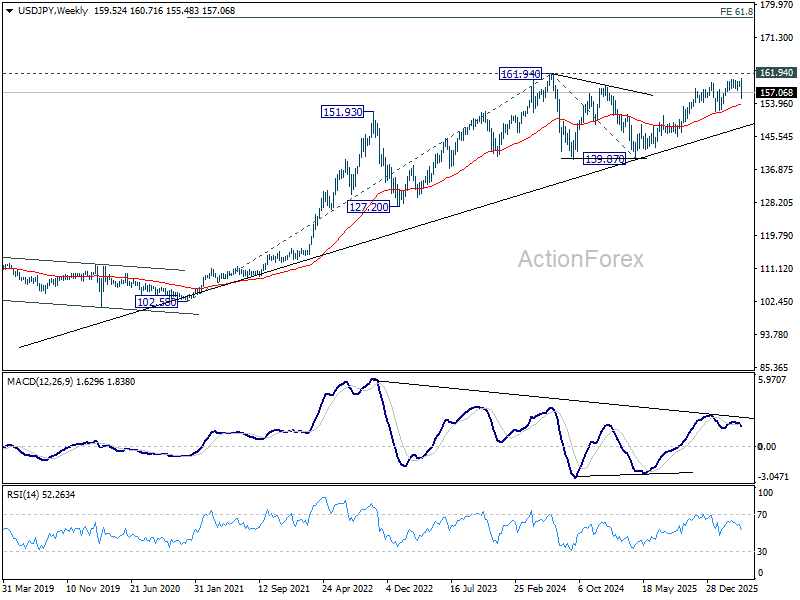
In the bigger picture, for now, corrective pattern from 161.94 (2024 high) is still seen as completed at 139.87. Rise from there is seen as resuming the long term up trend. So, break of 161.94 is expected at a later stage to resume the long term up trend. However, sustained break of 55 W EMA (now at 153.90) will dampen this view and bring deeper fall back towards 139.87 to extend the pattern from 161.94.
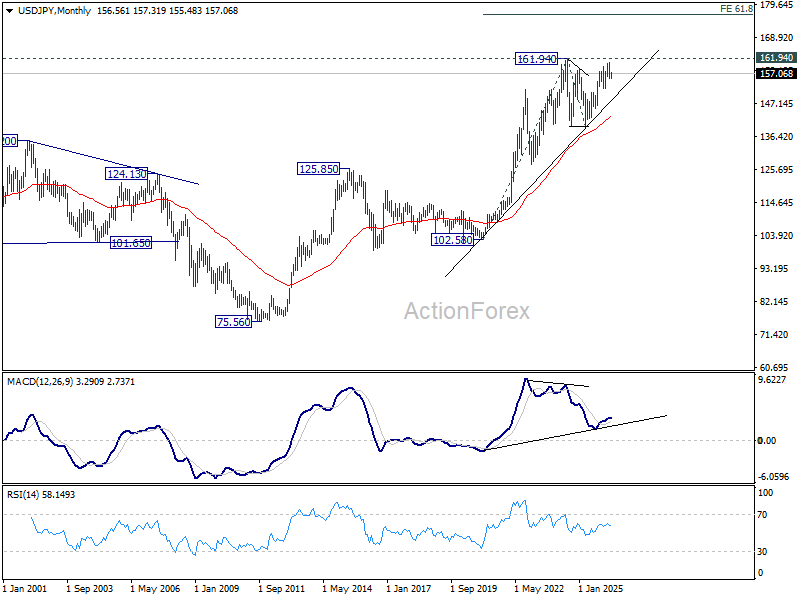
In the long term picture, up trend from 75.56 (2011 low) is still in progress and might be ready to resume. Firm break of 161.94 will target 61.8% projection of 102.58 (2020 low) to 161.94 (2024 high) from 139.87 at 176.55 in the medium term. Long term outlook will stay bullish as long as 139.87 support holds, even in case of deep pullback.
GBP/USD Weekly Outlook
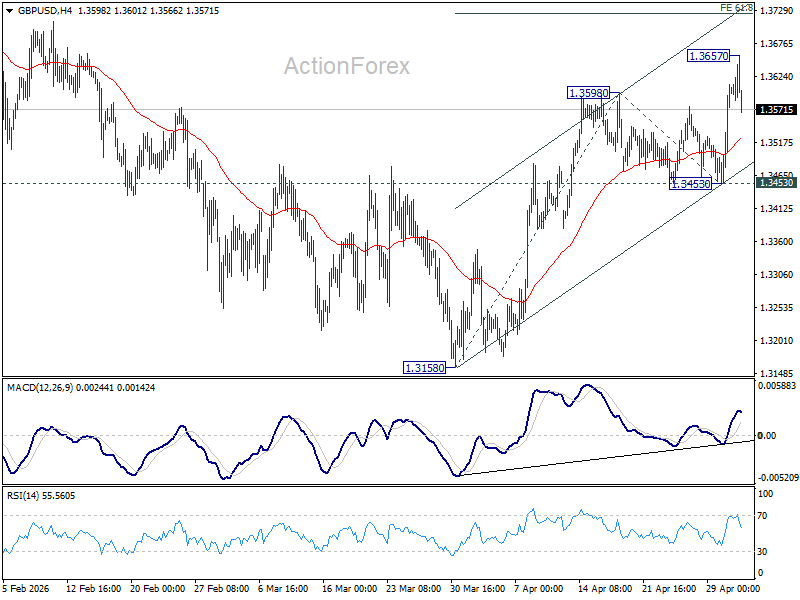
GBP/USD's rise from 1.3158 resumed last week but a temporary top should be formed after hitting 1.3657. Initial bias is turned neutral this week for consolidations first. Further rally is expected as long as 1.3453 holds. Above 1.3657 will target 61.8% projection of 1.3158 to 1.3598 from 1.3453 at 1.3725 first. Firm break there will target a retest on 1.3867 high.
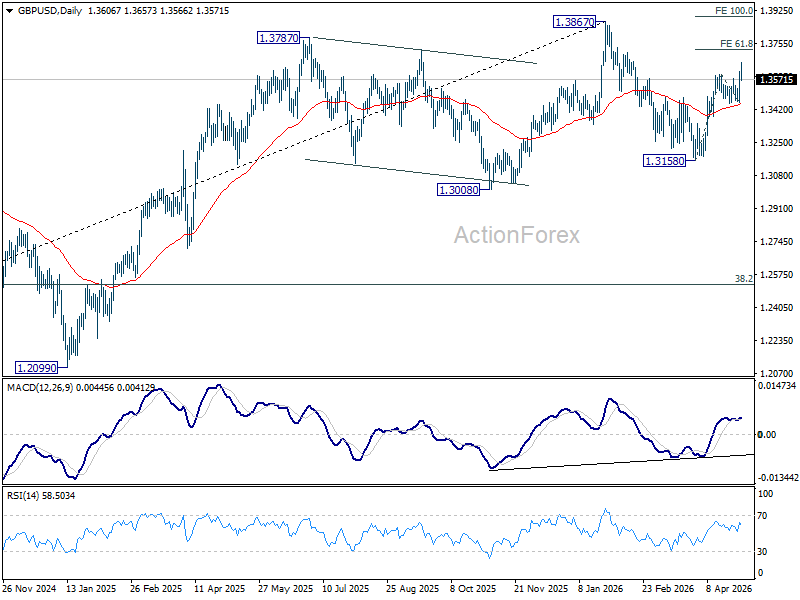
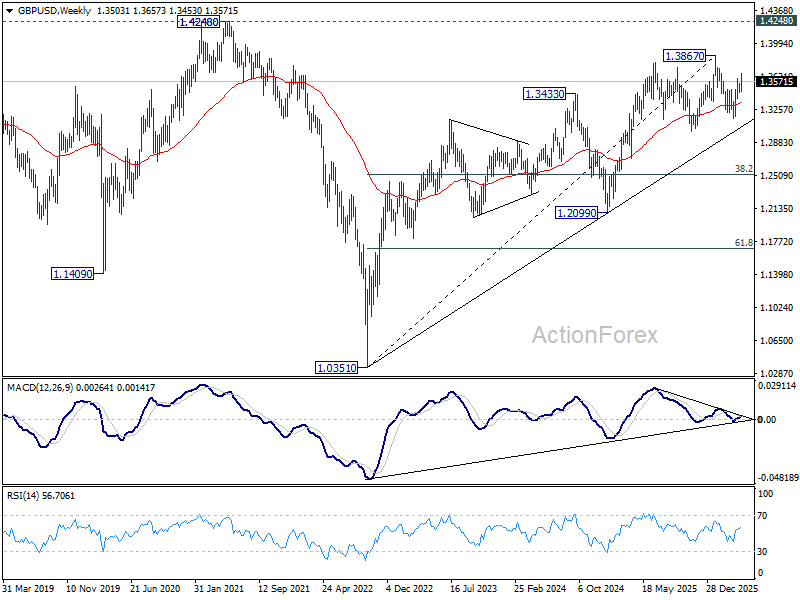
In the bigger picture, current development suggests that price actions from 1.3867 are merely a corrective pattern within the broader up trend from 1.0351 (2022 low). With 1.3008 support intact, medium term bullishness is maintained and break of 1.3867 is in favor for a later stage, towards 1.4248 key resistance (2021 high).
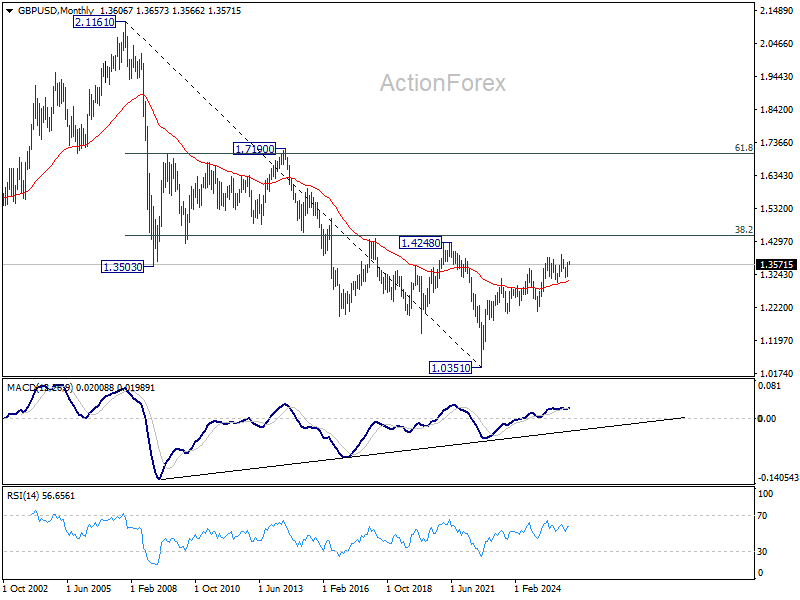
In the long term picture, as long as 1.4248/4480 resistance zone holds (38.2% retracement of 2.1161 to 1.0351 at 1.4480), the long term outlook will remain bearish. That is, price actions from 1.0351 are seen as a corrective pattern to down trend from 2.1161 (2007 high) only. Nevertheless, decisive break of 1.4248/4480 will be a strong sign of long term bullish reversal.
USD/CHF Weekly Outlook
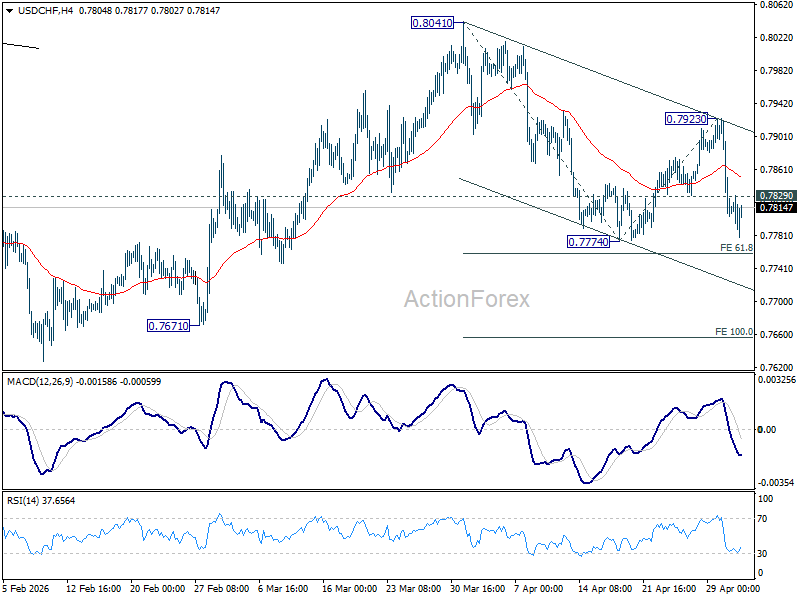
USD/CHF's fall last week suggests that rebound from 0.7774 has completed at 0.7923 already. Initial bias stays on the downside this week for 0.7774 and then 61.8% projection of 0.8041 to 0.7774 from 0.7923 at 0.7758. Firm break there will target 100% projection at 0.7656. On the upside, above 0.7829 minor resistance will turn intraday bias neutral first. But risk will stay on the downside as long as 0.7923 resistance holds, in case of recovery.
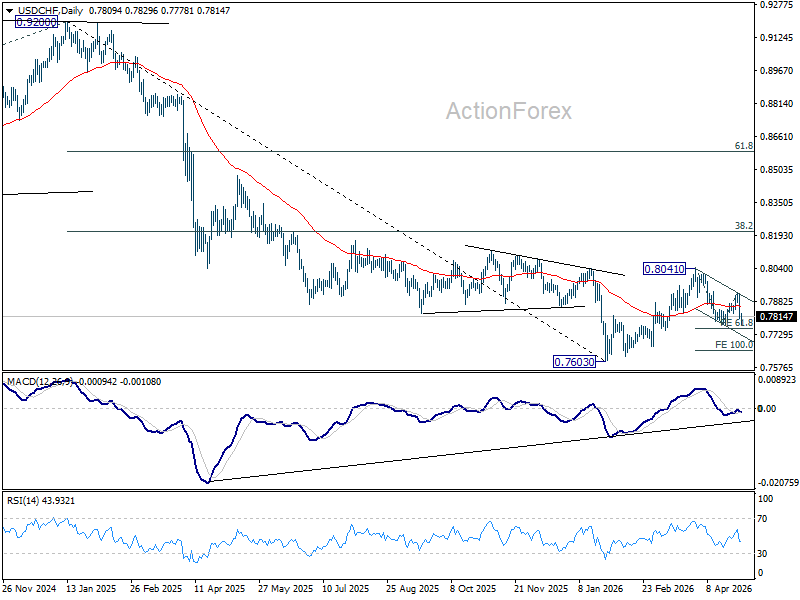
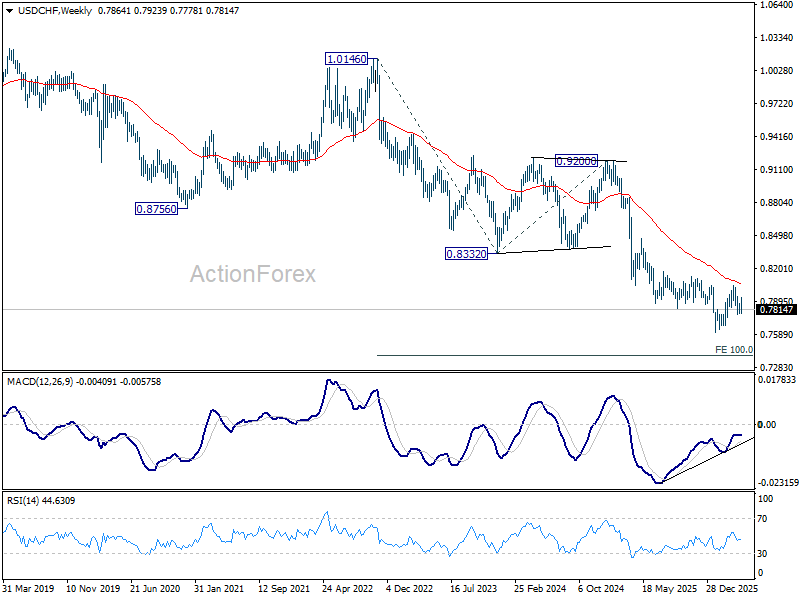
In the bigger picture, rebound from 0.7603 medium term bottom is seen as correcting the fall from 0.9200 only. Rejection by 55 W EMA (now at 0.8051) will affirm this bearish case, and setup down trend resumption to 100% projection of 1.0146 (2022 high) to 0.8332 from 0.9200 at 0.7382 at a later stage. Though, sustained break of 55 W EMA will suggest that it's probably correcting the larger scale down trend from 1.0146 (2022 high).
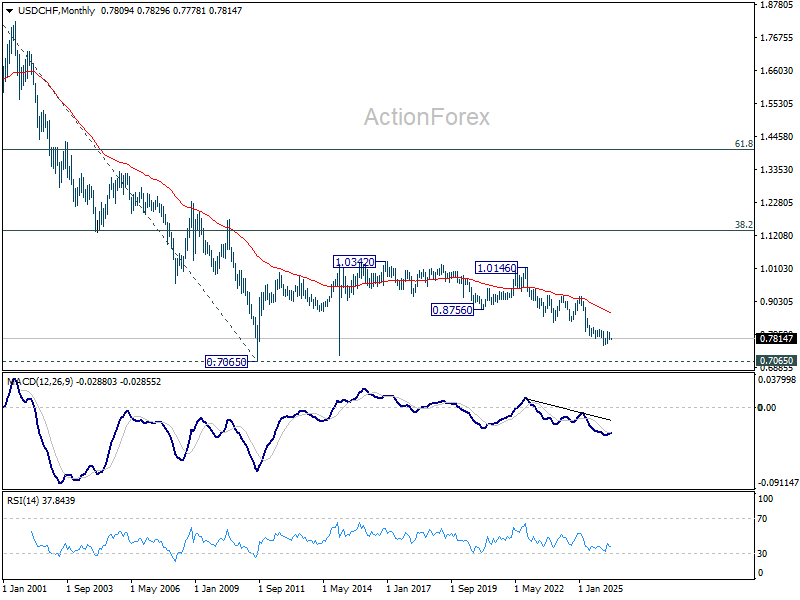
In the long term picture, price action from 0.7065 (2011 low) are seen as a corrective pattern to the multi-decade down trend from 1.8305 (2000 high). It's uncertain if the fall from 1.0342 is the second leg of the pattern, or resumption of the downtrend. But in either case, outlook will stay bearish as long as 0.8756 support turned resistance holds (2021 low). Retest of 0.7065 should be seen next.
AUD/USD Weekly Report
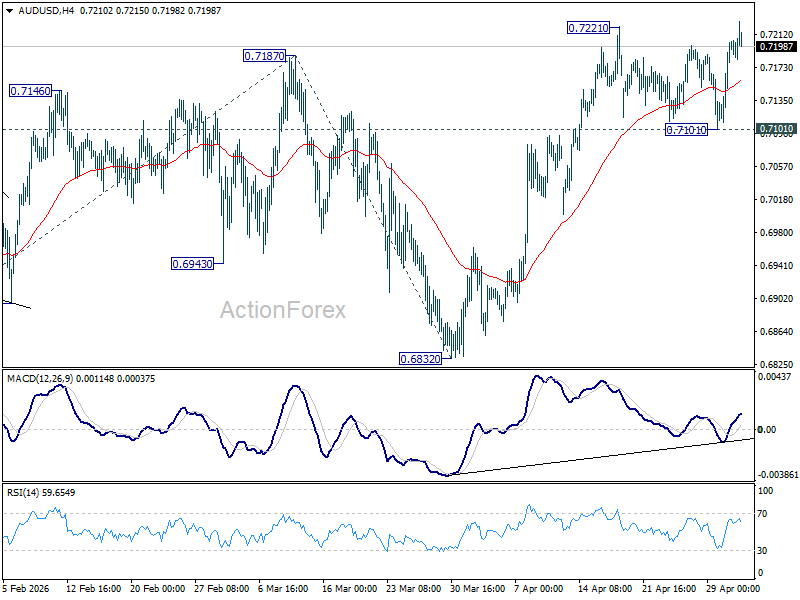
AUD/USD's late breach of 0.7221 last week suggests the recent up trend is resuming. Initial bias is mildly on the upside this week. Next target is 61.8% projection of 0.6420 to 0.7187 from 0.6832 at 0.7306. Outlook will now remain bullish as long as 0.7101 support holds, in case of retreat.
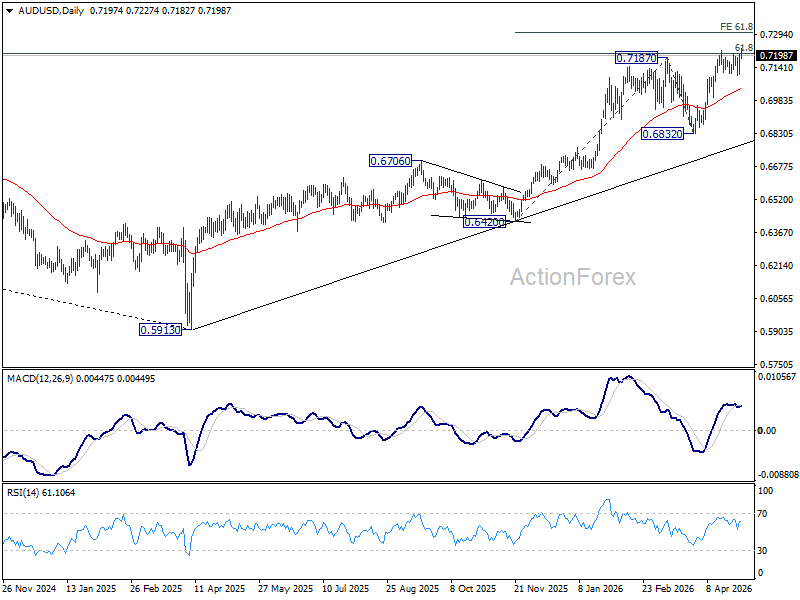
In the bigger picture, rise from 0.5913 (2024 low) is still in progress. Decisive break of 61.8% retracement of 0.8006 to 0.5913 at 0.7206 will solidify the case that it's already reversing the down trend from 0.8006 (2021 high). Further rally should then be seen to retest 0.8006. For now, outlook will remain bullish as long as 0.6832 support holds, in case of pullback.
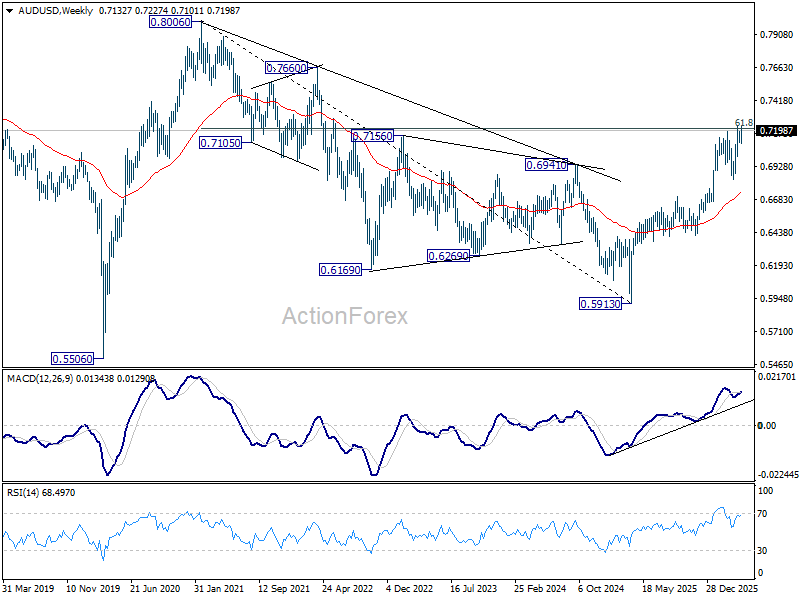
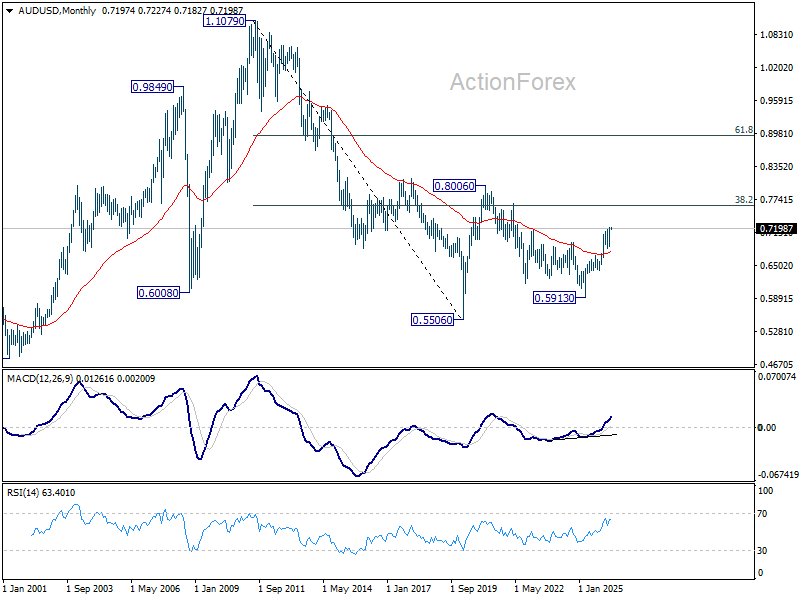
In the long term picture, rise from 0.5913 is seen as the third leg of the whole pattern from 0.5506 (2020 low). It's still early to judge if this is an impulsive or corrective pattern. But in either case, further rise should be seen back to 0.8006 and possibly above. This will remain the favored case as long as 55 W EMA (now at 0.6730) holds.
USD/CAD Weekly Outlook
USD/CAD's fall from 1.3965 continued last week after brief recovery. Initial bias stays on the downside this week for retesting 1.3480 low. Decisive break there will resume whole down trend from 1.4791. For now, risk will remain on the downside as long as 1.3709 resistance holds, in case of recovery.
In the bigger picture, price actions from 1.4791 are seen as a corrective pattern to the whole up trend from 1.2005 (2021 low). Deeper fall could be seen, as the pattern extends, to 61.8% retracement of 1.2005 to 1.4791 at 1.3069. However, decisive break of 38.2% retracement of 1.4791 to 1.3480 at 1.3981 will argue that the correction has completed with three waves down to 1.3480 already.
In the long term picture, rising 55 M EMA (now at 1.3581) remains intact. Thus, up trend from 0.9056 (2007 low) could still be in progress. However, considering bearish divergence condition M MACD, sustained trading below 55 M EMA will argue that the up trend has completed with five waves up to 1.4791, and turn medium term outlook bearish for correction to 38.2% retracement of 0.9056 to 1.4791 at 1.2600.