Sample Category Title
USD/CHF Mid-Day Outlook
Daily Pivots: (S1) 0.7787; (P) 0.7810; (R1) 0.7841; More….
USD/CHF recovered ahead of 0.7774 support and intraday bias is turned neutral first. Risk will remain on the downside as long as 0.7923 resistance holds. Firm break of 61.8% projection of 0.8041 to 0.7774 from 0.7923 at 0.7758 will extend the fall from 0.8041 to 100% projection at 0.7656.
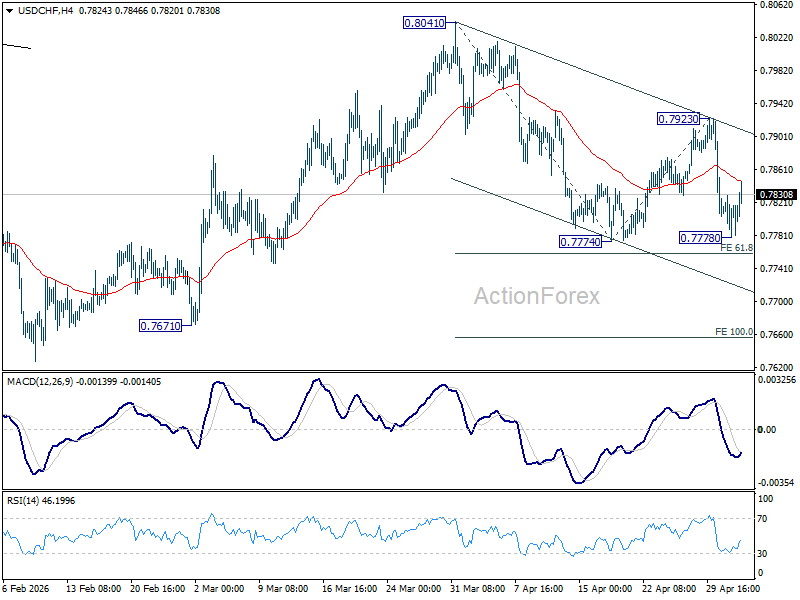
In the bigger picture, rebound from 0.7603 medium term bottom is seen as correcting the fall from 0.9200 only. Rejection by 55 W EMA (now at 0.8042) will affirm this bearish case, and setup down trend resumption to 100% projection of 1.0146 (2022 high) to 0.8332 from 0.9200 at 0.7382 at a later stage. Though, sustained break of 55 W EMA will suggest that it's probably correcting the larger scale down trend from 1.0146 (2022 high).
Debunked Strike, Real War Risk: Dollar Rallies on Panic Hedge as Hormuz Tensions Rise
Markets were whipsawed today by a dramatic but ultimately false headline—and the reaction says everything about current risk conditions. Reports that Iranian missiles had struck a US Navy vessel near the Strait of Hormuz sent oil surging and triggered an immediate rush into the Dollar as a panic hedge.
The logic was straightforward. A confirmed hit on a US warship would almost certainly have sparked a powerful military response and raised the risk of a full closure of the Strait. That scenario would have sent oil sharply higher and shaken global markets. Within minutes, traders moved to price that risk.
But the story unraveled just as quickly. US Central Command flatly denied the reports, stating that no ships had been hit and that any missiles launched “didn’t even come close” to US assets. As reality replaced speculation, Brent crude pulled back to around $110, unwinding much of the spike.
Yet the bigger picture has not changed. The United States has launched “Project Freedom,” actively escorting merchant ships and oil tankers out of the Persian Gulf. This is not a de-escalation—it is a sign that risks to shipping routes are rising.
Iran’s response was equally firm, warning that all vessels must coordinate with its military and pushing back against US involvement in the Strait. The standoff is becoming more structured, with both sides asserting control over one of the world’s most critical energy corridors.
And crucially, the risk is not hypothetical. The UAE confirmed that an ADNOC tanker was hit by two drones today. While the incident did not cause casualties, it confirms that the Strait remains a live conflict zone, where attacks on commercial shipping are already happening.
The market reaction, even after the denial, reinforces this reality. The Dollar continues to trade stronger as investors maintain defensive positioning. Yen is also firm, while commodity-linked currencies like the Aussie and Loonie lag. Swiss Franc is notably weaker, with Euro and Sterling largely neutral.
AUD/USD Awaits Hawkish RBA to Clear 0.72 Hurdle Decisively
AUD/USD is pressing a critical test at 0.72, with the RBA decision set to determine the next move. While a rate hike is largely priced in, markets are focused on whether policymakers signal more tightening ahead. A hawkish shift could drive a decisive breakout, but cautious guidance risks another rejection at key resistance. Read More.
ECB Survey Shows Higher Inflation, Weaker Growth as Energy Shock Bites
The Eurozone outlook is turning more difficult. ECB forecasters now see higher inflation and slower growth as energy prices rise, while wage pressures remain firm. With inflation staying elevated and activity weakening, policymakers face a growing stagflation dilemma. Read More.
Eurozone Sentix Improves to -16.4, But Germany Signals Deeper Trouble
Eurozone investor confidence is improving—but risks are far from over. While Sentix rebounded in May, recession concerns remain as inflation pressures persist and fiscal risks build. Germany’s continued decline adds another layer of concern, highlighting a fragile and uneven recovery across the bloc. Read More.
Eurozone PMI Manufacturing at Multi-Year High as War Triggers Record Cost Pressures
A strong Eurozone PMI reading is masking deeper risks. Manufacturing growth is being driven by stockpiling amid supply fears, while cost pressures are surging to record levels. With business optimism falling, the data point to a fragile outlook and rising challenges for policymakers. Read More.
USD/CHF Mid-Day Outlook
Daily Pivots: (S1) 0.7787; (P) 0.7810; (R1) 0.7841; More….
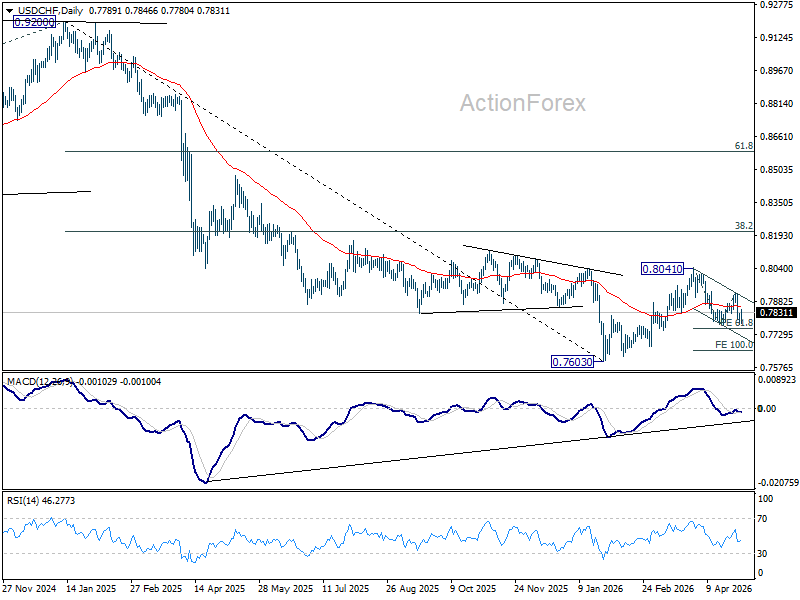
USD/CHF recovered ahead of 0.7774 support and intraday bias is turned neutral first. Risk will remain on the downside as long as 0.7923 resistance holds. Firm break of 61.8% projection of 0.8041 to 0.7774 from 0.7923 at 0.7758 will extend the fall from 0.8041 to 100% projection at 0.7656.
In the bigger picture, rebound from 0.7603 medium term bottom is seen as correcting the fall from 0.9200 only. Rejection by 55 W EMA (now at 0.8042) will affirm this bearish case, and setup down trend resumption to 100% projection of 1.0146 (2022 high) to 0.8332 from 0.9200 at 0.7382 at a later stage. Though, sustained break of 55 W EMA will suggest that it's probably correcting the larger scale down trend from 1.0146 (2022 high).
AUD/USD Awaits Hawkish RBA to Clear 0.72 Hurdle Decisively
The RBA is set to hike again in the upcoming Asian session—but that’s not the real story. Markets have largely priced in a 25 basis point move to 4.35%, and the focus has already shifted to what comes next. For the Australian Dollar, the outcome hinges not on the hike itself, but on whether the RBA signals that the tightening cycle is far from over.
Inflation is forcing the central bank’s hand. Headline CPI jumped from 3.6% to 4.6% in Q1. Trimmed mean measure eased slightly to 3.3% but remained elevated. Crucially, this strength is emerging even before the full impact of higher oil prices feeds through the economy, raising the risk that inflation could stay elevated for longer than previously expected, reinforcing the case for further tightening at this meeting
However, the path beyond May is unclear. According to a Reuters poll, while 18 of 31 economists expect the cash rate to remain at 4.35% through year-end, more than a third now see rates rising to at least 4.60% by the end of the third quarter, marking a notable shift in expectations compared to a month ago. This divergence underscores the importance of the RBA’s updated projections.
The Statement on Monetary Policy will be the real battleground. The key question is when inflation is expected to return to the 2–3% target. If that timeline is pushed back toward late 2026 or even 2027, it effectively signals that current policy is not restrictive enough—a clear green light for further tightening. Any hint from Governor Michelle Bullock that “more may be required” would reinforce that message.
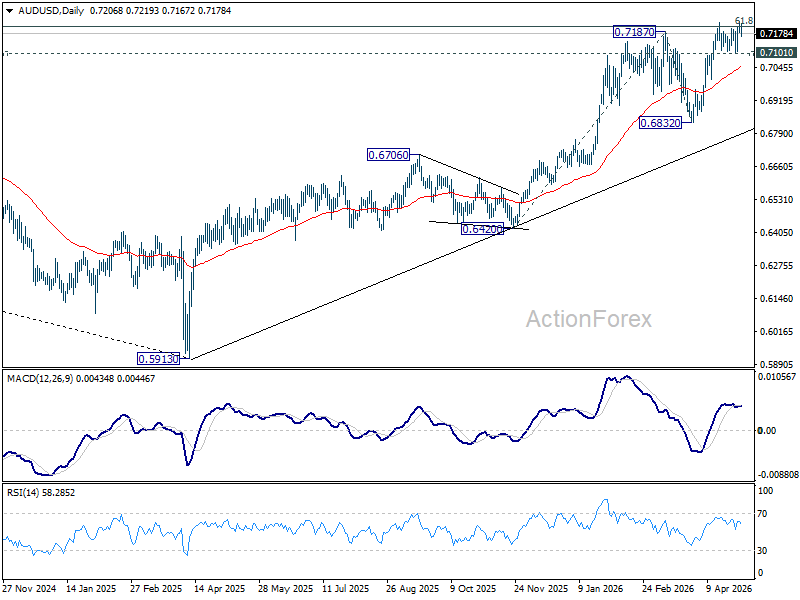
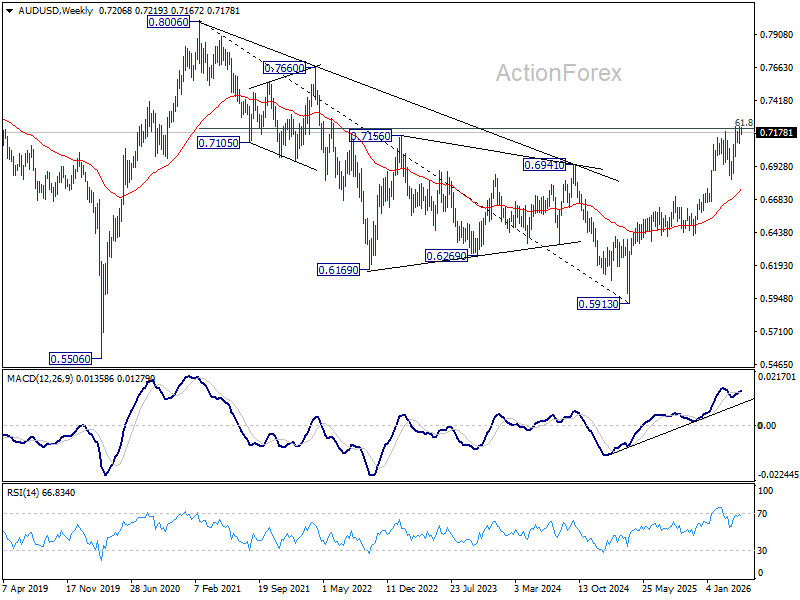
This sets up a critical moment for AUD/USD, which is now pressing against the 0.72 resistance zone. This level, aligned with 61.8% retracement of 0.8006 to 0.5913 at 0.7206, has repeatedly capped rallies, turning it into a defining technical barrier.
Further rise is expected for now, with 0.7101 acting as near-term support. A clean break above 0.7206 would mark a decisive shift, opening the path toward the 0.80 handle in the medium term. But without a hawkish push from the RBA, the risk is that this rally stalls once again.
If the central bank leans cautious or avoids strong forward guidance, the market may interpret it as hesitation, triggering rejection at resistance. A break below 0.7101 would indicate rejection at resistance and could open the way for a deeper pullback toward 0.6832.
In this context, the RBA’s communication will be pivotal. A clearly hawkish signal, particularly via inflation projections or forward guidance, could provide the catalyst needed for AUD/USD to break through 0.72. Conversely, a more cautious or data-dependent tone may reinforce existing uncertainty and keep the pair within its current range.
XAU/USD: Gold Bears Dominate While the Price Holds Below Falling Thick Daily Cloud
Gold price fell at the start of the week, losing around 1.8% by mid-European trading on Monday, reflecting growing concerns about rising inflation that prompted major central banks to take more hawkish stance, despite that all of them kept rates unchanged in the policy meetings last week.
On the other hand, high geopolitical uncertainty surrounding the latest signals about possible escalation over the Strait of Hormuz, partially counters the action and provides headwinds for fresh bears.
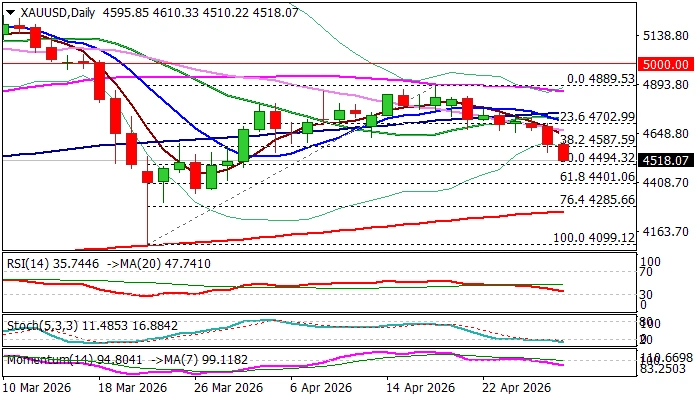
Technical picture on daily chart remains bearishly aligned after recent recovery attempts were capped just under the base of thick descending daily Ichimoku cloud, with Friday’s Doji and today’s large bearish candle, about to complete reversal pattern.
Converging daily Tenkan/Kijun-sen are about to form a bear cross and along with strengthening negative momentum and DMAs in full bearish setup, contribute to negative near-term outlook.
Bears pressure pivotal $4500 support zone, consisting of last Wednesday’s one-month low and Fibo 50% retracement of $4099/$4899, violation of which to further weaken near-term structure and expose targets at $4401 (Fibo 61.8%) and $4285 (200DMA / Fibo 76.4%) in extension.
Initial resistance lays at $4587 (broken Fibo 38.2%), followed by $4631/41 (daily Kijun-sen / Tenkan-sen respectively) and key obstacle at $4665 (daily cloud base).
Res: 4587; 4641; 4700; 4740.
Sup: 4510; 4494; 4401; 4351.
ECB Survey Shows Higher Inflation, Weaker Growth as Energy Shock Bites
The ECB’s latest Survey of Professional Forecasters points to a worsening macro mix for the Eurozone, with higher inflation and weaker growth in the near term. Headline HICP inflation is now expected to rise from 1.8% to 2.7% for 2026 and from 2.0% to 2.1% for 2027, while remaining stable at 2.0% in 2028. Core inflation was also revised higher, from 2.0% to 2.2% for both 2026 and 2027.
At the same time, growth expectations have been downgraded. Real GDP is downgraded from 1.2% to 1.0% in 2026 and from 1.4% to 1.3% in 2027, reflecting the drag from higher energy prices linked to the Middle East conflict. While forecasts for 2028 and the longer term remain unchanged at 1.3%, the near-term downgrade highlights rising concerns about economic momentum.
The labor market outlook remains stable, with unemployment expectations unchanged at 6.3% for 2026, easing gradually to 6.1% by 2028. However, wage growth projections have been revised higher, from 3.0% to 3.3% for 2026 and from 2.9% to 3.1% for 2027, suggesting continued pressure on costs that could feed into broader inflation dynamics.
Overall, the survey reinforces a stagflationary tilt in the Eurozone outlook. While inflation is expected to return to target over the longer term, the near-term combination of rising prices and slowing growth presents a clear challenge for the ECB.
| Indicator | 2026 | 2027 | 2028 |
|---|---|---|---|
| HICP Inflation | 1.8% → 2.7% | 2.0% → 2.1% | 2.1% → 2.0% |
| Core HICP Inflation | 2.0% → 2.2% | 2.0% → 2.2% | 2.0% → 2.1% |
| Real GDP Growth | 1.2% → 1.0% | 1.4% → 1.3% | 1.3% → 1.3% |
| Unemployment Rate | 6.3% → 6.3% | 6.2% → 6.2% | 6.1% → 6.1% |
| Wage Growth | 3.0% → 3.3% | 2.9% → 3.1% | 2.8% → 2.9% |
The Yen is Recovering
- Japan has spent $34 billion on market interventions.
- The futures market has revised its outlook on Fed interest rates.
At the end of last week, the US dollar retreated to early March levels of 97.60, having rebounded to 98.10 at the time of writing. The catalyst for the USD index’s plunge at the end of last week was the markets’ reassessment of the Fed’s rate outlook and Donald Trump’s announcement that the US would begin withdrawing commercial vessels from the Strait of Hormuz. Nevertheless, investors’ doubts that the world’s main oil artery would be restored allowed the greenback to recover.
Before the April FOMC meeting, the futures market had priced in a low probability of a rate cut. The emergence of three dissenting voices on the committee increased the chances of monetary tightening and ruled out easing. However, the rhetoric of Fed members is once again shifting the situation.
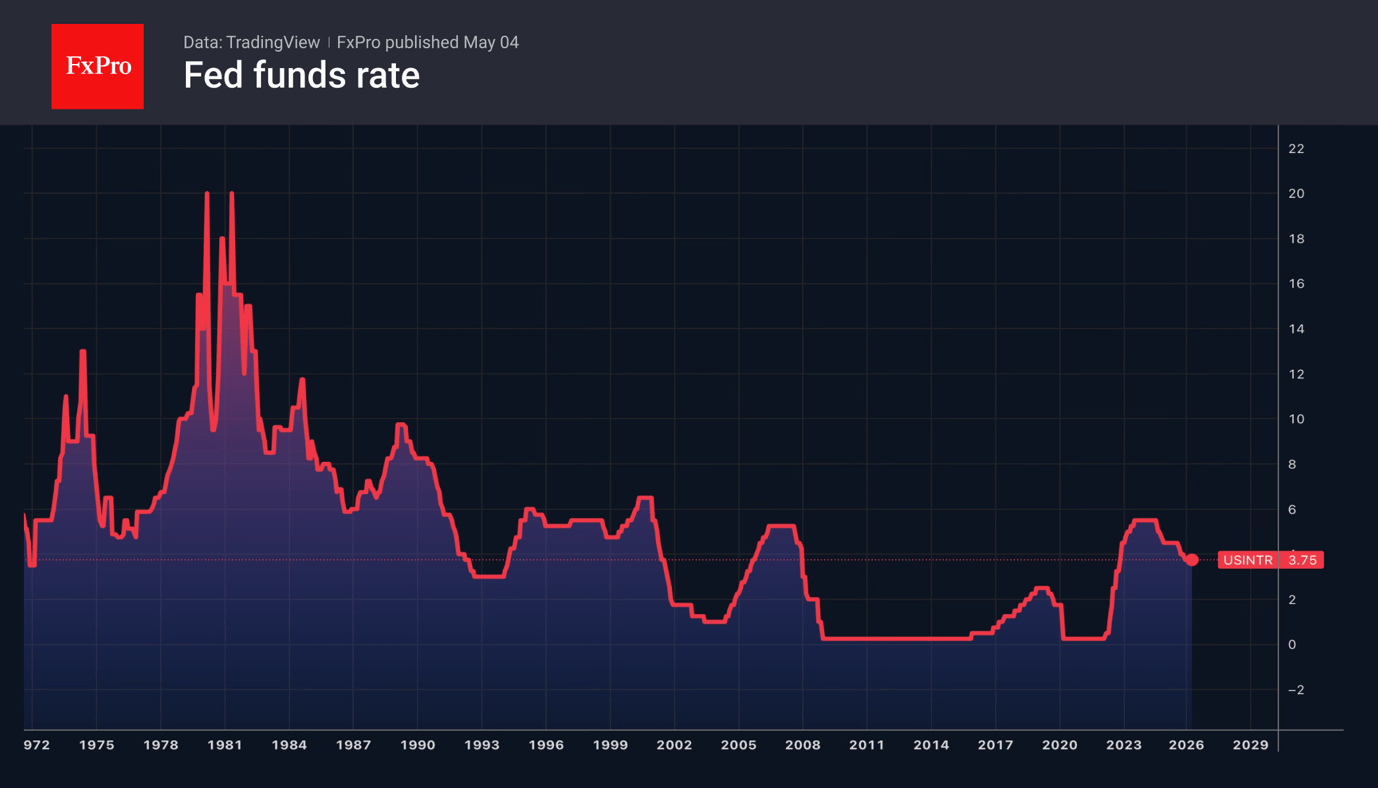
Neel Kashkari of Minneapolis believes that the next move could be either a hike or a cut. Beth Hammack of Cleveland argues that rising uncertainty makes monetary policy itself more uncertain. Lori Logan of Dallas is concerned that it will take a long time for inflation to return to target. As a result, the futures market paints a balanced picture, with an 11.5% probability of both a cut and a hike in the federal funds rate in 2026, and a 77% chance of it remaining at the current level. This reassessment has deprived the dollar of significant support.
Investors are not yet giving much thought to the economic outlook. According to ECB Executive Board member Yannis Stournaras, concerns about a recession in the eurozone are real and justified. Conversely, the number of media mentions of a US economic downturn is declining.
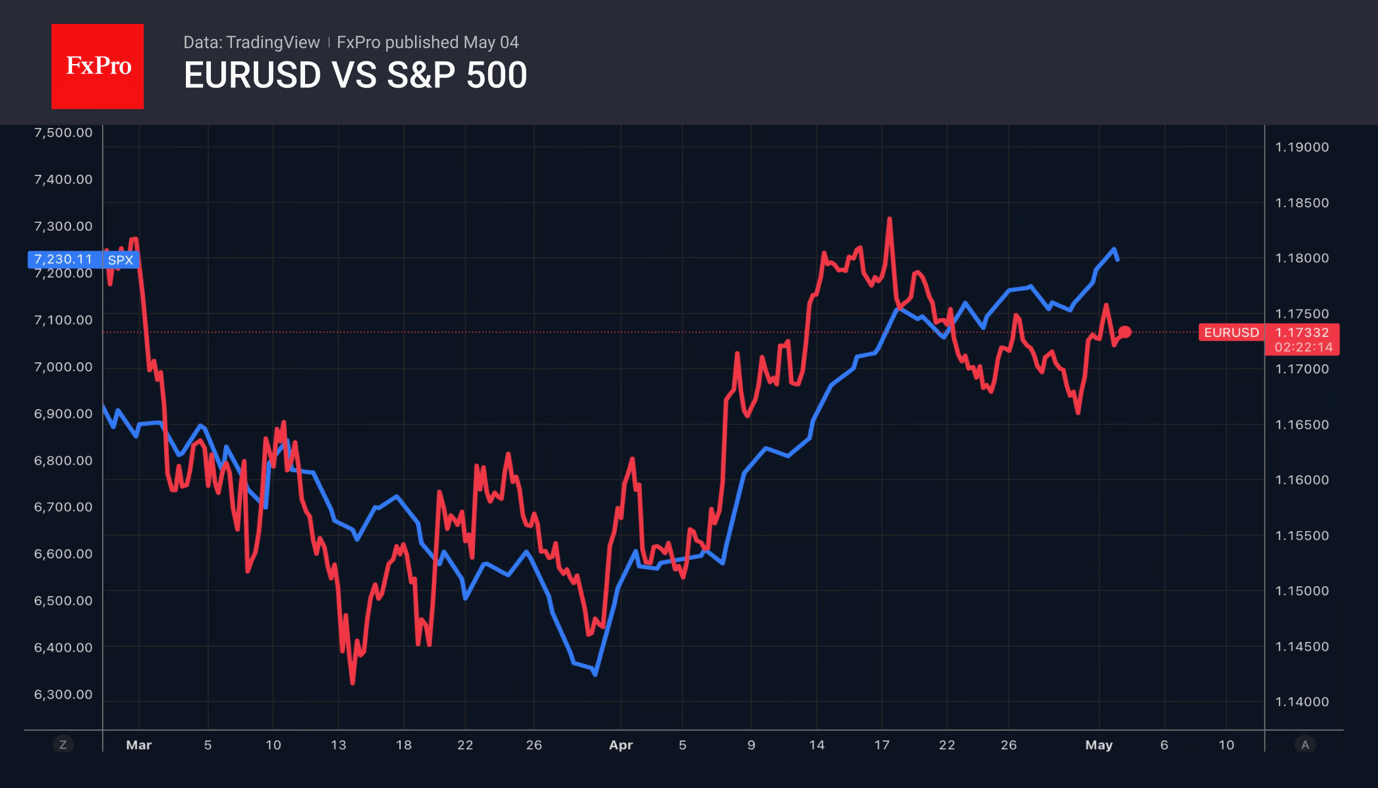
The resumption of the trade war could add fuel to the fire of diverging economic growth. Donald Trump has announced a 25% tariff on European cars, citing the EU’s alleged failure to meet the terms of the agreement. A symmetrical response risks causing more harm to the eurozone than to the US.
Meanwhile, USDJPY bulls are trying to recover after Japanese authorities intervened in the forex market. Bloomberg estimated the cost of these interventions at 5.4 trillion yen ($34 billion). In 2024, Tokyo intervened in the market four times, with an average volume of around 3.8 trillion yen. On the intraday charts for Friday and Monday, resistance is clearly visible at 157.3 for USDJPY and 184.5 for EURJPY. This looks like a continuation of interventions aimed at establishing a trend of lower local highs and convincing the market of the sustainability of this reversal so that it becomes self-sustaining.
Bitcoin Hits $80K
Market Overview
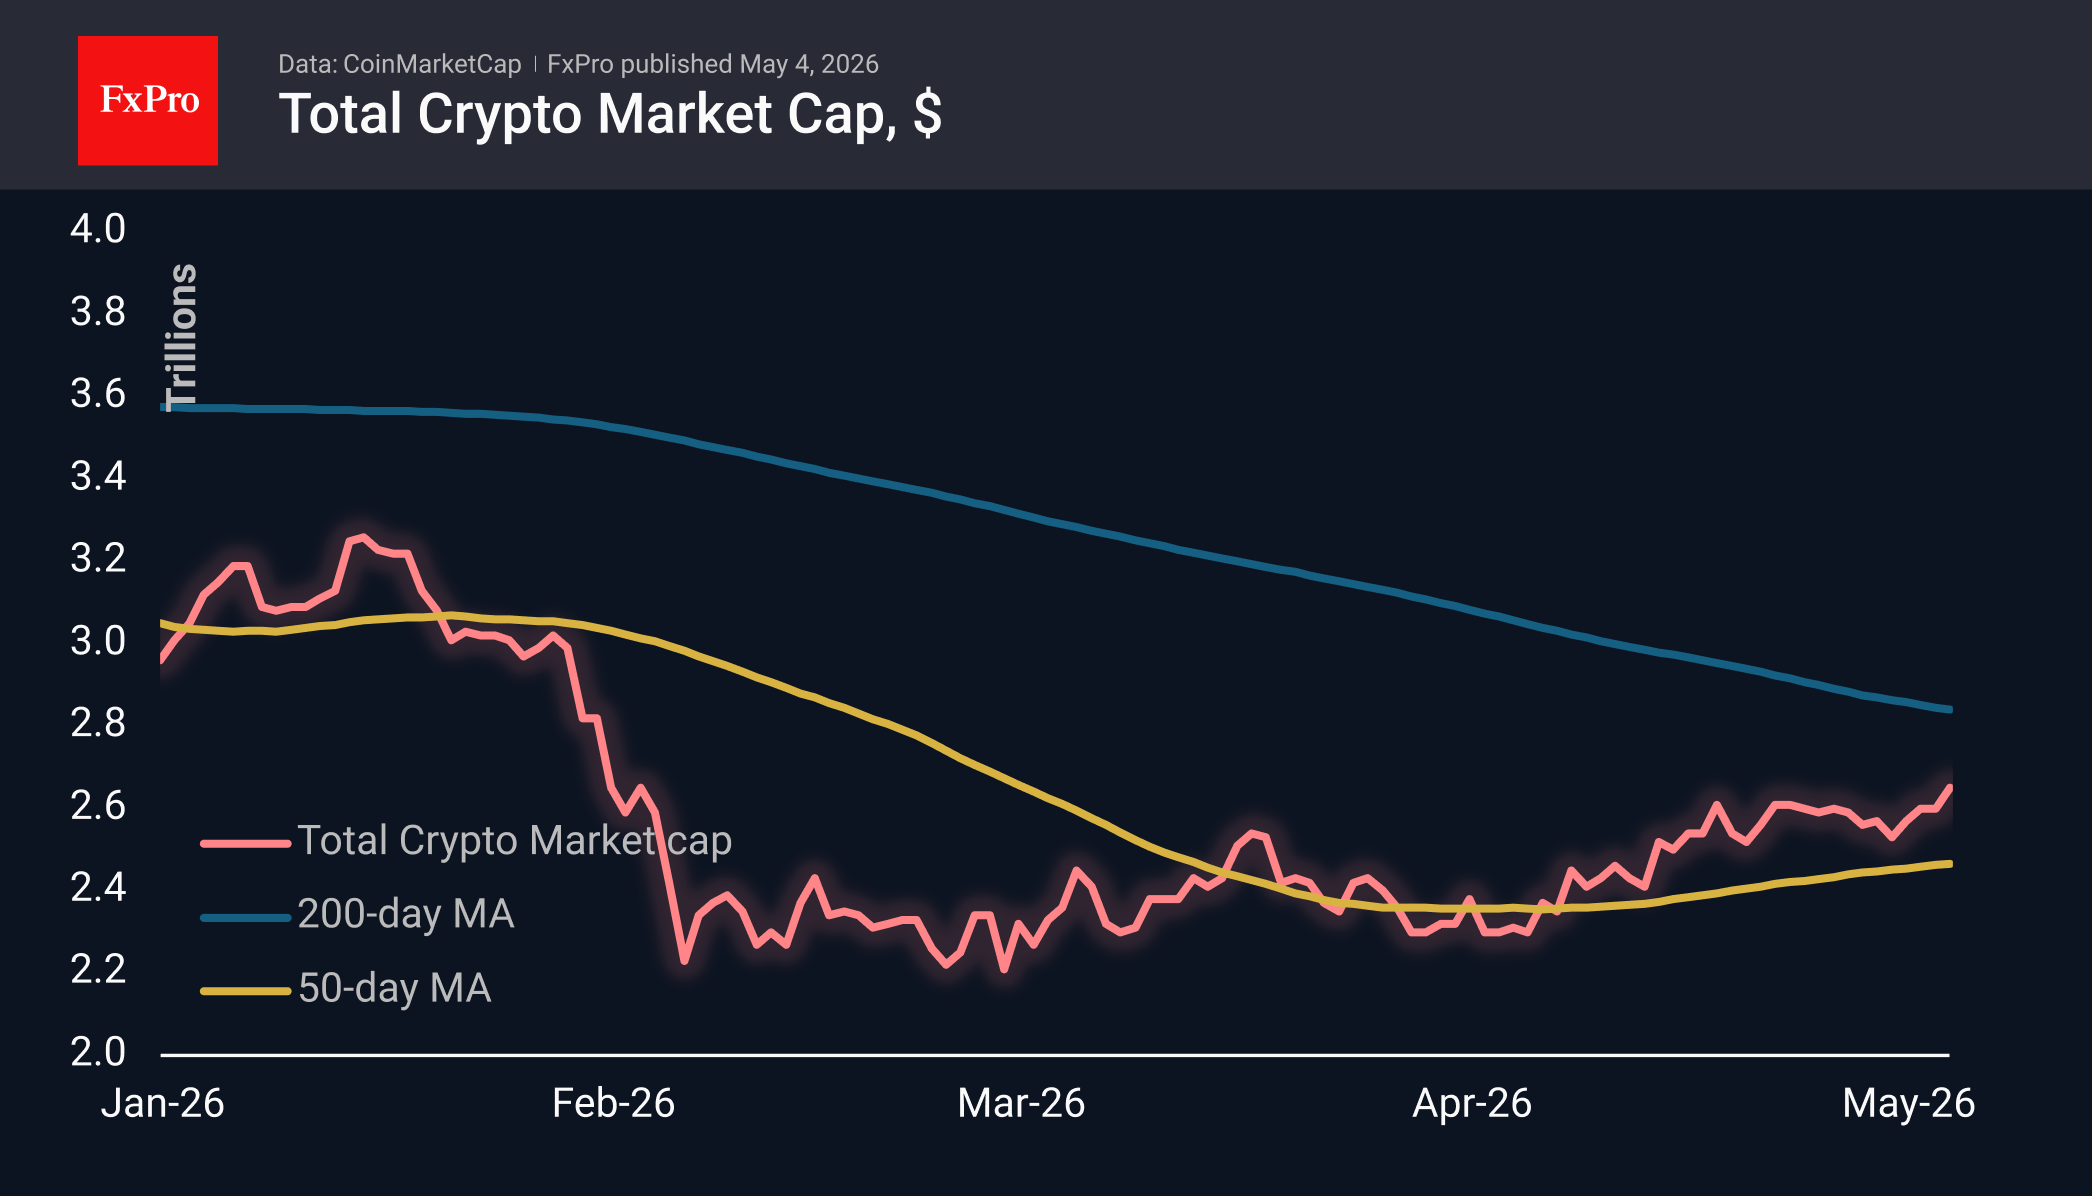
The crypto market capitalisation has risen by 1.4% over the past 24 hours and by roughly the same amount over the past 7 days, reaching $2.64T. At its peak at the start of the day, the market reached $2.67T, a level last seen in early February. A slow but steady recovery has been observed since early April, recouping half of the losses incurred during the just over one-week slump that began in late January. Over the past 24 hours, the leaders have been Dash (+30%), Basic Attention Token (+10.2%) and Zcash (+7.8%). Even the laggards are showing gains: TRUMP (+0.1%), Algorand (+0.6%) and Near (+0.5%).
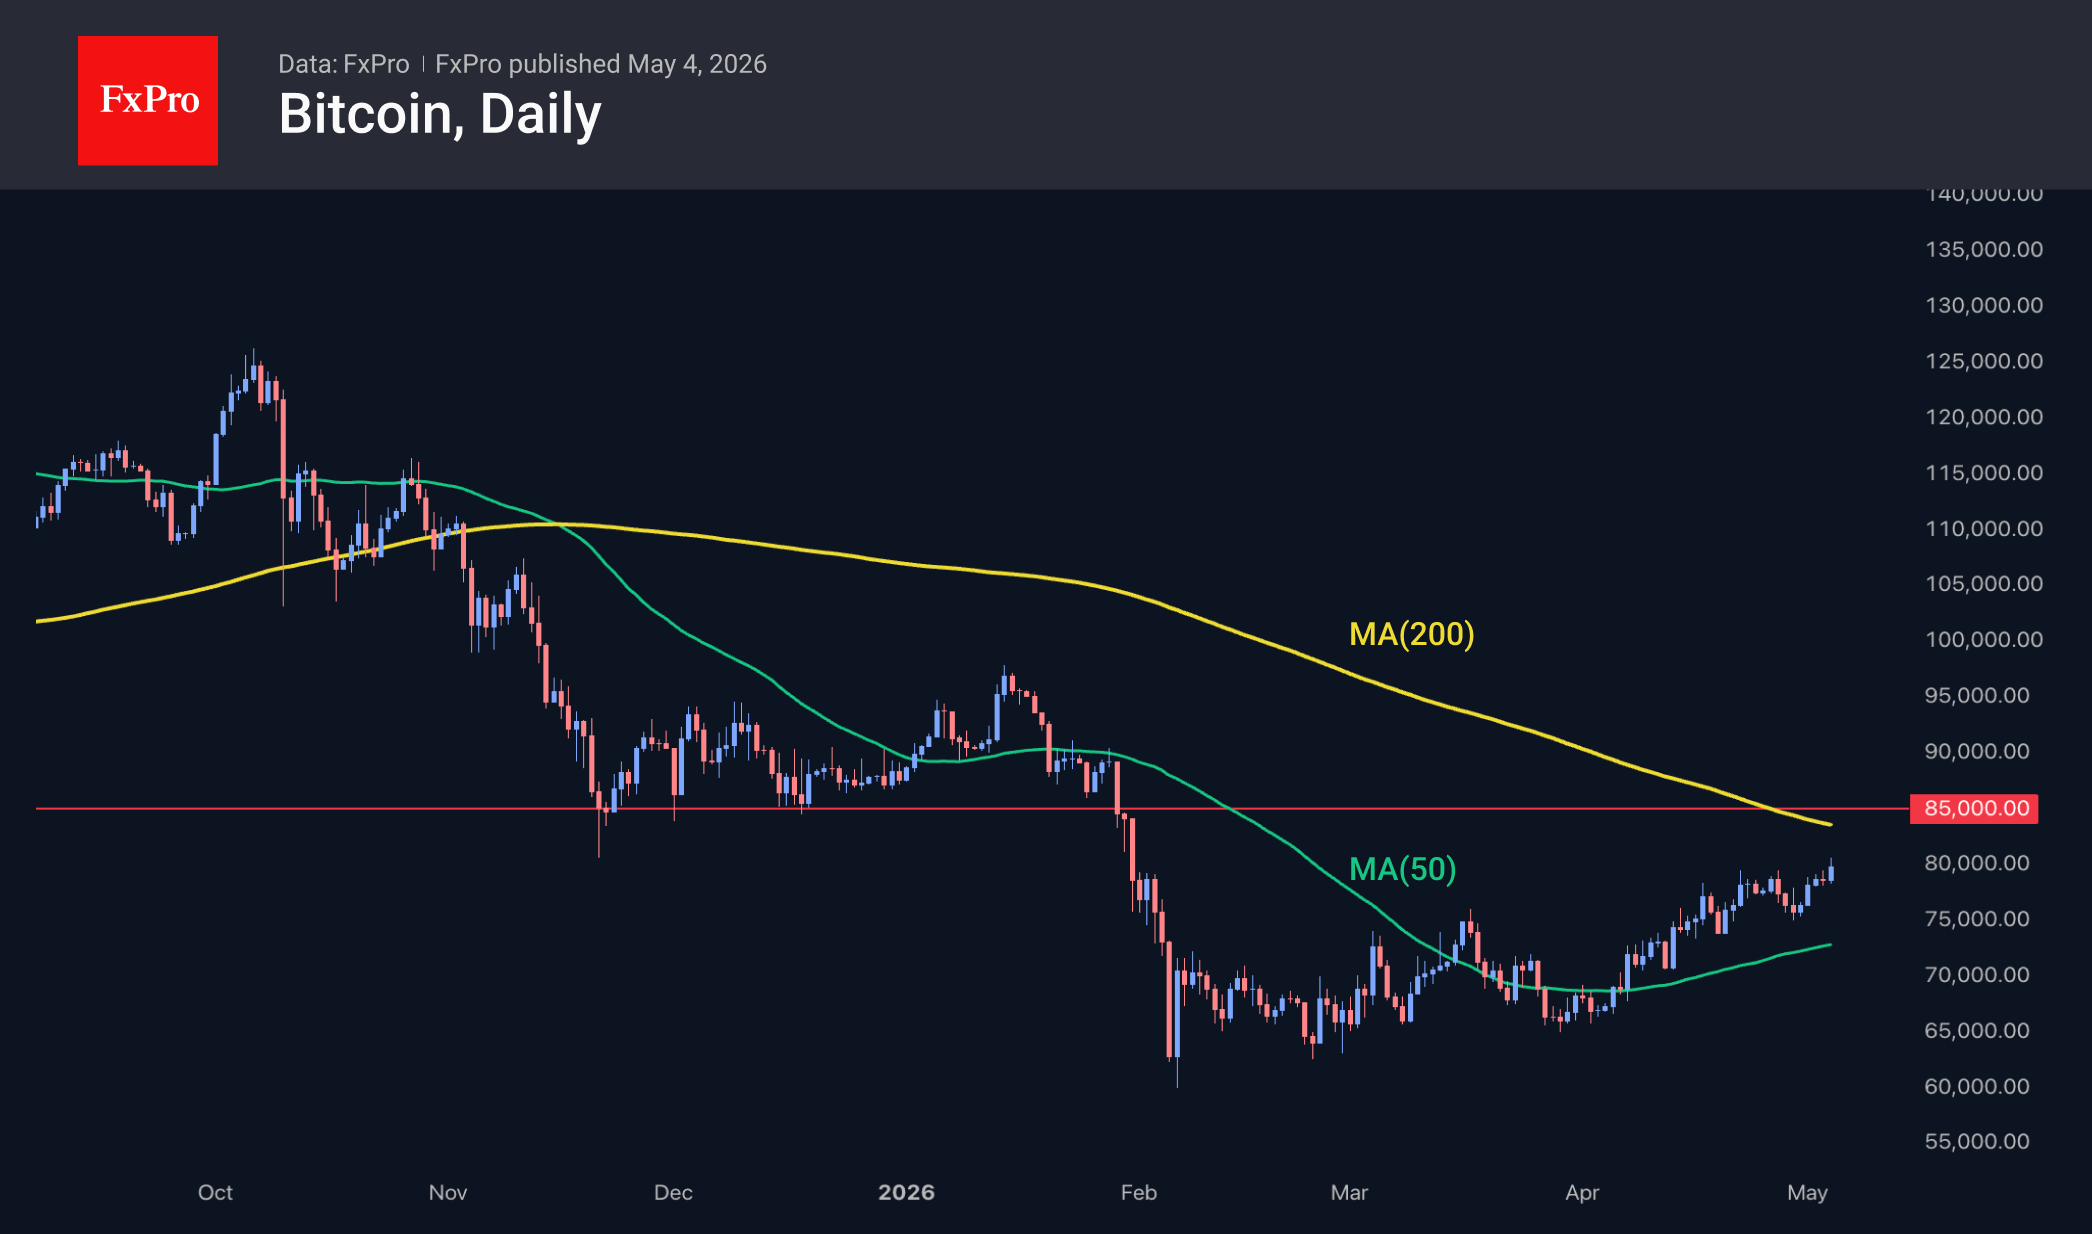
Bitcoin slipped to $80.6K at the start of trading on Monday. We last saw such levels at the end of January. The rising price and the downward-sloping 200-day moving average are actively converging with an important long-term trend line at $83.6K. Consolidation above this level could further encourage traders, but we would prefer to see consolidation above $85K first, the former support zone from November to January.
According to SoSoValue, net inflows into spot BTC ETFs amounted to $153.9 million over the week. In April, investors poured $1.97 billion into US Bitcoin ETFs, the highest figure since October 2025.
Inflows into US spot Ethereum ETFs halted after three weeks of inflows. Net outflows from ETH ETFs amounted to $82.5 million for the week. Over the past month, investors poured $356 million into US Ethereum ETFs.
Perpetual futures fuelled Bitcoin’s April rally, while spot demand remained in negative territory. This divergence points to the speculative nature of the movement, CryptoQuant notes.
Bitcoin’s market capitalisation could grow almost 11-fold by 2030, to $16 trillion, according to forecasts by ARK Invest. This will occur if cryptocurrencies evolve into an asset class present in investment portfolios worldwide.
Tesla CEO Elon Musk stated during legal proceedings against OpenAI that he considers most cryptocurrencies to be fraudulent schemes. Users criticised Musk for hypocrisy.
Tether has published its financial report for the first quarter of 2026, audited by BDO. The stablecoin issuer’s net profit stood at $1.04 billion. The company’s total assets reached $191.7 billion, with liabilities of $183.5 billion. Excess reserves rose to a record $8.23 billion.
Gold Supported by Cautious Optimism
Gold is holding at around 4,611 USD per ounce on Monday as markets assess Donald Trump’s proposal to escort commercial vessels through the Strait of Hormuz, alongside tentative signs of progress in US–Iran negotiations.
The plan involves assisting civilian ships from neutral countries in safely leaving the conflict zone and restoring access to the shipping route. At the same time, Iran has stated that it is reviewing the US response to its latest proposal, which has helped support hopes for a diplomatic resolution.
However, the conflict, now entering its tenth week, continues to drive energy prices higher and intensify inflationary pressures. This has reinforced expectations that central banks may keep interest rates elevated for longer, or even tighten policy further if inflation risks persist.
Since the beginning of the confrontation, gold has remained under pressure and has lost around 12% of its value. At the same time, data from the World Gold Council show that central banks continue to increase their gold reserves, providing underlying support for long-term demand.
Technical Analysis
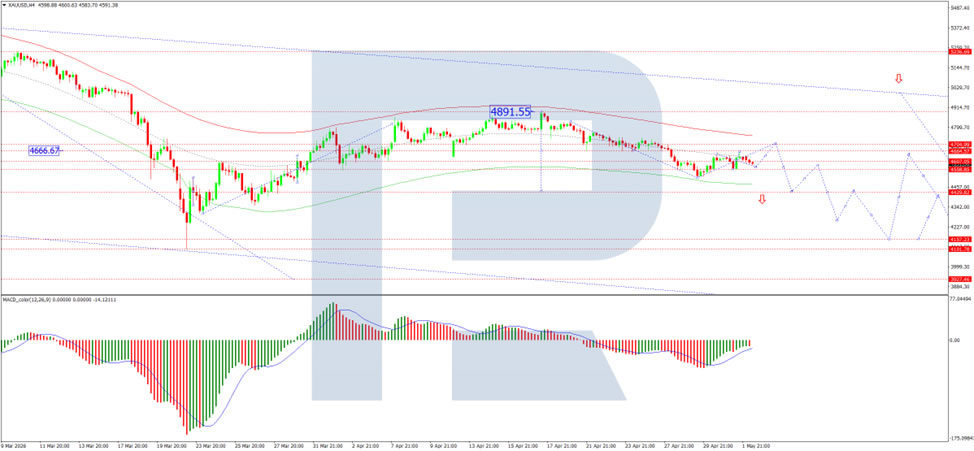
On the H4 chart, XAU/USD is consolidating above the 4,600 USD evel. A move higher could open the way for a corrective rebound towards 4,704 USD. On the downside, a fresh decline towards 4,430 USD cannot be ruled out. The MACD indicator supports the current recovery bias: the signal line remains below the zero mark but continues to point firmly upwards, indicating strengthening bullish momentum.
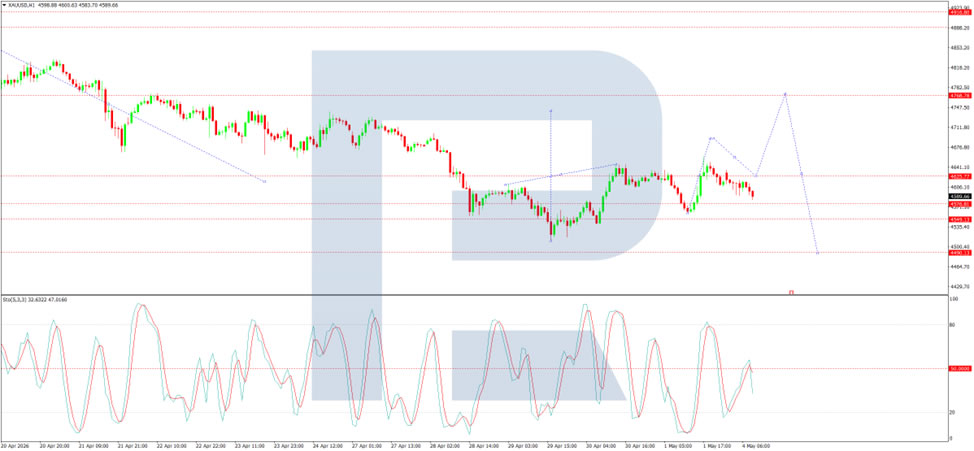
On the H1 chart, the market has broken below the 4,620 USD level and is extending its move towards 4,580. In the near term, a rebound towards 4,690 USD remains possible as a retest from below, followed by a potential pullback to 4,625 USD. After that, a further move higher towards 4,741 USD may develop. The Stochastic oscillator supports this scenario, with the signal line remaining below 50 and pointing lower towards 20, signalling short-term downside pressure.
Conclusion
Gold remains caught between cautious optimism over diplomacy and persistent inflation risks driven by the Middle East conflict. While short-term price action remains fragile, continued central bank demand and geopolitical uncertainty are likely to provide underlying support for gold in the medium to longer term.
Eurozone Sentix Improves to -16.4, But Germany Signals Deeper Trouble
Eurozone Sentix Investor Confidence improved from -19.2 to -16.4 in May, beating expectations of -20.5 and signaling a modest stabilization in sentiment. Both the Current Situation Index and Expectations Index also edged higher, rising from -22.8 to -21.5 and from -15.5 to -11.3 respectively, suggesting that investors are becoming less pessimistic about the near-term outlook.
The improvement appears to reflect easing fears of further escalation in the Middle East conflict, particularly around Iran. However, sentiment remains firmly in negative territory, underscoring that recession risks have not dissipated. At the same time, inflation concerns remain elevated, with Sentix’s inflation barometer still deeply negative, indicating persistent price pressures that continue to weigh on expectations.
This combination of weak growth and ongoing inflation risk highlights a difficult backdrop for the ECB. Fiscal dynamics are adding to the challenge, with the Sentix fiscal barometer at -29.5, pointing to mounting government debt pressures that could push interest rates higher. Rising borrowing costs, in turn, risk exacerbating already fragile economic conditions across the bloc.
| Eurozone | Previous | Latest |
|---|---|---|
| Sentix Investor Confidence | -19.2 | -16.4 |
| Current Situation Index | -22.8 | -21.5 |
| Expectations Index | -15.5 | -11.3 |
| Inflation Barometer | -43 | -42.75 |
| Fiscal Barometer | — | -29.5 |
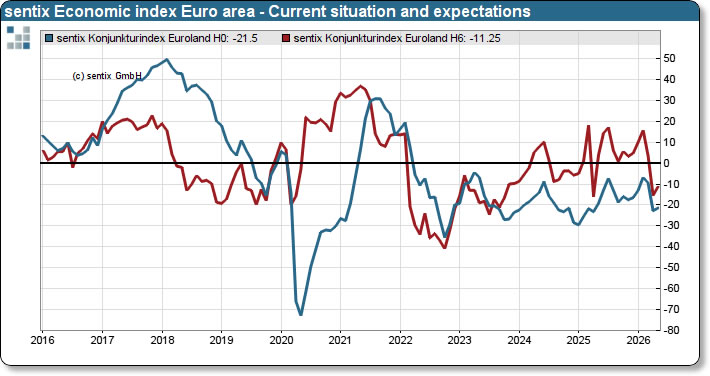 Germany stands out as a clear underperformer. In contrast to the broader Eurozone stabilization, Germany’s overall index fell by 3.2 points, with both current conditions and expectations deteriorating further. The decline, coupled with political instability, signals that Europe’s largest economy is diverging onto a weaker path.
| Germany | Previous | Latest | Notes |
|---|---|---|---|
| Overall Sentix Index | -27.7 | -30.9 | Lowest since Jan 2025 |
| Current Situation | -38.0 | -42.3 | Lowest since Feb 2026 |
| Expectations | -16.8 | -18.8 | Lowest since Sep 2024 |
Eurozone PMI Manufacturing at Multi-Year High as War Triggers Record Cost Pressures
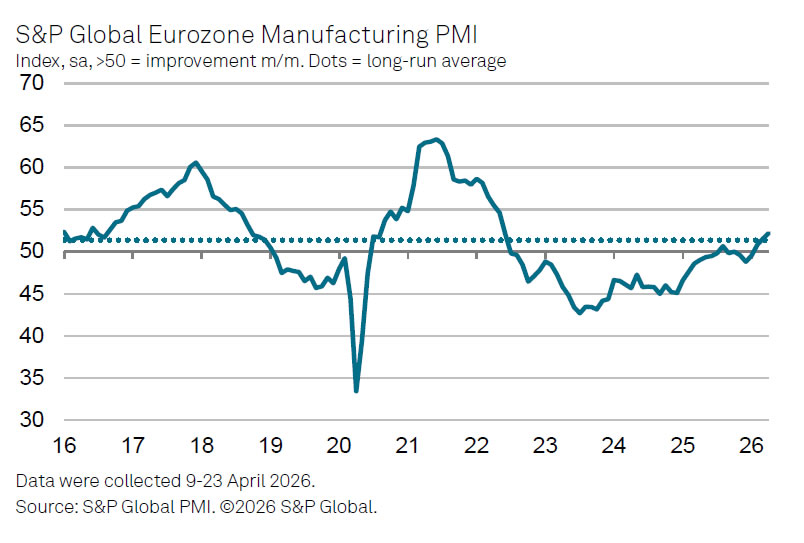
Eurozone Manufacturing PMI was finalized at 52.2 in April, rising from March's 51.6 and marking a 47-month high, signaling a broad-based expansion across the bloc. Notably, all eight countries covered in the survey registered readings above the 50 threshold for the first time since June 2022.
The improvement was also reflected in output, with the Manufacturing PMI Output Index climbing from 52.0 to 52.3, an eight-month high. However, the underlying drivers of this growth raise concerns. Survey evidence suggests that production and new orders are being supported by precautionary stockpiling, as firms build inventories amid fears of supply disruptions linked to the Middle East conflict.
At the same time, inflation pressures are intensifying sharply. Input price inflation surged to its highest level in nearly four years, with firms passing on these costs at the fastest pace since January 2023. The scale of the increase is historically significant, with selling price inflation recording its strongest jump since the survey began in 1997, highlighting the severity of the cost shock.
According to S&P Global’s Chris Williamson, the data present a troubling mix for policymakers. While headline PMI figures appear robust, forward-looking indicators show deteriorating confidence, with future output expectations falling to a one-and-a-half-year low. The combination of slowing demand outlook and escalating cost pressures suggests that current growth may prove short-lived.