

Sample Category Title
AUD/USD Daily Report
Daily Pivots: (S1) 0.7180; (P) 0.7204; (R1) 0.7225; More...
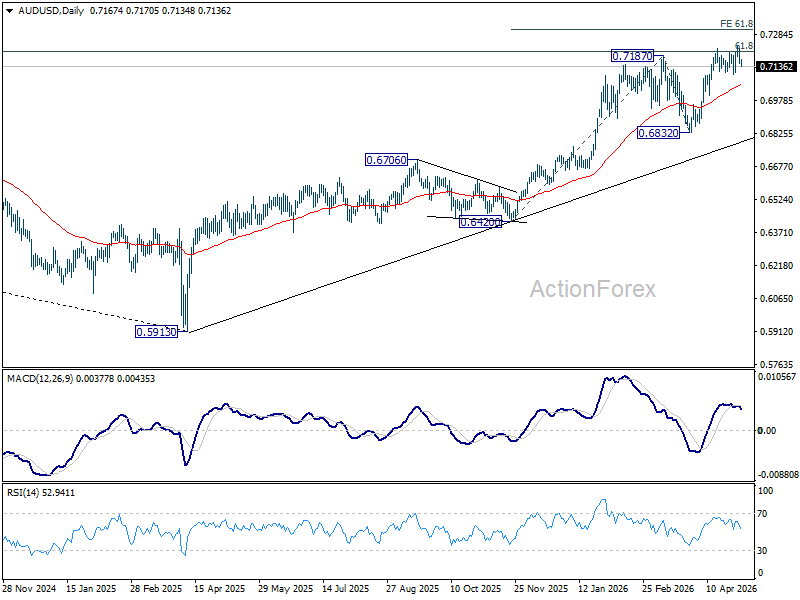
Intraday bias in AUD/USD is turned neutral first with current extended retreat. Further rise will remain in favor as long as 0.7101 support holds. On the upside, break of 0.7227 will resume recent up trend to 61.8% projection of 0.6420 to 0.7187 from 0.6832 at 0.7306. However, decisive break of 0.7101 support will confirm short term topping, and bring deeper pullback to 55 D EMA (now at 0.7052) and below.
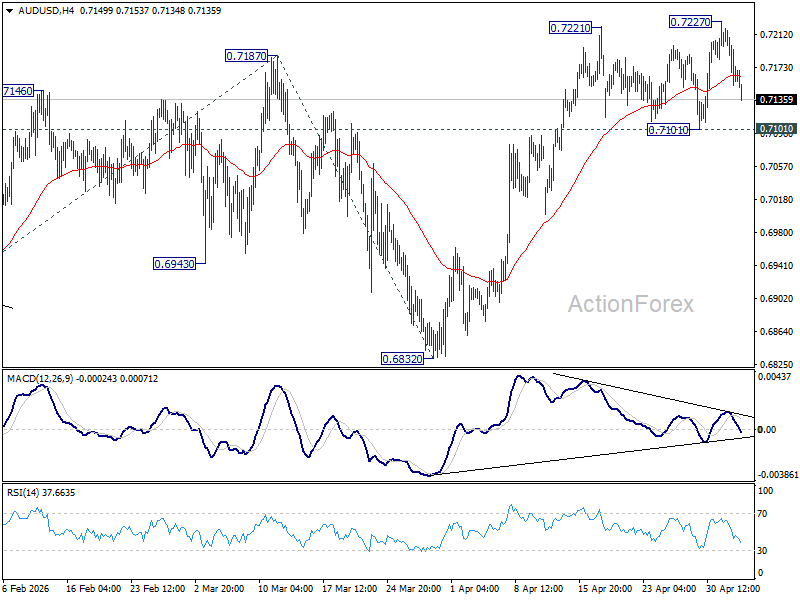
In the bigger picture, rise from 0.5913 (2024 low) is still in progress. Decisive break of 61.8% retracement of 0.8006 to 0.5913 at 0.7206 will solidify the case that it's already reversing the down trend from 0.8006 (2021 high). Further rally should then be seen to retest 0.8006. For now, outlook will remain bullish as long as 0.6832 support holds, in case of pullback.
Dollar Rises as US-Iran Ceasefire Comes Under Strain, Markets Brace for Escalation Without Panic
Dollar is rising as risk aversion creeps back into global markets as the US–Iran ceasefire comes under increasing strain. Developments over the past 48 hours suggest the fragile truce is under mounting pressure, raising the risk of renewed escalation. However, price action indicates investors are bracing for further conflict rather than pricing a full-blown crisis—for now.
The most notable shift is the expansion of the conflict beyond a bilateral US-Iran confrontation. For the first time since the April ceasefire, Iran launched missile and drone strikes against the United Arab Emirates, specifically targeting the Fujairah Petroleum Zone. This marks a clear regionalization of the conflict and introduces a new layer of risk to global energy infrastructure.
At the same time, tensions at sea continue to intensify. The US military confirmed it had sunk seven small Iranian vessels that attempted to interfere with oil tankers being escorted under the “Project Freedom” initiative. The operation, aimed at securing shipping lanes in the Strait of Hormuz, has become a focal point of confrontation, with both sides increasingly willing to engage directly.
Meanwhile, diplomacy is going nowhere. Talks in Islamabad, mediated by Pakistan, have stalled over irreconcilable demands. The US is insisting on “zero enrichment” and the removal of all nuclear material, while Iran is demanding immediate and permanent sanctions relief. The lack of progress suggests that a negotiated de-escalation remains unlikely in the near term.
This combination of military escalation and diplomatic deadlock has created what can be described as a “gray zone” conflict. Both sides are engaging in active hostilities, yet neither has formally declared the ceasefire over. However, unless negotiations produce a breakthrough soon, the transition from a fragile truce to an openly active conflict appears increasingly probable.
Markets are beginning to reflect this shift, albeit in a measured way. Dollar has rebounded broadly and is currently the strongest performer for the week, benefiting from renewed safe-haven demand. Yen is also firm, while commodity-linked currencies such as the Australian and New Zealand Dollars are under pressure.
Despite this shift, price action remains contained. Major currency pairs and crosses are still trading within last week’s ranges, indicating that while investors are hedging against escalation risk, they are not yet positioning for a full crisis scenario. The absence of breakouts suggests that conviction remains limited. Oil markets are sending a similar signal. Brent crude has moved higher in response to the rising tensions but remains well below the critical $120 crisis threshold.
Overall, markets appear to be in a preparatory phase. Investors are adjusting positions to account for rising geopolitical risks, but without the urgency that would accompany a clear escalation into full-scale conflict. This is reflected in steady but controlled moves across asset classes.
In this environment, the key question is not whether risks are rising—they clearly are—but whether they will cross the threshold into a scenario that forces a more aggressive repricing. For now, markets are bracing for escalation, but the lack of panic suggests that investors are still waiting for confirmation before making more decisive moves.
In Asia, at the time of writing, Japan is on holiday, Hong Kong HSI is down -1.29%. China is on holiday. Singapore Strait Times is down -0.58%. Overnight, DOW fell -1.13%. S&P 500 fell -0.41%. NASDAQ fell -0.19%. 10-year yield jumped 0.07 to 4.45.
RBA Hikes to 4.35%, Signals It’s Not Done Yet
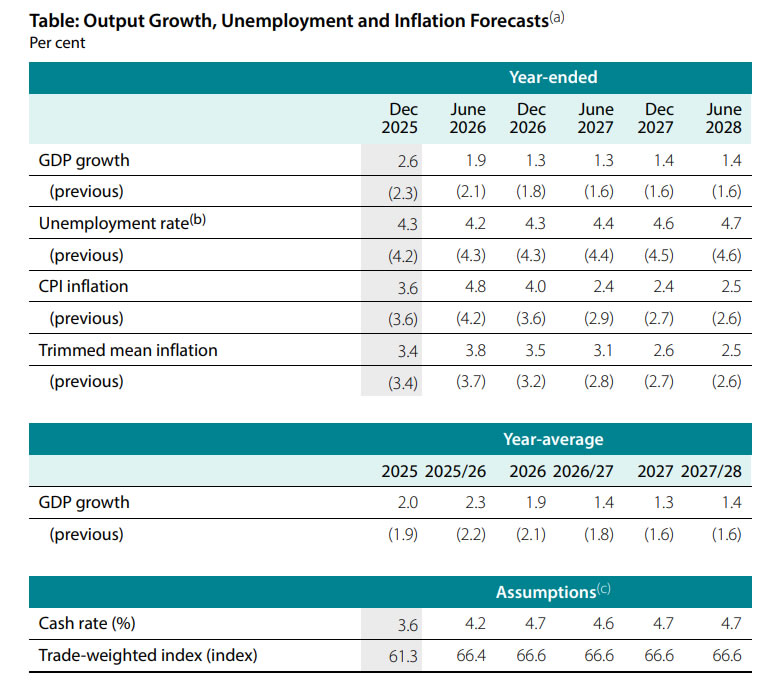
RBA raise interest rate as expected, and signaled a clear shift to higher-for-longer policy. Inflation is now expected to peak higher and fall more slowly, while growth forecasts are being downgraded. With rates projected near 4.7% through 2028, the central bank is preparing for a prolonged fight against persistent price pressures. Read more.
Gold Slides on Hormuz Attacks, 4,400 Breakdown in Focus, 4,000 Next
Gold is under renewed pressure as Hormuz tensions escalate and oil prices surge. Iran’s attacks on ships and a UAE oil port have intensified supply fears, lifting the Dollar and shifting focus back to inflation risks. With 4,400 support now under threat, a breakdown could accelerate the slide toward the 4,000 level. Read More.
Fed’s Williams Downplays Split, Says Policy Agreement Remains Strong
Fed’s Williams is pushing back on fears of a divided central bank. Despite recent dissent, he says policymakers largely agree on the current stance, with rates well positioned amid rising uncertainty. With no urgency to hike and limited guidance ahead, the Fed remains firmly in wait-and-see mode. Read More.
IMF’s Georgieva Warns Adverse Scenario Already Unfolding as War Persists
The IMF is signaling a major shift in the global outlook. Georgieva says the baseline scenario is no longer valid, with the economy already moving into a worse path as war-driven oil prices fuel inflation. If the conflict continues, risks of even slower growth and unanchored inflation expectations could rise sharply. Read More.
AUD/USD Daily Report
Daily Pivots: (S1) 0.7180; (P) 0.7204; (R1) 0.7225; More...
Intraday bias in AUD/USD is turned neutral first with current extended retreat. Further rise will remain in favor as long as 0.7101 support holds. On the upside, break of 0.7227 will resume recent up trend to 61.8% projection of 0.6420 to 0.7187 from 0.6832 at 0.7306. However, decisive break of 0.7101 support will confirm short term topping, and bring deeper pullback to 55 D EMA (now at 0.7052) and below.
In the bigger picture, rise from 0.5913 (2024 low) is still in progress. Decisive break of 61.8% retracement of 0.8006 to 0.5913 at 0.7206 will solidify the case that it's already reversing the down trend from 0.8006 (2021 high). Further rally should then be seen to retest 0.8006. For now, outlook will remain bullish as long as 0.6832 support holds, in case of pullback.
RBA Hikes Interest Rate to 4.35%, Signals It’s Not Done Yet
The RBA has made one thing clear: it is not done yet. By lifting the cash rate to 4.35%, with the decision backed by an 8–1 majority, and signaling a path toward 4.7% by the end of 2026, the central bank is shifting decisively into a higher-for-longer stance as inflation proves more persistent than expected.
The problem is not just that inflation is high—it is that it is becoming entrenched. The RBA acknowledged that price pressures picked up sharply in the second half of 2025 and are now being reinforced by the global energy shock triggered by the Middle East conflict. Fuel and commodity prices are rising, firms are beginning to pass on costs, and short-term inflation expectations are moving higher.
The updated projections confirm that the situation has deteriorated. Headline inflation is now expected to peak at 4.8% in mid-2026, significantly higher than previously forecast (4.2%), while core inflation remains sticky at 3.5% even by the end of the year. The return to target is delayed, with inflation only easing back toward acceptable levels in mid-2027.
But tightening comes at a cost. Growth forecasts have been cut, with GDP now seen at 1.9% in 2026 and slowing further to 1.3% in 2027. The RBA is effectively acknowledging that restraining inflation will require weaker economic momentum.
The real signal lies in the rate path. A projected cash rate of 4.7% suggests more hikes ahead, and importantly, a prolonged period at restrictive levels through 2028. This is not a quick tightening cycle—it is a sustained effort to bring inflation back under control.
At the same time, risks are rising on both sides. A prolonged conflict in the Middle could push energy prices even higher, driving inflation further up while simultaneously dragging on growth.
In short, the RBA is confronting a more difficult reality: inflation is higher, growth is weaker, and the policy response will need to be stronger and longer-lasting. The shift to a higher terminal rate and extended hold confirms that the fight against inflation is far from over.
(RBA) Statement by the Reserve Bank Board: Monetary Policy Decisions
At its meeting today, the Board decided to increase the cash rate target by 25 basis points to 4.35 per cent.
Inflation picked up materially in the second half of 2025, and information since the beginning of this year confirms that some of this increase reflected greater capacity pressures. In addition, the conflict in the Middle East has resulted in sharply higher fuel and related commodity prices, which are already adding to inflation. There are early signs that many firms experiencing cost pressures are looking to increase prices of their goods and services. Short-term measures of inflation expectations have also risen.
The Bank has updated its forecasts to incorporate recent data and developments in the Middle East. The baseline forecast, which assumes that the conflict is resolved soon and fuel prices decline, sees underlying inflation peaking higher than was expected in February. It then declines as demand growth slows and capacity pressures ease in response to higher interest rates.
Financial conditions have tightened this year. Money market interest rates and government bond yields have risen, and the exchange rate has appreciated. But credit is readily available to both households and businesses.
There are materially heightened uncertainties about the outlook for domestic economic activity and inflation. With the conflict in the Middle East continuing, there are plausible scenarios where inflation is higher and activity lower than envisaged under the baseline forecast. A longer or more severe conflict could put further upward pressure on global energy prices; this would push up near-term inflation and could also increase inflation further out as these costs are passed through and if price rises get built into longer term inflation expectations. But higher prices and prolonged uncertainty may cause growth to be lower in Australia’s major trading partners and also in Australia.
Decision
As expected, developments in the Middle East are having an impact on inflation. Higher fuel prices are adding to inflation and there are indications that this is likely to have second-round effects on prices for goods and services more broadly. This inflation impulse is in addition to the high inflation recorded around the start of 2026, reflecting capacity pressures in the economy.
In light of these considerations, the Board assessed that inflation is likely to remain above target for some time and that the risks remain tilted to the upside, including to inflation expectations. It was therefore judged appropriate to increase the cash rate target.
The Board will be attentive to the data and the evolving assessment of the outlook and risks to guide its decisions. In doing so, it will pay close attention to developments in the global economy and financial markets, trends in domestic demand and the outlook for inflation and the labour market. Having raised the cash rate three times, monetary policy is well placed to respond to developments and the Board is focused on its mandate to deliver price stability and full employment. It will do what it considers necessary to achieve that outcome.
Today’s policy decision was made by majority: eight members voted to increase the cash rate target by 25 basis points to 4.35 per cent; one member voted to leave the cash rate target unchanged at 4.10 per cent.
Markets Brace for RBA Decision and US Services PMI Looms
Key takeaways
- Macro risks and policy divergence in focus: Markets are bracing for the Reserve Bank of Australia rate decision, while strong US data reinforces a “higher-for-longer” Fed stance. Meanwhile, escalating US–Iran tensions have pushed oil prices higher, keeping geopolitical risk elevated.
- Cross-asset pressure from rising yields: Elevated real yields are weighing on growth stocks and gold, while the US dollar holds firm within its range. Oil remains supported above $100, maintaining a bullish structure amid supply disruption concerns.
- Key market drivers ahead: The spotlight is on the RBA decision, US ISM Services PMI, and Fed commentary, with FX (especially AUD and JPY), equities, and commodities poised for volatility depending on policy signals and macro data.
- Chart of the day: WTI crude minor bullish structure remains intact above $100.20 key support. Next intermediate resistances at 112.84 and $116.56/119.54
Top macro headlines
- RBA rate decision in focus: Markets are fully priced for the Reserve Bank of Australia to hike rates today by 25 bps to 4.35% on the cash policy rate (third consecutive time), the accompanying statement and press conference are crucial for hints on whether the RBA will remain on a longer hawkish path.
- US manufacturing resilience: Recent factory orders data for March outperformed expectations (actual: 1.5% m/m, consensus: 0.5%, Feb: 0.3% revised from 0%), reinforcing the "higher-for-longer" narrative for the Federal Reserve and keeping US Treasury yields elevated.
- Middle East peace talks stagnate: The month-long US-Iran ceasefire agreement, since 8 April, is now in jeopardy as the US and Iran exchanged fire in the Persian Gulf over the US Navy’s facilitation of the passage of two US-flagged ships through the Strait of Hormuz. Iran also attacked the UAE with ballistic missiles, cruise missiles, and drones. Brent crude rallied by 4.5% to close Monday’s US session at $114.07/bbl.
- Yen intervention watch: Following last week's dramatic moves where the USD/JPY plunged 2.4% on Thursday, 30 April, from a high of 160.73, the pair has stabilized near 156.50, but traders remain cautious of potential secondary intervention from Tokyo during the London/NY overlap.
Key macro themes
- Monetary policy divergence: A clear divide is emerging between the Fed's wait-and-see approach and the potential for selective tightening in APAC (Australia/Japan) to combat imported inflation.
- The return of real yields: As inflation expectations stabilize but nominal yields remain high, rising real yields are starting to pressure speculative growth stocks and non-yielding assets like gold. The recent rebound (Wed to Fri) seen in gold (XAU/USD) has fizzled out at US$4,645, right below its 20-day moving average (US$4,700), acting as a key near-term resistance.
- Supply chain realignment: Weekend discussions on trade tariffs continue to drive institutional rotation into domestic-centric industrial plays and away from globalized consumer staples.
Global market impact (last 24 hours)
- Equities: S&P 500 futures are flat in early trade in today’s early Asian session after the cash index slipped 0.4% on Monday. Technology stocks' outperformance is cooling as semiconductor stocks digest recent gains.
- Fixed Income: The US 10-year yield is hovering near 4.15%. Curve inversion remains a primary concern for credit markets.
- FX: The DXY rose for the second consecutive session, holding above its 97.95 key near-term support, but remains capped below its 99.16 near-term range resistance since 8 April. EUR and GBP trimmed last Thursday’s gains on rising geopolitical tensions in the Middle East. AUD shed -0.5% to 0.7167 ahead of the RBA decision but still holding above its 20-day moving average at 0.7145.
- Commodities: Brent and WTI crude are steady at around $113/bbl and $107/bbl. Gold (XAU/USD) remains soft after Monday’s 1.9% decline. It is now trading at $4,521, testing last Wednesday, 29 April low of $4,510.
Asia Pacific impact
- Stock markets: The ASX 200 is trading cautiously ahead of the RBA. The Hang Seng Index and China A50 may find support above 25,675 and 15,375, respectively, despite a firm yuan, given elevated oil prices. Japan is closed for a holiday today.
- Currencies: The AUD/USD is the most volatile pair in the region, currently testing 0.6620. The JPY is largely rangebound but remains the primary source of volatility in regional carry trades.
- Regional Outlook: The resilient China manufacturing PMI data (staying above 50) released last week is providing a temporary buffer for Southeast Asian exporters, despite the high global sovereign bond yields environment.
Top 4 Events to watch today
- RBA Interest Rate Decision (AU) - 12:30 pm SGT: Market is expecting a third 25 bps hike to 4.35% on the cash policy rate, reinforced by renewed inflation pressures. Impact: AUD pairs, ASX 200.
- RBA Press Conference (AU) - 1:30 pm SGT: Looking for clues whether the current interest rate hike cycle will extend further. Impact: AUD pairs, ASX 200.
- ISM Services PMI (US) - 10:00 pm SGT: A critical gauge of the dominant sector of the US economy (consensus: 53.7, Mar: 54.0) Impact: USD, US stock indices, Treasuries.
- Fed Bowman Speaks (US) - 10:00 pm SGT: Seeking clues on the Fed's monetary policy stance on elevated oil prices. Impact: Short-end Treasuries, USD.
Chart of the day - WTI crude remains bullish above $100.20
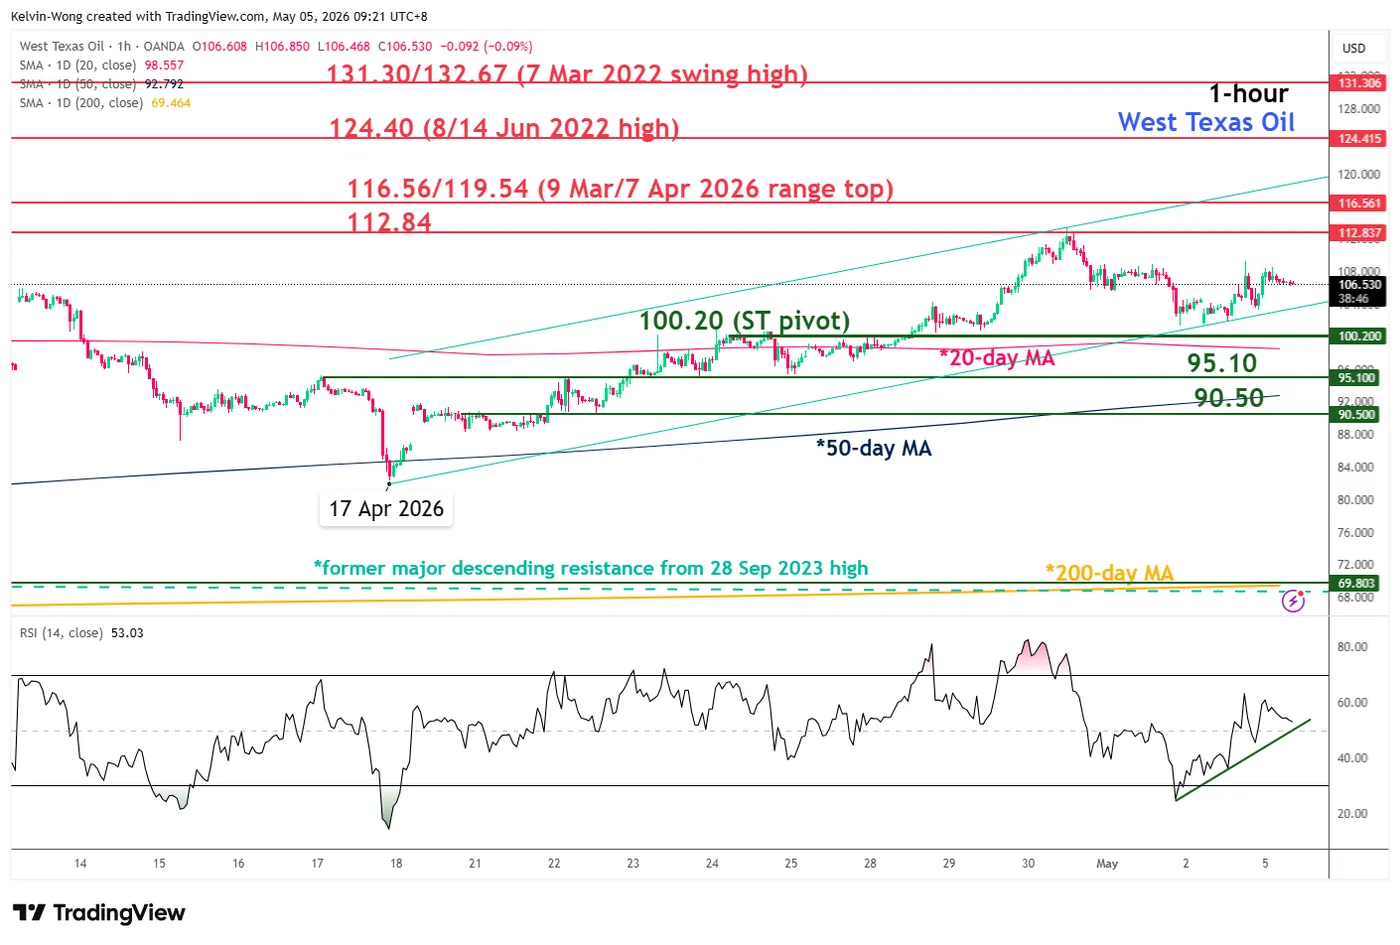
Fig. 1: West Texas oil CFD minor trend as of 5 May 2026 (Source: TradingView)
The price actions of West Texas oil CFD (a proxy of WTI crude futures) remain in a short-term bullish structure as it continues to oscillate within a minor ascending channel in place since 17 April 2026 low.
In addition, the hourly RSI momentum indicator remains supported by an ascending trendline above the 50 level, which suggests short-term bullish momentum remains intact.
Watch the $100.20 short-term pivotal support to maintain a bullish bias. A clearance above $112.84 near-term resistance sees the next intermediate resistances coming in at $116.56/119.54 ( the range top of 9 March/7 April 2026).
However, a break and an hourly close below $100.20 jeopardizes the bullish tone for a minor corrective slide to retest the intermediate supports at $95.10 and $90.50 (also close to the 50-day moving average).
Gold Takes A Blow, Sellers Push Prices Lower Fast
Key Highlights
- Gold started a fresh decline below the $4,650 support.
- A connecting bearish trend line is forming with resistance at $4,610 on the 4-hour chart.
- WTI Crude Oil regained traction and climbed above $105.
- EUR/USD failed to stay above 1.1775 and corrected gains.
Gold Price Technical Analysis
Gold failed to surpass $4,900 and trimmed gains against the US Dollar. The price dipped below $4,750 and $4,650 to enter a bearish zone.
The 4-hour chart of XAU/USD indicates that the price even declined below $4,600, the 100 Simple Moving Average (red, 4 hours), and the 200 Simple Moving Average (green, 4 hours). A low was formed at $4,500, and the price is now consolidating losses.
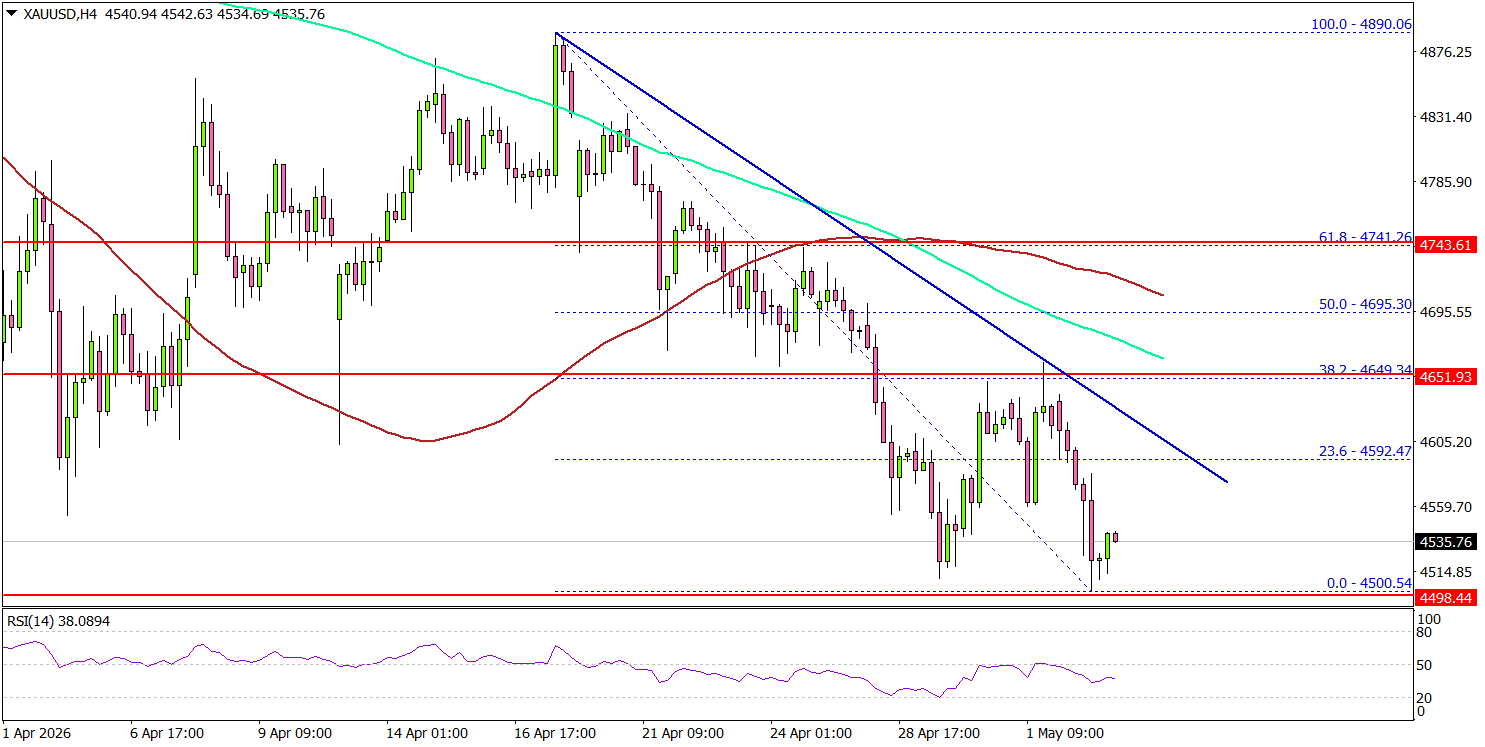
On the upside, immediate resistance is $4,550. The next major resistance sits near $4,600. There is also a connecting bearish trend line forming with resistance at $4,610.
The main resistance could be near the trend line at $4,650. A clear move above $4,650 could open the doors for more upside. In the stated case, the bulls could aim for a move toward $4,740 or even $4,780.
If there is another decline, Gold might find bids near the $4,500 level. The first major support sits at $4,320. The next support could be $4,200, below which the price might slide to $4,150. The main support sits at $4,000. Any more losses might call for a test of $3,800 or even $3,650 in the coming days.
Looking at WTI Crude Oil, the price regained bullish momentum above $100 and might continue to rise in the short term.
Economic Releases to Watch Today
- US ISM Services Index for April 2026 – Forecast 53.7, versus 54.0 previous.
- US New Home Sales for Feb 2026 (MoM) – Forecast -0.4% versus -17.6% previous.
Gold Slides on Hormuz Attacks, 4,400 Breakdown in Focus, 4,000 Next
Gold resumed its near-term slide as tensions in the Strait of Hormuz escalated sharply, after Iran struck multiple vessels and set a UAE oil port ablaze. The developments triggered a fresh surge in oil prices and lifted the Dollar on safe-haven demand, reinforcing downside pressure on precious metals. Focus now shifts to the 4,400 Fibonacci support level, with a decisive break likely to open the path toward the 4,000 psychological handle.
The escalation followed the launch of the U.S. naval operation “Project Freedom,” aimed at escorting merchant ships through the Strait. Rather than easing tensions, the move appears to have provoked a direct response from Iran, intensifying maritime confrontation. With expectations growing that shipping disruptions could persist until August or beyond, markets are increasingly pricing in a prolonged supply shock.
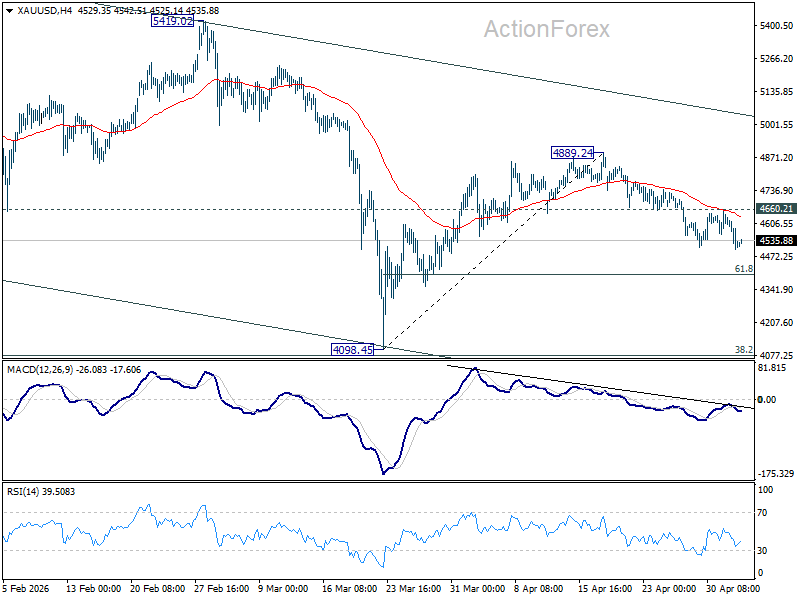
Technically, the near term decline in Gold has resumed after a brief recovery, with rejection at 55 4H EMA (now at 4634.82) reinforcing bearish bias. Deeper fall is expected to 61.8% retracement of 4,098.45 to 4,889.24 at 4,400.53. Decisive break below this level would likely trigger an acceleration of the decline, opening the path toward a retest of 4,098.45 low and potentially extending toward 4,000 psychological level.
On the upside, a break above 4,660.21 would be needed to signal that a temporary bottom is in place. Until then, the bias remains to the downside, particularly if oil prices stay elevated and geopolitical tensions continue to drive inflation expectations higher.
IMF’s Georgieva Warns Adverse Scenario Already Unfolding as War Persists
IMF Managing Director Kristalina Georgieva warned at a conference that the Fund’s baseline outlook is no longer applicable as the Middle East conflict continues. The IMF’s “reference scenario,” which assumed a short-lived war and projected global growth of 3.1% with inflation at 4.4%, is now “further and further behind in the rear-view mirror,” she said.
According to Georgieva, the global economy has effectively shifted into the IMF’s “adverse scenario,” driven by prolonged conflict, oil prices around or above $100 per barrel, and rising inflationary pressures. Under this scenario, global growth slows to 2.5% in 2026, while headline inflation rises to 5.4%, reflecting a more challenging macro environment.
She also warned of significantly worse outcomes if the conflict persists into 2027, particularly if oil prices approach $125. In such a case, inflation would rise further, with a growing risk that inflation expectations become de-anchored—posing a more persistent threat to economic stability.
The IMF had outlined last month three possible paths for the global economy—reference, adverse, and severe scenarios—but current developments suggest a clear shift away from the baseline. With downside risks intensifying, the global outlook is increasingly defined by slower growth and higher inflation.
Fed’s Williams Downplays Split, Says Policy Agreement Remains Strong
New York Fed President John Williams said in a speech monetary policy is “well positioned” to navigate the current environment, signaling no urgency for further tightening even as uncertainty rises due to the Middle East conflict.
Williams emphasized that the Fed is not in a position to offer strong forward guidance, noting that “the future is difficult to see” and risks to both inflation and growth have increased. He added that he does not see any data at present that would justify a rate hike in the near term.
At the same time, Williams maintained that rates will likely need to be lowered eventually as inflation moves back toward the 2% target. He expects inflation to remain around 3% this year, pressured by tariffs and energy costs, before easing, while warning that oil price risks could still surprise to the upside.
On the broader outlook, Williams expects growth of 2.0%–2.25% this year with a stable labor market. While acknowledging recent dissent within the Fed, he downplayed divisions. “I would say there was far more agreement about where policy is today”, he added.
War Fears Tarnish Metals – Silver (XAG/USD) Breaks $75 & Gold (XAU/USD) Tests $4,500
- Silver and Gold can't sustain their previous momentum, seeing renewed bearish flows amid tensions resurfacing
- Their inverted correlation to Oil and the US Dollar remains strong, with the two bouncing back to start the week
- Intraday timeframe analysis for XAG/USD (Silver) and XAU/USD (Gold)
Today, the Middle East conflict has entered yet another dangerous stage.
Although this is the third week of the ceasefire, many now doubt it will hold. In the last 24 hours, Iran reportedly attacked several merchant ships and tankers in the Strait of Hormuz; The conflict has also widened, with direct attacks on the United Arab Emirates and major incidents in Abu Dhabi and Dubai.
With these new tensions, the strong inverse relationship between precious metals, crude oil, and the US Dollar picks up again. Both the US Dollar and Oil prices have jumped at the start of the week, putting extra pressure on the metals market.
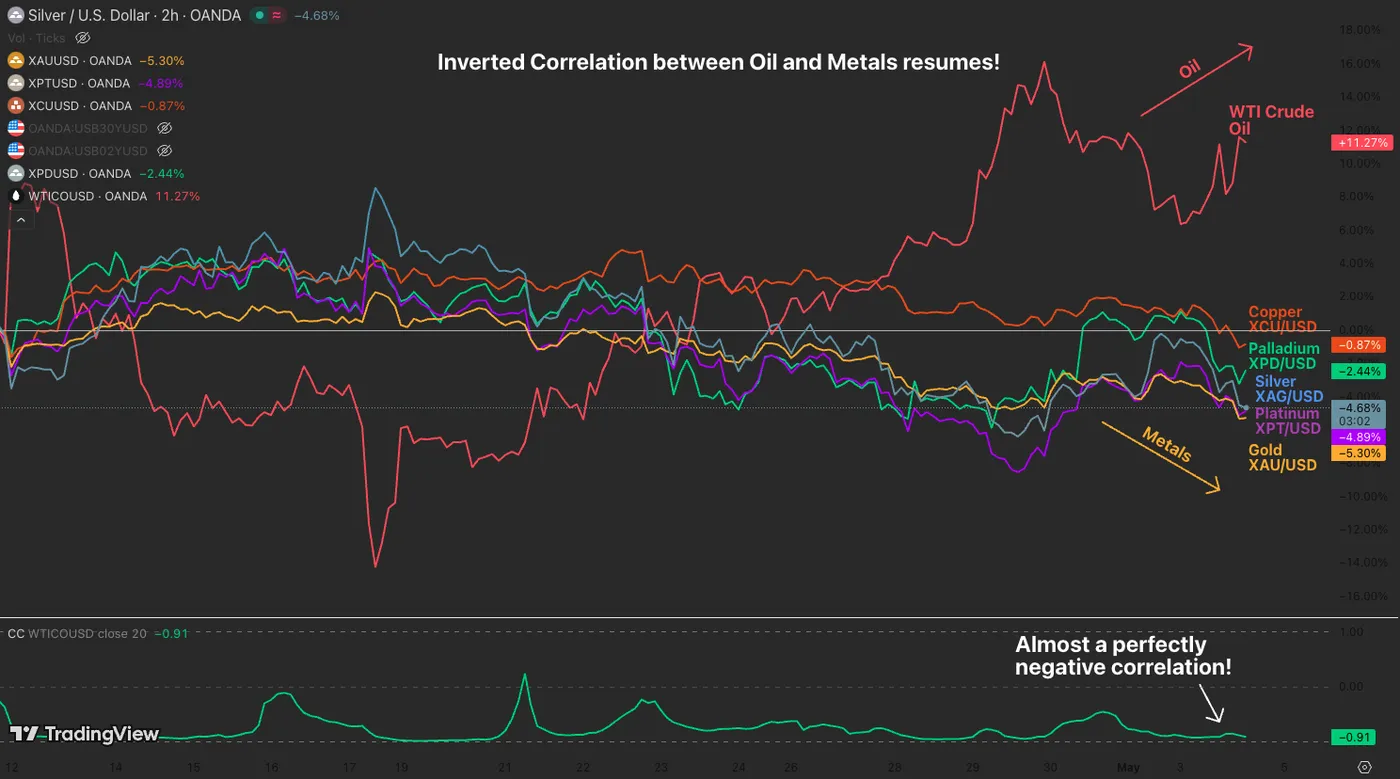
Gold vs WTI Crude Inverse Correlation – Source: TradingView. May 4, 2026
Metals are once again trading more like risk-on assets. Unlike in the past, gold is not acting as a safe haven. Instead, as the conflict continues, the yellow metal along with its precious mates, have seen a steady decline throughout the war.
The asset class is falling sharply amid today's worsening sentiment: Silver is down 5% on the session session, Platinum is now trading well below $2,000, and Copper prices have fallen far from their recent $6 highs.

Daily Metals Performance. Courtesy of Finviz – May 4, 2026
Are precious metals no longer seen as safe havens?
This ongoing war is serving as a crucial test of that historic Market assumption. However, to console aficionados of the alternative asset class, the ultimate flight-to-quality assets—government bonds (US Treasuries particularly)—are also getting heavily battered by these flows.
At the heart of these moves are worries about inflation.
High oil prices and supply chain problems are pushing interest rates higher for longer. While metals are falling faster than stocks right now, this sharp drop could trigger more trouble ahead for all financial markets.
Let's explore the recent shifts in an intraday timeframe analysis of Gold (XAU/USD) and Silver (XAG/USD) to identify where are the key levels to watch ahead.
Gold (XAU/USD) 4H Chart and levels
Gold (XAU/USD) 4H Chart, May 4, 2026 – Source: TradingView
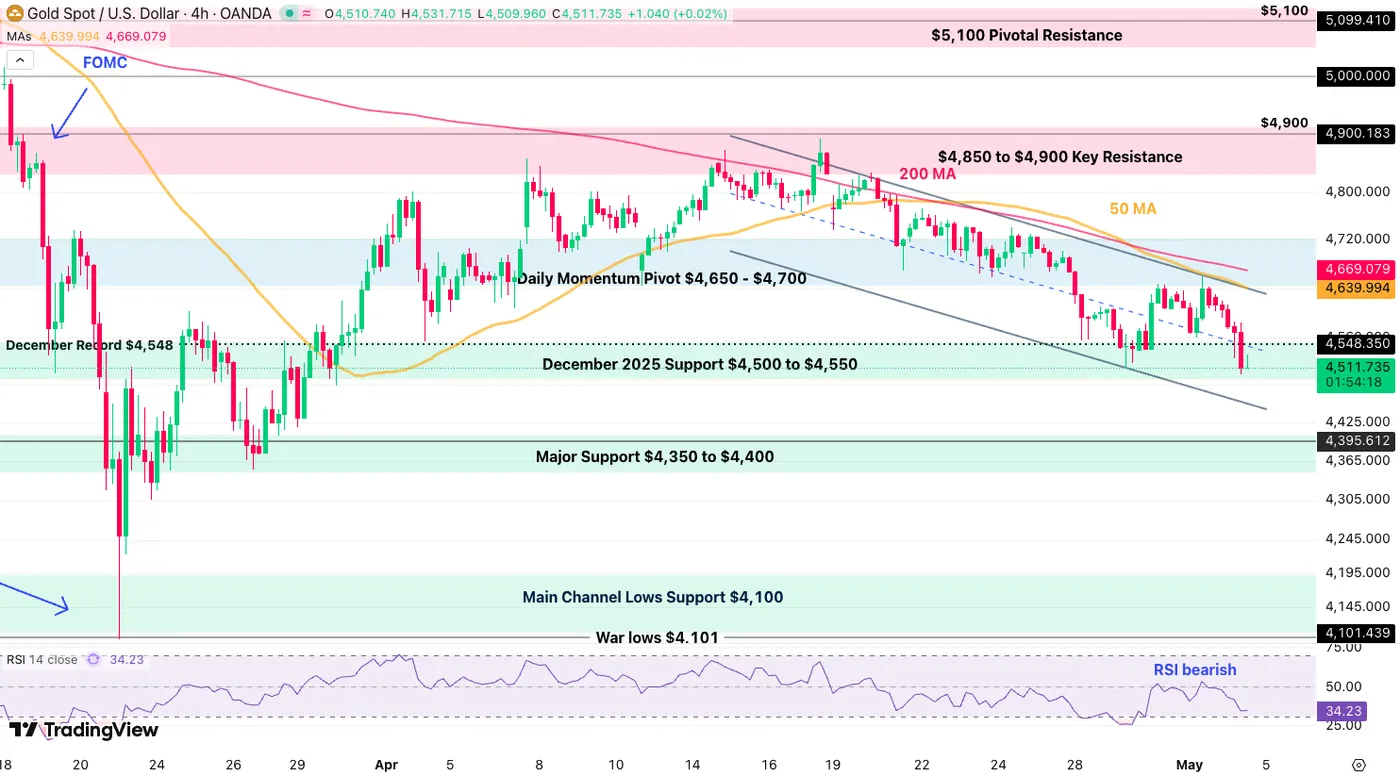
The ongoing rejection in Gold has been severe, with a clear downward channel forming throughout the past week.
Currently testing its $4,500 support, similar as last week lows after rejecting its 4H 50-period MA, bulls will have to show up to avoid an important support break.
- Breaking below the level opens the door to $4,400
- The 200-day MA comes next at $4,280
- Any continuation will retest the $4,100 War lows
- To regain a bullish momentum, the metal will need to rebound in the current support to break above the bear channel and 4H 50-period MA ($4,640)
Intraday Timeframe Levels to watch for Gold (XAU/USD):
Resistance Levels:
- $4,640 - 4,670 4H 50 & 200 MA & Bear Channel (Short-Term) bullish above
- $4,850 to $4,900 Major Resistance (bullish above)
- $5,100 Pivotal Resistance
- $5,400 mini-resistance
Support Levels:
- December 2025 Support $4,500 to $4,550 (bearish below)
- Pivotal Support $4,325 – $4,400
- Main Channel Lows Support $4,100 (Long-term bearish below)
- Next Support $3,880 to $4,000
Silver (XAG/USD) 4H Chart and levels
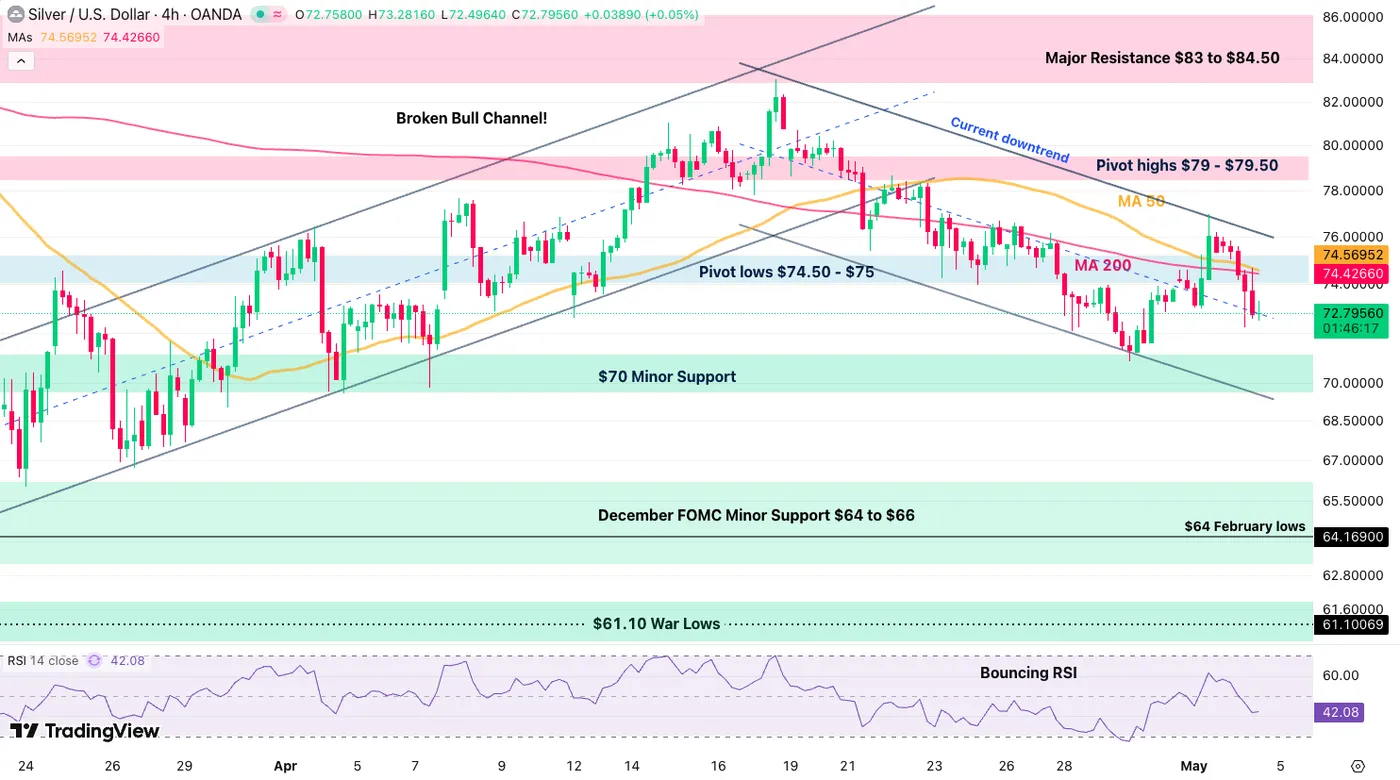
Silver (XAG/USD) 4H Chart, May 4, 2026 – Source: TradingView
Silver is also forming a clear downtrend since reaching its top on April 16, officially breaking its $74-$75 pivot Zone and key Moving averages.
The momentum is decisively bearish for now, hence short-term traders will want to either enter on a retest of the $74 Moving average bands or through a sell stop below $72.
The next stop for the metal is at $70, with this level being a final test before at ~10% drop to $63-$64.
- The war lows would come next at $61
- To inverse the bearish momentum, bulls will want to see a daily close above $76
- A short-term bullish breakout confirms above $80
Higher Timeframe Levels to watch for Silver (XAG/USD):
Resistance Levels:
- Pivot lows $74.50 - $75 (bullish above)
- Pivot highs $79 - $79.50 (4H 200-period MA – bullish above)
- $84 Major level
- Key Range Resistance $90 to $92
- $96.47 March highs (higher odds of All-time highs if break above)
- Current Record $121.67
Support Levels:
- $70 - $72 Minor Support (recent bounce – Bearish below)
- December FOMC Minor Support $64 to $66
- $61.10 Past Session lows
- $50 to $55 October Resistance now Major Support
- Silver's 2011 All-time highs $49.81
Safe Trades and May the 4th be with you!