Sample Category Title
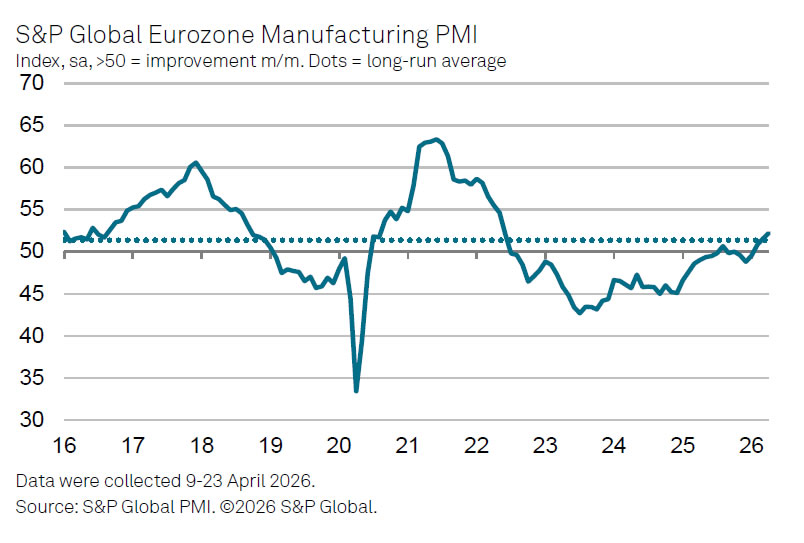
Eurozone PMI Manufacturing at Multi-Year High as War Triggers Record Cost Pressures
Eurozone Manufacturing PMI was finalized at 52.2 in April, rising from March's 51.6 and marking a 47-month high, signaling a broad-based expansion across the bloc. Notably, all eight countries covered in the survey registered readings above the 50 threshold for the first time since June 2022.
The improvement was also reflected in output, with the Manufacturing PMI Output Index climbing from 52.0 to 52.3, an eight-month high. However, the underlying drivers of this growth raise concerns. Survey evidence suggests that production and new orders are being supported by precautionary stockpiling, as firms build inventories amid fears of supply disruptions linked to the Middle East conflict.
At the same time, inflation pressures are intensifying sharply. Input price inflation surged to its highest level in nearly four years, with firms passing on these costs at the fastest pace since January 2023. The scale of the increase is historically significant, with selling price inflation recording its strongest jump since the survey began in 1997, highlighting the severity of the cost shock.
According to S&P Global’s Chris Williamson, the data present a troubling mix for policymakers. While headline PMI figures appear robust, forward-looking indicators show deteriorating confidence, with future output expectations falling to a one-and-a-half-year low. The combination of slowing demand outlook and escalating cost pressures suggests that current growth may prove short-lived.
Gold Builds Momentum While WTI Crude Oil Faces Renewed Selling Pressure
Gold price is consolidating above the $2,565 support zone. Crude oil is showing bearish signs and might decline below $96.50.
Important Takeaways for Gold and WTI Crude Oil Prices Analysis Today
- Gold price started a recovery wave from $4,500 against the US Dollar.
- It cleared a key bearish trend line with resistance at $4,620 on the hourly chart of gold at FXOpen.
- Crude oil prices failed to clear the $108 region and started a fresh decline.
- There is a connecting bearish trend line forming with resistance at $100.45 on the hourly chart of XTI/USD at FXOpen.
Gold Price Technical Analysis
On the hourly chart of Gold at FXOpen, the price found bids near the $4,500 zone. The price remained in a bullish zone and started a recovery wave above $4,550.
There was a decent move above the 50-hour simple moving average and $4,600. The bulls pushed the price above the 50% Fib retracement level of the downward move from the $4,740 swing high to the $4,510 low.
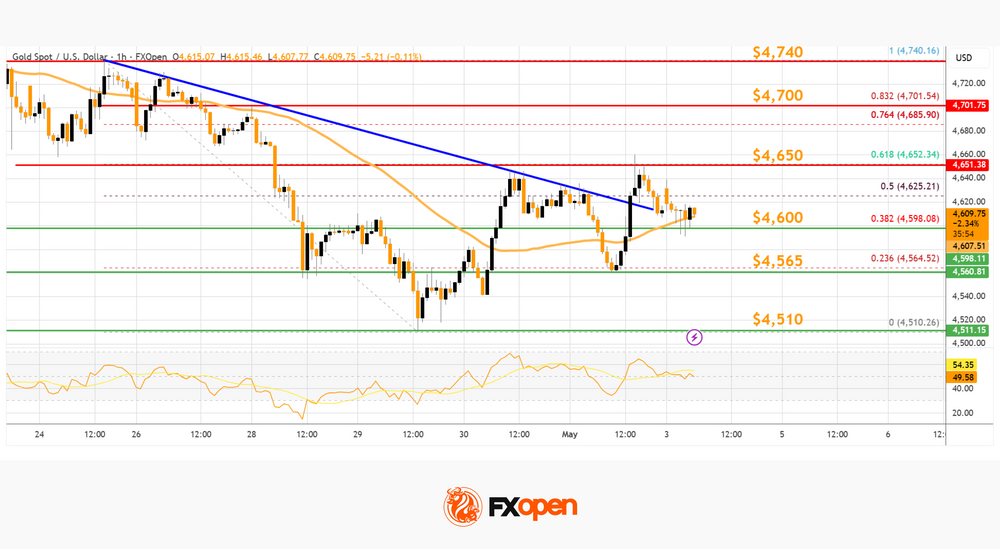
Besides, the price cleared a key bearish trend line with resistance at $4,620. Immediate hurdle is near the 61.8% Fib retracement at $4,650.
The next key breakout level sits at $4,700. An upside break above $4,700 could send Gold price toward $4,740. Any more gains may perhaps set the pace for an increase toward $4,850.
Initial bid zone on the downside could be $4,600. The first major buy zone sits at $4,565. If there is a downside break below $4,565, the price might decline further. In the stated case, the price might drop toward $4,510. Any more losses might push the price toward the $4,420 level.
WTI Crude Oil Price Technical Analysis
On the hourly chart of WTI Crude Oil at FXOpen, the price struggled to clear the $108 barrier against the US Dollar. The price started a fresh decline below $105.
The price even dipped below $100 and the 50-hour simple moving average. The bulls are now active near $96.00. A low was formed at $96.04, and the price is now consolidating losses. If there is a fresh increase, it could face sellers near the 23.6% Fib retracement level of the downward move from the $107.62 swing high to the $96.04 low.
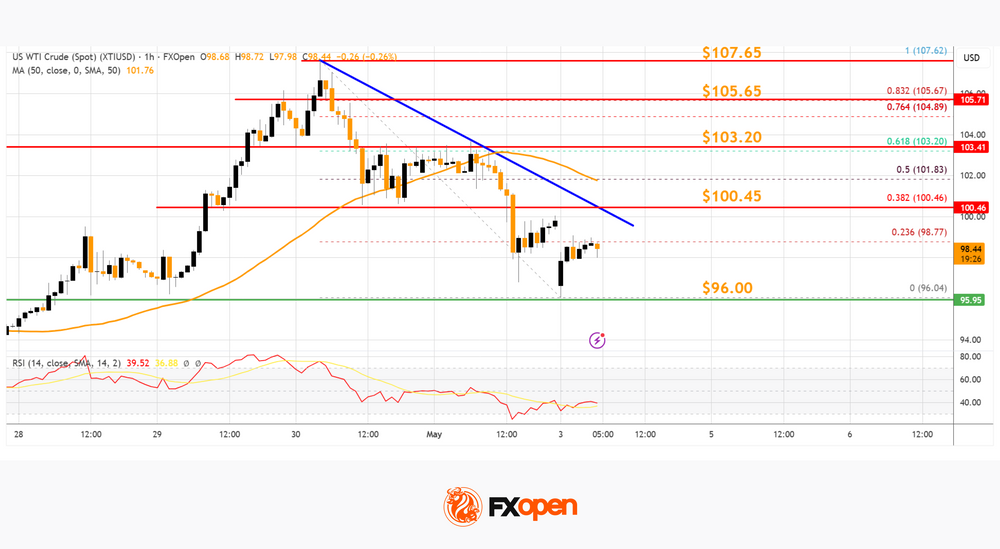
The first major hurdle for the bulls could be near a connecting bearish trend line at $100.45, above which the price could rise and test the 61.8% Fib retracement level at $103.20.
Any more gains might send the price toward $105.65. The main breakout zone sits at $108. Conversely, the price might continue to move down and revisit $96.00. The next major pivot zone on the WTI crude oil chart is $92.00.
If there is a downside break, the price might decline toward $90.00. Any more losses may perhaps open the doors for a move toward the $86.50 support zone.
FXOpen offers the world's most popular cryptocurrency CFDs*, including Bitcoin and Ethereum. Floating spreads, 1:2 leverage — at your service (additional fees may apply). Open your trading account now or learn more about crypto CFD trading with FXOpen.
*Important: At FXOpen UK, Cryptocurrency trading via CFDs is only available to our Professional clients. They are not available for trading by Retail clients. To find out more information about how this may affect you, please get in touch with our team.
Start trading commodity CFDs with tight spreads (additional fees may apply). Open your trading account now or learn more about trading commodity CFDs with FXOpen.
This article represents the opinion of the Companies operating under the FXOpen brand only. It is not to be construed as an offer, solicitation, or recommendation with respect to products and services provided by the Companies operating under the FXOpen brand, nor is it to be considered financial advice.
Sunrise Market Commentary
Markets
Focus went to the US last Friday with several European markets closed for May Day holiday. The US manufacturing ISM for the month of April was the defining intraday moment. While the headline ISM stabilized at 52.7, markets there was a striking further rise in the prices paid component (84.6 from 78.3) which hit its highest level since March 2022. There were 46 commodities reported up in price (vs 24 in March). ISM manufacturing chair Spence warned that prices in the US were already rising precipitously by the time the war started, suggesting that the pressure is more widespread. New orders inched up to 54.1 while the employment number stayed below the 50 equilibrium mark for the 31st straight month. US interest rate markets trade volatile around the release with an initial spike lower soon reversed. The spike lower coincided with Brent crude moving from around $111/b to $108/b. At the end of the day, there was a minor flattening with the front end up 1 bp and the long end down 1 bp. The slightly lower oil price correlated with a slightly weaker dollar intraday with EUR/USD setting a top near 1.1780. USD/JPY holds in the 156-157 area reached after Thursday’s FX interventions by the MoF.
Today’s trading volumes are skinned by public holidays in Japan, China and the UK. Risk sentiment on other bourses if positive this morning with SK Hynix and Samsung lifting spirits. They catch up with end of last week’s tech rally given local equity market closure. US President Trump’s “Operation Freedom” draws most attention this morning as he suggested that the US will begin guiding some neutral ships through Hormuz. The US Navy won’t be involved but the Central Command said that it would provide military support including guided-missile destroyers, aircraft and drones. Markets aren’t running ahead of themselves as Iran responded that such US infringement would be considered as violation of the cease-fire. Today’s eco calendar won’t inspire but an avalanche of ECB speakers and the central bank’s professional forecaster survey might do. First comments since last week’s policy meeting hinted at action in June. ECB Muller talked about an increasing likelihood of higher policy rates because of first signs of pass-through of higher energy prices and the fact that the latter will probably remain high for some time to come. German Bundesbank Nagel called a June hike appropriate if the outlook doesn’t markedly improve. He echoed ECB president Lagarde in that we are move away from the March baseline scenario which by the way already entailed a more restrictive monetary policy. ECB Makhlouf voiced concern about increasing inflation risks while the likes of Kocher, Sleijpen, Dolenc and Rehn referred to coming data to assess potential second round effects. EMU money markets attach a 90% probability to a June rate hike and almost discounting a cumulative 75 bps of tightening by year-end.
News & Views
Seven Members of the OPEC+ cartel (Saudi Arabia, Russia, Iraq, Kuwait, Kazakhstan, Algeria, and Oman) on Sunday had a virtual meeting and decided to a further rise in the production quota by 188k b/d by scaling back previous production caps. The decision comes as the United Arab Emirates (UAE) left the Cartel on April 28. The move is largely seen as symbolic as several members of the Cartel are not in a position to easily export higher production through the Strait of Hormuz and as production facilities have to be restored due to the impact of the war. UAE’s main oil company Adnoc in the meantime on Sunday also announced plans to accelerate production growth plans by committing $55bn investments to expand production capacity over the period 2026-2028.
Rating agency Fitch in a note at the end of last week indicated that structurally large fiscal deficits will keep the US’s debt burden far above that of other ‘AA’ category sovereigns. Fitch analyses that that US fiscal position will deteriorate further this year due to the tax cuts of the One Big Beautifull Bill even as half of this will be offset by tariff revenues. Fitch still expects a US general government deficit of 7.9% of GDP this year and next. This is expected to push an already high debt level above 120% by next year. Ageing-related spending pressures are increasing with social security and Medicare trust funds projected to be depleted within a decade. Fitch also mentions durability and revenue yield of tariffs and President Donald Trump’s call for higher defense spending as additional sources of fiscal uncertainty. The agency also mentions the Mid-term elections as important for fiscal governance and policy execution.
Don’t Sell in May
The new week kicks off on optimism – not that the Iranian war is coming to an end, and to be honest I try to look past the headlines as US leaders’ statements sound nothing more compelling than cheap propaganda – but on optimism that AI continues to mask the pain elsewhere, and that the picture for US manufacturers remains unclear as Friday’s data sent mixed signals. The Atlanta Fed’s GDPNow forecast suggests that US economic growth may have accelerated to 3.5% in Q2 from around 2% in Q1, though it was revised slightly down from 3.7%. But anyway, corporate earnings clearly hint at resilience. With 63% of S&P 500 companies having reported so far, 84% have posted a positive EPS surprise and 81% a positive revenue surprise, according to FactSet.
Banks and tech companies did particularly well in Q1 – on both sides of the Atlantic. European oil companies have navigated the Middle East chaos and disruptions in the Strait of Hormuz gracefully, while the picture for US players such as ExxonMobil and Chevron is more mixed. Both reported earnings last Friday and beat expectations, but their profits fell in Q1 due to the Iran war disruptions. The reason for this divergence is that US and European oil giants play a different game: Europeans are not just oil producers, they are also major traders. So when disruption hits key routes like the Strait of Hormuz and prices jump, they can profit from the chaos by moving oil around and capturing price gaps, whereas US firms rely more on steady production, and weaker volumes appear to weigh on profitability as the trading upside is missing. In simple terms, oil company results weren’t just about higher prices, but about who could turn volatility into profits. And in Q1, Europeans did better – which is relatively rare.
That said, Exxon and Chevron couldn’t hold on to their better-than-expected results and gave back pre-market gains to finish the session more than 1% lower. For those who don’t like oil price volatility but still want exposure, oil majors remain an interesting play, with European companies standing out in the current context.
Crude oil kicked off the week slightly lower on news that the US would begin guiding ships not involved in the Iran conflict. But geopolitical uncertainty and hectic diplomacy suggest that price volatility will persist. OPEC met over the weekend –without the UAE for the first time in decades – and announced a slight increase in production quotas. However, with many members struggling to move oil due to near-closure conditions in the Strait of Hormuz, the decision is unlikely to impact short-term price dynamics. In the longer run, more supply should mean lower prices, but for now the global economy will continue to grapple with high energy costs.
Spirit Airlines shut down entirely after failing to secure funding or a bailout following years of losses, worsened by a spike in fuel costs linked to the Iran war.
Nonetheless, Asian indices kicked off the week with strong optimism. Japan was closed, but the Kospi rallied more than 4.5% to a fresh all-time high on AI enthusiasm, while TSMC surged nearly 7% in Taiwan. SoftBank – which was hit last week by news that OpenAI had not met internal targets due to rising competition – rebounded nearly 4% on Friday. Nasdaq futures are also leading gains this morning after the index reached a fresh all-time high last week, supported by strong cloud growth from Google, Amazon and Microsoft – seen as a clear sign of accelerating AI adoption.
This week, earnings will continue to flow, with AMD and Arm Holdings in focus for the semiconductor space. The sector has had a stellar month, with VanEck’s semiconductor ETF gaining nearly 40%. Results are expected to be strong, but whether they beat expectations will be key for the continuation of the rally.
On the economic calendar, the Reserve Bank of Australia is expected to hike rates tomorrow to rein in rising inflationary pressures – a hawkish divergence that helps justify the bullish trend in AUDUSD above the 0.72 level. The US dollar, on the other hand, is flat this morning. US jobs data will be the key macro event this week, with forecasts diverging. Bloomberg consensus suggests around 73K new nonfarm jobs last month, though estimates vary widely.
The path of US monetary policy – and elsewhere – will depend on incoming data. European central banks remain focused on inflation, given their single mandate, while the Federal Reserve (Fed) operates under a dual mandate. This means that despite rising inflation risks, weak jobs data could revive dovish Fed expectations. If that happens, the tech sector could attract further inflows – not only because of cost efficiencies partly due to job cuts, but also because softer labour data could lead to lower rates. In that environment, bad news may once again be interpreted as good news, and swimming against this tide – betting on a correction right now – looks like a losing bet, even as we move through May.
Central Bank Decisions and US Jobs Report Take the Spotlight this Week
In focus today
In the euro area, two notable surveys, the ECB's SPF and SMA, will provide insights into analyst expectations for ECB policy rates and the region's economic outlook. The SPF also features special questions about the war in Iran regarding the expected duration of the war, duration of disruptions, and the economic impact. Additionally, the May Sentix investor sentiment indicator and final manufacturing PMI for April will be released.
Danmarks Nationalbank is set to publish its April FX reserve report, shedding light on whether there was any currency intervention as EUR/DKK reached a historic high of 7.4735.
In Sweden, the manufacturing PMI has remained robust, rising further to 56.3 in March. While the overall level will continue to attract attention today, significant focus will be on the subcomponent tracking raw material and input prices, which saw a sharp surge of 9.6 index points last month.
In the US, Fed's Williams is scheduled to speak this afternoon.
Overnight, we expect the Reserve Bank of Australia to hike rates by 25bp. Market pricing suggests an 80% likelihood for the hike, though the decision remains uncertain.
Key labour market reports will dominate the US economic calendar this week, culminating in Friday's jobs report. On Thursday, we expect Norges Bank to hike policy rates by 25 bp, while the Riksbank is expected to leave its policy rate unchanged.
Economic and market news
What happened over the weekend
In US-Iran conflict, Donald Trump announced "Project Freedom," a plan to guide ships through the Strait of Hormuz from Monday, though Iran strongly criticised the move as a violation of the ceasefire. Iranian officials dismissed US claims of positive discussions. Energy markets remain heavily impacted, with US gas prices rising to an average of USD 4.45 per gallon on Sunday, a nearly 50% increase since the conflict began, according to AAA data. Meanwhile, Israeli evacuation orders in southern Lebanon underscored growing regional instability. Despite a temporary pause in US-Israeli bombing, the conflict continues to disrupt energy markets, fuelling inflation risks.
What happened Friday
In the US, the April ISM manufacturing index held steady at 52.7 in April, marking the fourth consecutive month of expansion. However, underlying trends reveal vulnerabilities, with employment contracting and supply chain challenges persisting, including slowing deliveries and low inventories. Prices surged to its highest since 2022, driven by metals, tariffs, and energy costs linked to Middle East tensions, raising inflationary concerns.
Equities: Most equity markets finished higher on Friday across the relatively few markets that were open, again led by tech and growth. One of the most notable developments last week, however, was that we are starting to see the good old negative correlation between equities and bonds returning. There is no doubt that Iran, and of course the higher oil price, has been a major factor, but the very strong earnings season has also had an impact. As a result, last week ended with both higher equities and higher yields. Yes, there is still potential downside risk from Iran and the conflict in the Middle East, but there is also potential upside risk in equities from the strong earnings momentum. The strong earnings backdrop also means that even though equity markets are up around 6-7% year-to-date, not that many of the negative equity voices can point to valuation as the key argument, because returns primarily have been driven by positive earnings growth.
On Friday, tech lifted not only hardware, but also software, and we are increasingly seeing the largest part of the HALO trade is now behind us, also given the valuation differentiation we now have within the tech space. When talking about technology, look at Asia this morning. Asian markets are higher, driven by tech. If in doubt, look at South Korea and Taiwan this morning. We will not mention the numbers here, check your own monitors if you are in doubt about the tech run we are currently in. European futures are in a small catch-up move this morning, while US futures are close to flat, with support still coming from the tech side.
FI and FX: The focus remains on the war between Iran and US and the closure of the Strait of Hormuz. The continued uncertainty surrounding the war and the rise in the oil price is putting pressure on global bond yields and interest rates. Last week, the 2Y Treasury rose 10bp despite a small setback. 10Y US Treasury yields rose 7bp. In Europe, 2Y and 10Y German government bond yields rose 10bp and 4bp, respectively. We are pricing less than 1 cut in the US and 3 hikes by ECB in 2026. In the currency market, EURUSD has been trading above the 1.17-level, while it looks like there was intervention in JPY last week, which suddenly strengthened the JPY versus the USD and moved the cross towards 156, but there has been no official confirmation. This morning EURUSD is trading above 1.17 and USDJPY dipped shortly below 156.
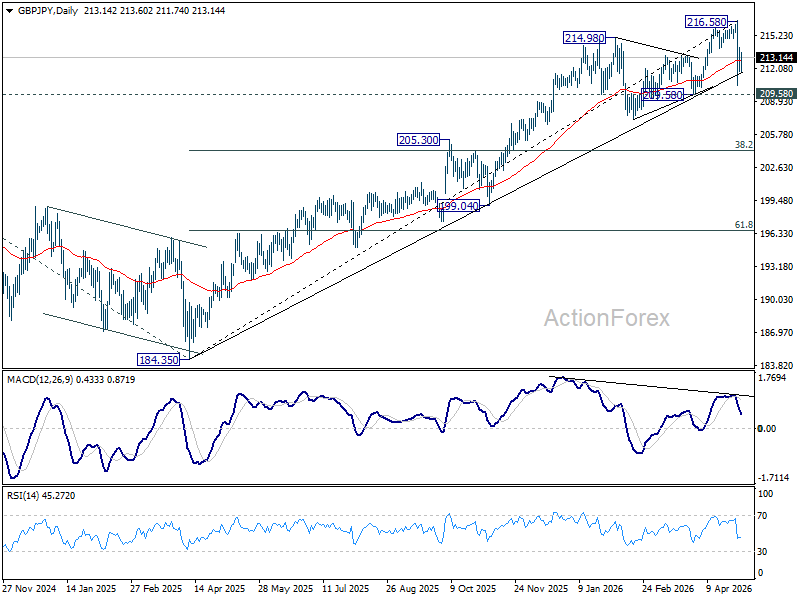
GBP/JPY Daily Outlook
Daily Pivots: (S1) 212.00; (P) 213.04; (R1) 214.26; More...
Intraday bias in GBP/JPY remains neutral for the moment. Risk will stay on the downside as long as 55 4H EMA (now at 214.53) holds. Below 210.43 will target 209.58 support first. Break will target 38.2% retracement of 184.35 to 216.58 at 204.28.
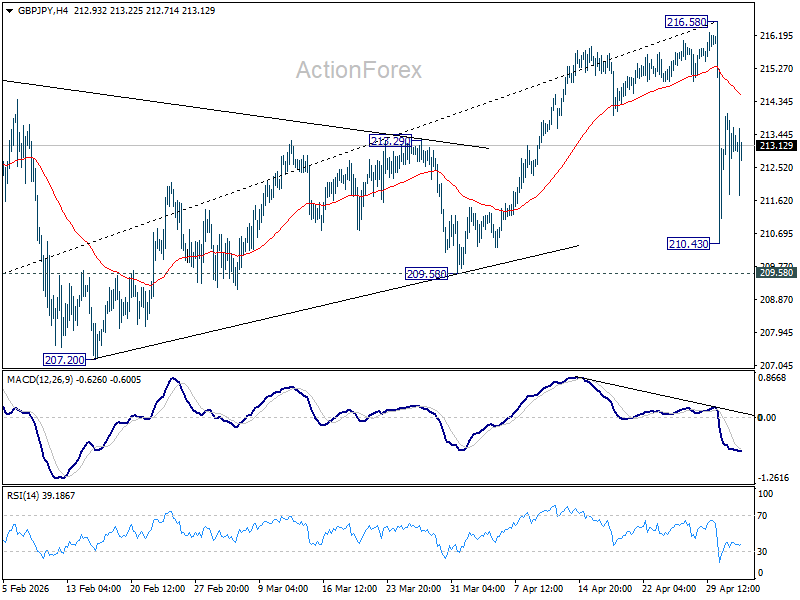
In the bigger picture, while the fall from 216.58 is steep, there is no clear sign of trend reversal yet. The long term up trend could still extend to 61.8% projection of 148.93 (2022 low) to 208.09 (2024 high) from 184.35 at 220.90 on resumption. However, sustained break of 55 W EMA (now at 205.45) will argue that it's already in medium term down trend for 184.35 support.
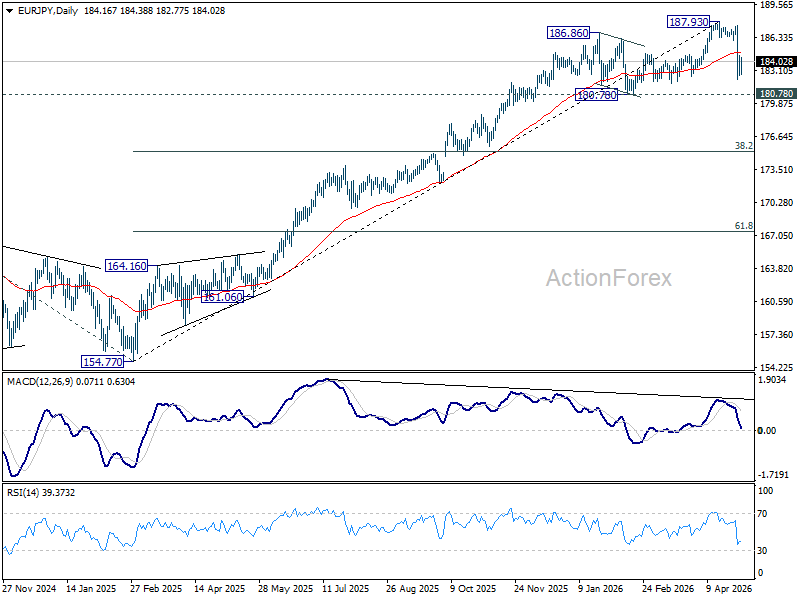
EUR/JPY Daily Outlook
Daily Pivots: (S1) 182.95; (P) 183.78; (R1) 184.92; More...
Intraday bias in EUR/JPY remains neutral for the moment. Risk will stay on the downside as long as 55 4H EMA (now at 185.79) holds. Below 182.28 will extend the fall from 187.93 to 180.78 support.
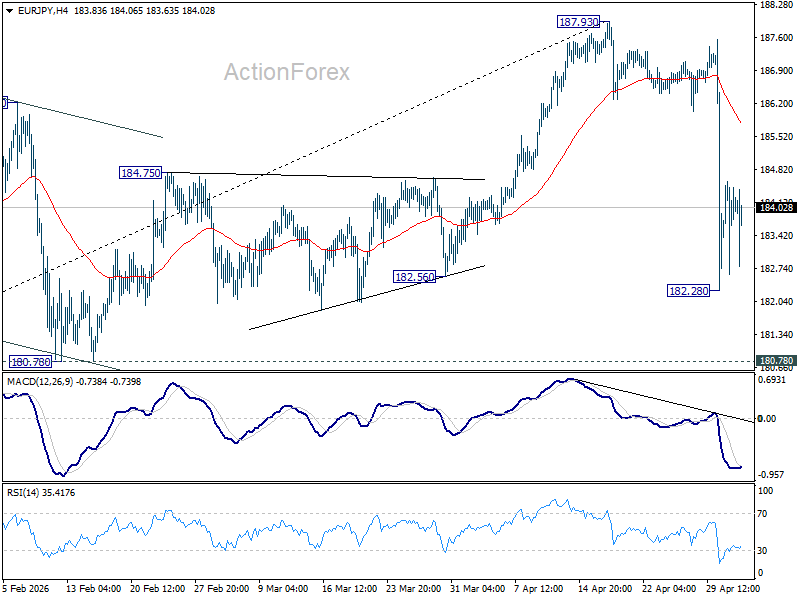
In the bigger picture, the pullback from 187.93 is steep, there is no sign of reversal yet. Uptrend from 114.42 is still expected to resume at a later stage to 78.6% projection of 124.37 (2022 low) to 175.41 (2025 high) from 154.77 at 194.88. However, sustained break of 55 W EMA (now at 177.76) will argue that it's already in a medium term down trend to 175.41 resistance turned support and below.
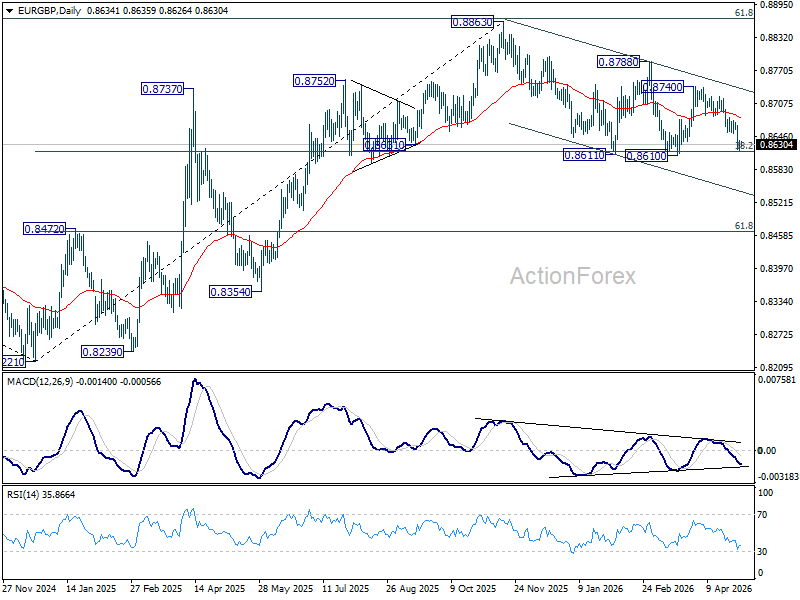
EUR/GBP Daily Outlook
Daily Pivots: (S1) 0.8623; (P) 0.8632; (R1) 0.8645; More…
Intraday bias in EUR/GBP is turned neutral first with current recovery. On the downside, decisive break of 0.8610 key support carry larger bearish implications and pave the way to 0.8466 fibonacci level next. However, firm break of 0.8652 will turn bias back to the upside for stronger rebound.
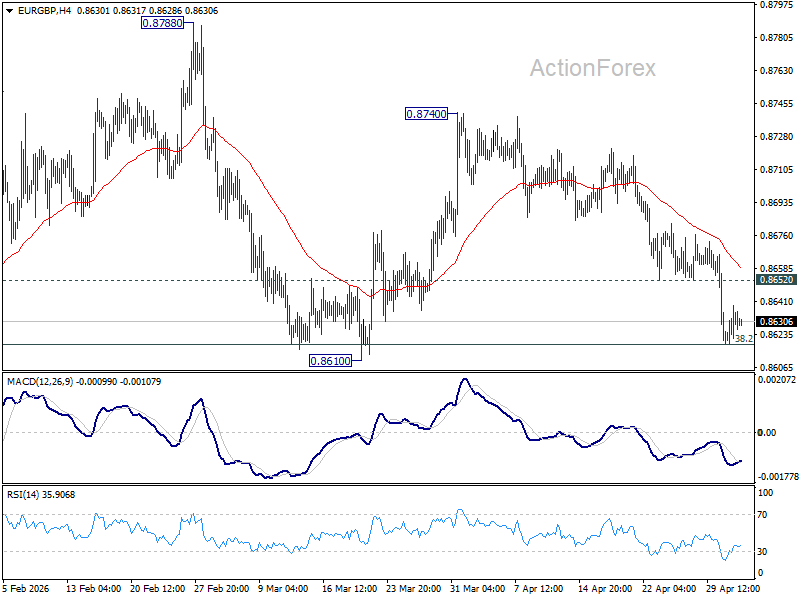
In the bigger picture, focus is back on 38.2% retracement of 0.8821 to 0.8863 at 0.8618. Sustained break there will confirm that whole rise from 0.8221 has completed at 0.8863. Deeper decline should then be seen to 61.8% retracement at 0.8466 at least. For now, risk will stay mildly on the downside as long as 55 D EMA (now at 0.8680) holds, in case of recovery.
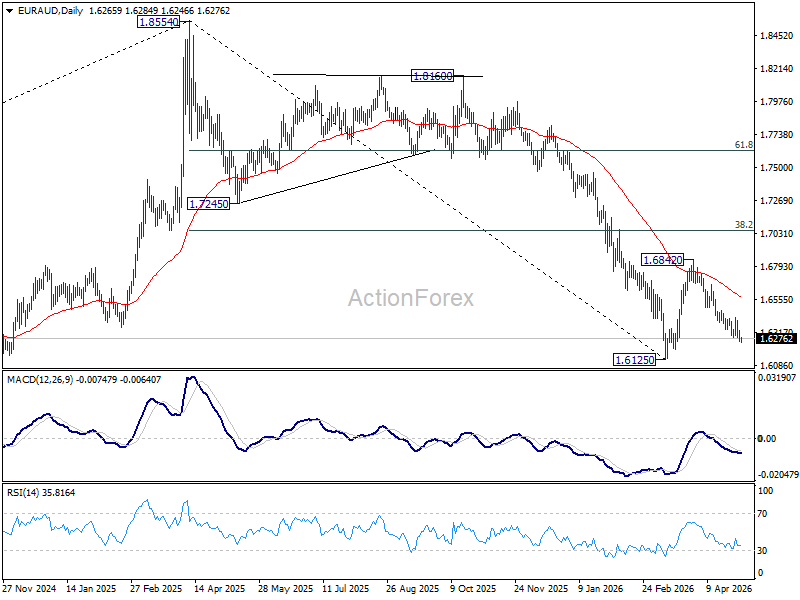
EUR/AUD Daily Outlook
Daily Pivots: (S1) 1.6243; (P) 1.6290; (R1) 1.6320; More...
Intraday bias in EUR/AUD remains on the downside, and fall from 1.6842 should target 1.6125 low. Decisive break there will resume whole fall from 1.8554. On the upside, above 1.6423 resistance will turn intraday bias neutral again first.
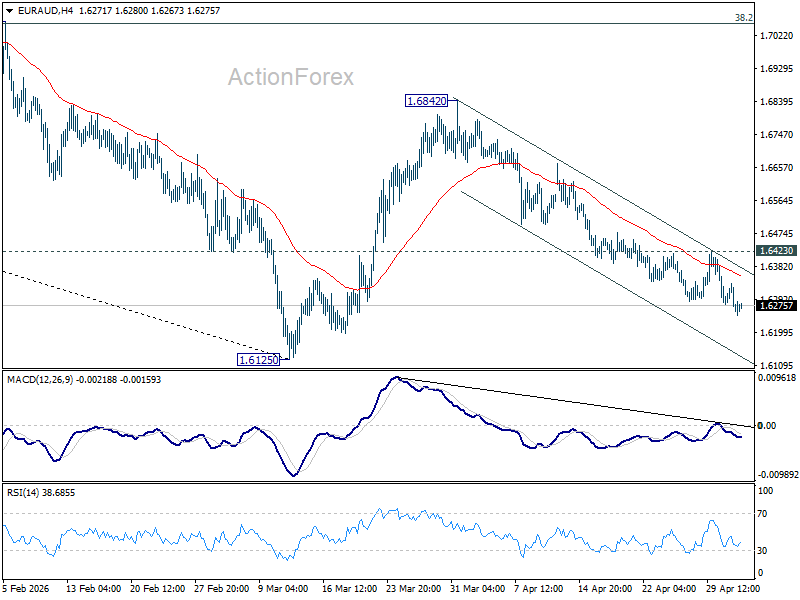
In the bigger picture, fall from 1.8554 (2025 high) is in progress and deeper decline should be seen to 61.8% retracement of 1.4281 to 1.8554 at 1.5913, which is slightly below 1.5963 structural support. Decisive break there will pave the way back to 1.4281 (2022 low). For now, risk will stay on the downside as long as 55 W EMA (now at 1.7069) holds, even in case of strong rebound.
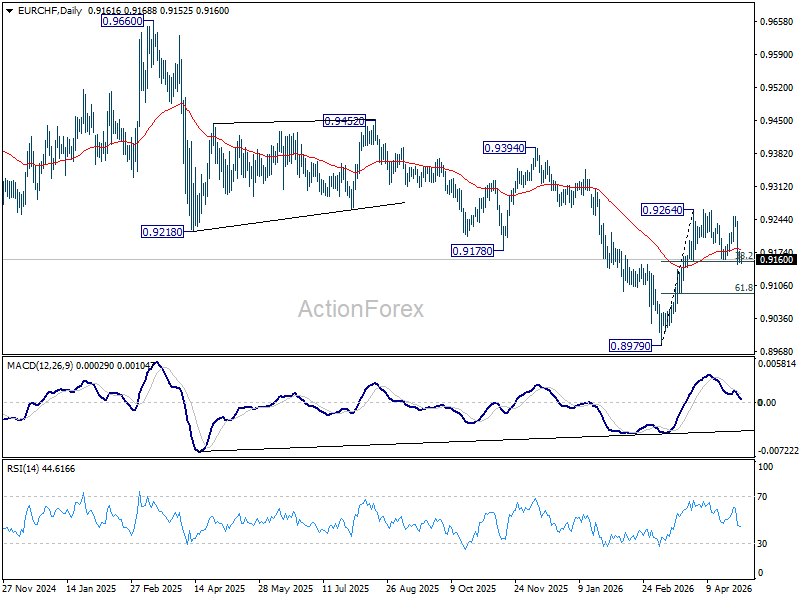
EUR/CHF Daily Outlook
Daily Pivots: (S1) 0.9152; (P) 0.9168; (R1) 0.9181; More....
Intraday bias in EUR/CHF stays neutral for the moment. Rise from 0.8979 is expected to continue as long as 0.9155 cluster support (38.2% retracement of 0.8979 to 0.9264 at 0.9155) holds. On the upside, firm break of 0.9264 will target 0.9394 resistance next. However, break of 0.9155 will turn bias back to the downside for deeper pullback to 61.8% retracement at 0.9088 and possibly below.
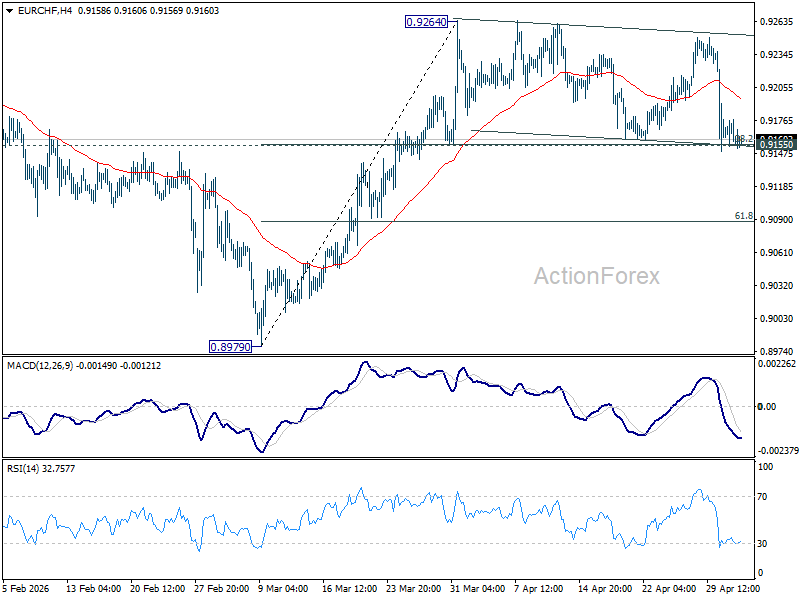
In the bigger picture, considering bullish convergence condition in W MACD, a medium term bottom should be in place at 0.8979. Sustained trading above 55 W EMA (now at 0.9268) will add more credence to this case. Further break of 0.9394 resistance will pave the way to 0.9660 resistance next. However rejection by the 55 W EMA will set up another fall through 0.8979 low at a later stage.