Sample Category Title
Eco Data 5/5/26
| GMT | Ccy | Events | Act | Cons | Prev | Rev |
|---|---|---|---|---|---|---|
| 04:30 | AUD | RBA Interest Rate Decision | 4.35% | 4.35% | 4.10% | |
| 05:30 | AUD | RBA Press Conference | ||||
| 06:30 | CHF | CPI M/M Apr | 0.30% | 0.40% | 0.20% | |
| 06:30 | CHF | CPI Y/Y Apr | 0.60% | 0.30% | ||
| 12:30 | CAD | Trade Balance (CAD) Mar | 1.8B | -2.8B | -5.7B | -5.1B |
| 12:30 | USD | Trade Balance (USD) Mar | -60.3B | -59.0B | -57.3B | -57.8B |
| 13:45 | USD | Services PMI Apr F | 51 | 51.3 | 51.3 | |
| 14:00 | USD | ISM Services PMI Apr | 53.6 | 53.8 | 54 |
| 04:30 | AUD |
| RBA Interest Rate Decision | |
| Actual | 4.35% |
| Consensus | 4.35% |
| Previous | 4.10% |
| 05:30 | AUD |
| RBA Press Conference | |
| Actual | |
| Consensus | |
| Previous | |
| 06:30 | CHF |
| CPI M/M Apr | |
| Actual | 0.30% |
| Consensus | 0.40% |
| Previous | 0.20% |
| 06:30 | CHF |
| CPI Y/Y Apr | |
| Actual | 0.60% |
| Consensus | |
| Previous | 0.30% |
| 12:30 | CAD |
| Trade Balance (CAD) Mar | |
| Actual | 1.8B |
| Consensus | -2.8B |
| Previous | -5.7B |
| Revised | -5.1B |
| 12:30 | USD |
| Trade Balance (USD) Mar | |
| Actual | -60.3B |
| Consensus | -59.0B |
| Previous | -57.3B |
| Revised | -57.8B |
| 13:45 | USD |
| Services PMI Apr F | |
| Actual | 51 |
| Consensus | 51.3 |
| Previous | 51.3 |
| 14:00 | USD |
| ISM Services PMI Apr | |
| Actual | 53.6 |
| Consensus | 53.8 |
| Previous | 54 |
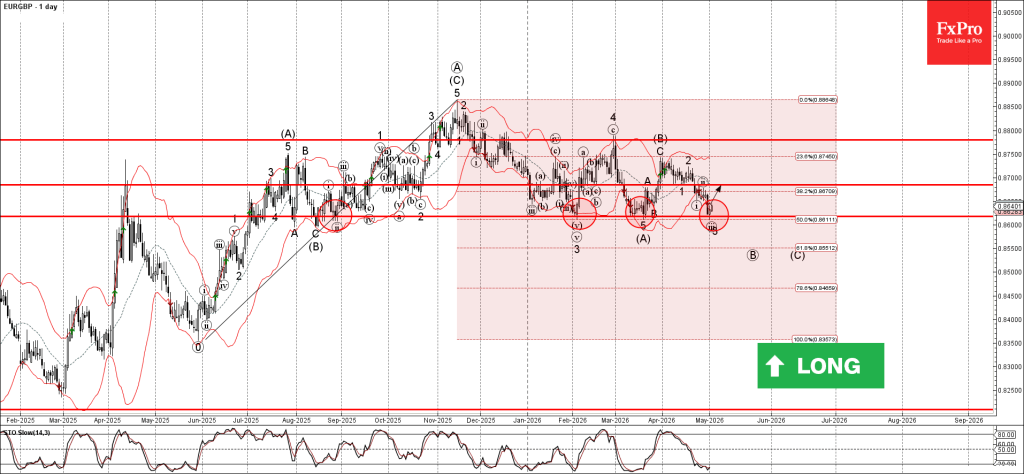
EURGBP Wave Analysis
EURGBP: ⬆️ Buy
- EURGBP reversed from support zone
- Likely to rise to resistance level 0.8685
EURGBP currency pair recently reversed from the support zone between the strong long-term support level 0.8620 (which has been repeatedly reversing the price from the start of 2025), lower daily Bollinger Band and the 50% Fibonacci correction of the upward impulse from May.
The upward reversal from this support zone stopped impulse wave 3 of the active intermediate impulse wave (C).
Given the strength of the support level 0.8620 and the oversold daily Stochastic, EURGBP currency pair can be expected to rise to the next resistance level 0.8685.
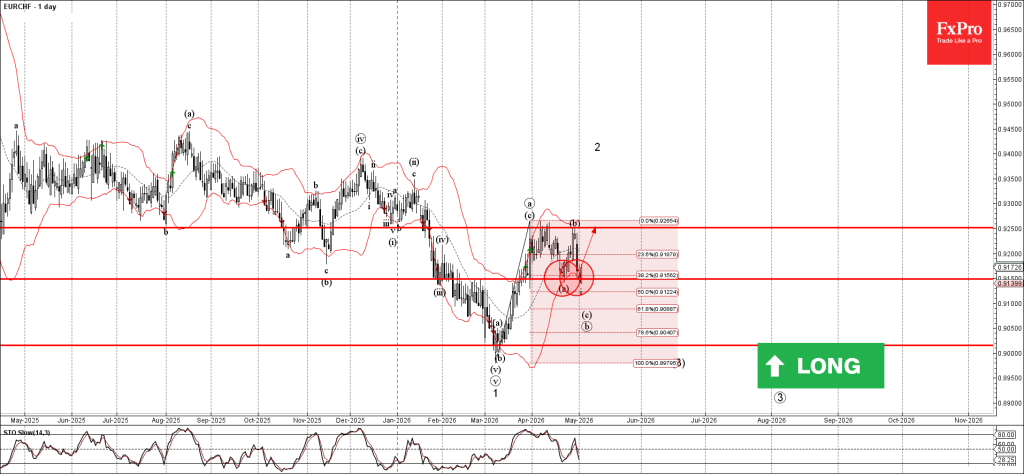
EURCHF Wave Analysis
EURCHF: ⬆️ Buy
- EURCHF reversed from support zone
- Likely to rise to resistance level 0.9250
EURCHF currency pair recently reversed from the support zone between the support level 0.9150 (which has been reversing the price from the end of March), lower daily Bollinger Band and the 38.2% Fibonacci correction of the upward impulse from March.
The upward reversal from this support zone stopped the c-wave of the previous ABC correction b from March.
EURCHF currency pair can be expected to rise to the next resistance level 0.9250 (which stopped previous waves a and b).
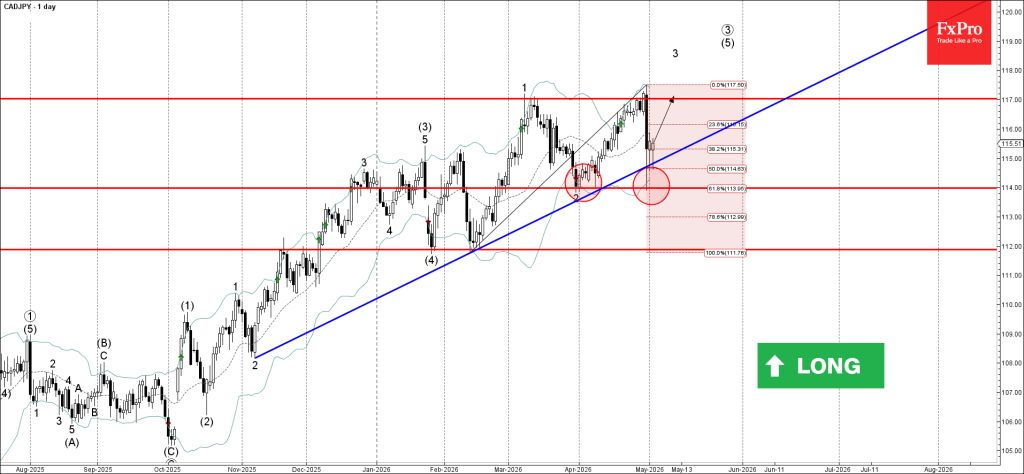
CADJPY Wave Analysis
CADJPY: ⬆️ Buy
- CADJPY reversed from strong support level 114.00
- Likely to rise to resistance level 117.00
CADJPY currency pair recently reversed from the support zone between the strong support level 114.00 (low of wave 2 from the end of March), lower daily Bollinger Band and the 61.8% Fibonacci correction of the upward impulse from February.
The upward reversal from this support zone created the daily Japanese candlesticks reversal pattern Hammer- strong buy signal for this currency pair.
Given the clear daily uptrend, CADJPY currency pair can be expected to rise to the next resistance level 117.00 (which has been reversing the price from the start of March).
WTI Wave Analysis
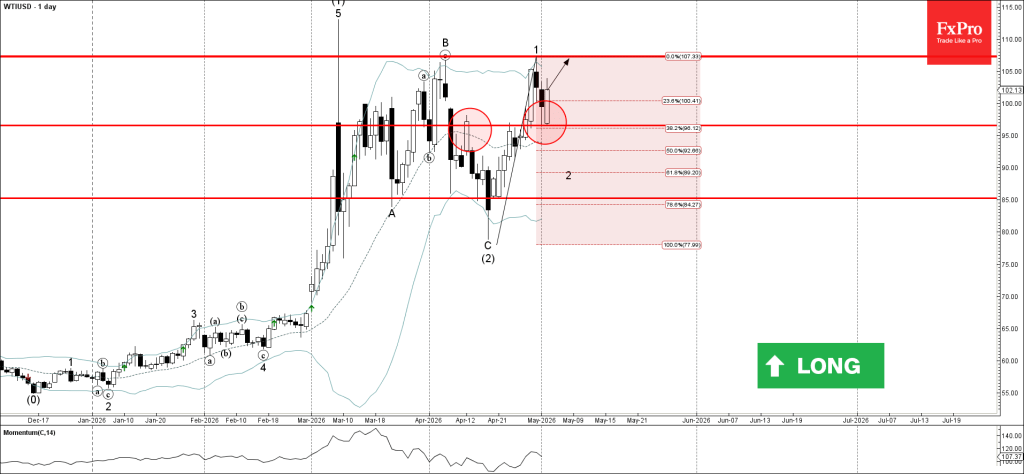
WTI: ⬆️ Buy
- WTI reversed from key support level 96.60
- Likely to rise to resistance level 107.30
WTI crude oil recently reversed from the support zone between the key support level 96.60 (former resistance from April, acting now as the support, after it was broken last month) and the 38.2% Fibonacci correction of the upward impulse 1.
The upward reversal from this support zone is likely to form the daily Bullish Engulfing pattern if the price closes today near the current levels.
Given the strong daily uptrend, WTI crude oil can be expected to rise to the next resistance level 107.30 (which stopped previous waves 1 and B).
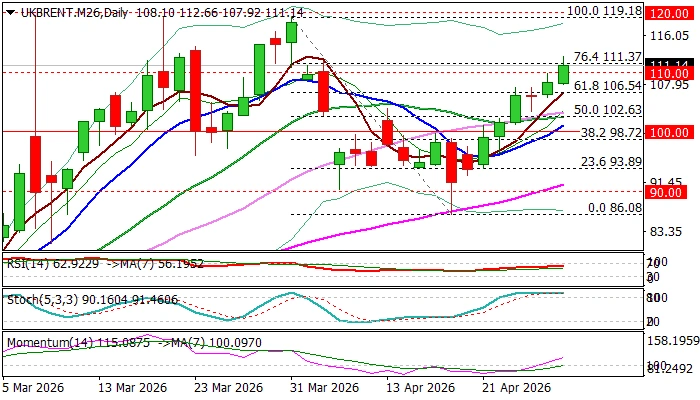
Brent Oil: Brent Price Rises on Fresh Tensions in the Middle East
Brent oil jumped on Monday on raising tensions in the Middle East as the US announced the start of operation to open the Strait of Hormuz while Iran claims hitting one of the US warships that attempted to enter the straight.
In the environment of rising tensions, the OPEC+ decided to raise again the output by 188.000 bpd in attempt to partially compensate growing damage to global oil supply since Iran closed strategic strait, although the decision was described by market observers as symbolic and largely to remain on the paper while Gulf supplies through Hormuz are disrupted.
The contract price jumped well above $110 mark (hit $114.27, just under last week’s recovery peak at $114.68).
Near term action is expected to be skewed to the upside as long as traffic through Hormuz remain restricted, while tough rhetoric from both sides that threatens fresh escalation adds support to oil prices
Daily studies remain in full bullish setup after dips in past three sessions were repeatedly contained by broken Fibo 61.8% level, reinforced by rising 10DMA (106.54), with price action holding above ascending and thickening daily cloud and diverging daily Tenkan/Kijun-sen, after creating a bull-cross.
Fresh advance need close above $110 to verify positive signal, with extension through recent peaks ($114.27/68) to further firm the structure for potential attack at key $120 resistance zone.
Significant support at 106.00 zone (today’s low/10DMA) should contain potential dips to keep bulls in play and guard supports at 102.63 (daily Kijun-sen) and 100.94/00 (daily cloud base/psychological.
Res: 111.37; 112.66; 113.50; 114.68.
Sup: 110.00; 107.78; 106.54; 105.64.
Sunset Market Commentary
Markets
With the policy meetings of major central banks having passed last week, markets today returned their focus to the conflict in the Middle East. The latest political development was labelled “Project Freedom”, with President Trump indicating that the U.S. would guide stranded ships in the Persian Gulf through the Strait of Hormuz.
Looking at oil prices, markets were not convinced this would help resolve the conflict. Brent crude at the European open moved back above $110/bbl. Skepticism proved justified as conflicting reports emerged regarding an incident involving a U.S. naval vessel entering the Strait of Hormuz. Later, U.S. Treasury Secretary Bessent reiterated that the U.S. is reopening Hormuz.
Whatever the underlying reality, oil prices do not yet signal any meaningful progress toward coordinated de-escalation. Central bankers, including the BoE and ECB, warned last week that a prolonged period of elevated oil prices and supply disruptions could force tighter policy.
U.S. and European yields reversed part of last Thursday’s decline, returning to a bear-flattening pattern alongside rising oil prices. U.S. yields gained between 3.5–4.5 bps, while German yields rose between 1.5–4 bps. A series of ECB speakers reiterated differing views along the hawkish-dovish spectrum.
Slovak ECB member Kazimir stood out, stating that “policy tightening in June was all but inevitable” as broad-based inflation risks increase. Others, including outgoing ECB member Villeroy, adopted a more balanced tone, though most acknowledged growing pass-through risks.
European equities struggled to follow tech-driven gains in parts of Asia and came under pressure as oil prices and yields moved higher (Eurostoxx 50 -0.85%). U.S. indices opened little changed.
On FX markets, the dollar is gaining on lingering geopolitical uncertainty and rising oil prices, though most moves remain technically limited. DXY trades near 98.40 (from 98.05), while EUR/USD holds near 1.17 despite some downside pressure.
The euro has so far shown limited damage from higher oil prices and renewed trade tensions, including President Trump’s threat to raise tariffs on EU autos to 25%.
Japanese markets remain closed for Golden Week, but markets are alert to potential yen-supportive intervention from the Ministry of Finance. Authorities reiterated their readiness to act against speculative moves. Despite a brief yen strengthening earlier, USD/JPY is little changed around 157.1.
News & Views
The Czech manufacturing PMI stabilized at 52.9 in April, beating expectations of 51.4. Output and new orders expanded despite significant supply chain disruptions. Firms increased input buying and stockpiling amid shortages linked to the Gulf conflict.
Supplier performance deteriorated sharply, marking the steepest decline in quality since mid-2022. Business confidence weakened, while cost pressures rose significantly.
Operating expenses surged at the fastest pace in nearly four years, with output prices accelerating to their strongest level since January 2023. Firms are increasingly absorbing costs through margin compression.
The ECB’s Survey of Professional Forecasters (Q2 2026) showed upward revisions to inflation expectations. Headline HICP is now seen at 2.7% for 2026 (from 1.8%) and 2.1% for 2027 (from 2%).
This aligns closely with the ECB’s March projections, which President Lagarde recently suggested are becoming outdated. Core inflation is now projected at 2.2% across the policy horizon, up from 2.0% previously.
Wage growth expectations also increased, averaging 3.3%, 3.1%, and 2.9% for 2026–2028. Long-term inflation expectations remain anchored at 2%.
Growth expectations were revised slightly lower, with GDP now seen at 1.0% for 2026 (from 1.2%), before stabilizing around 1.3% in 2027–2028.
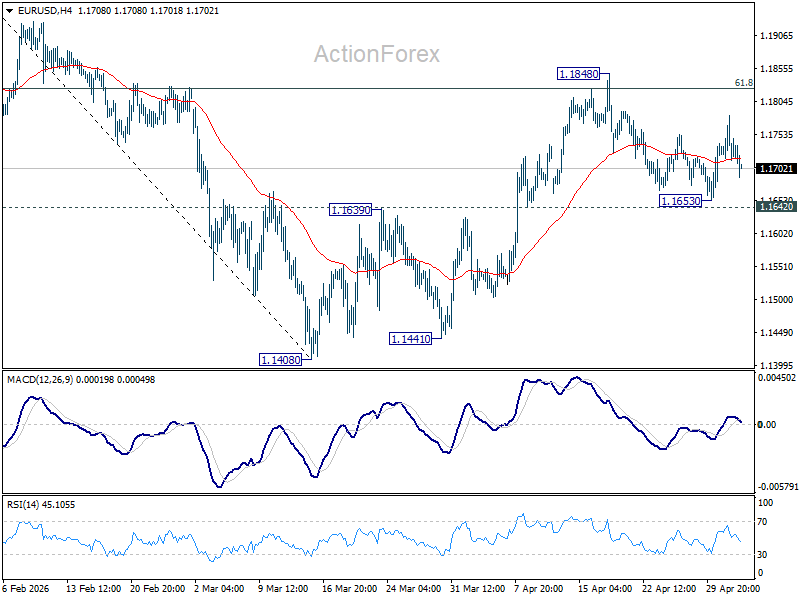
EUR/USD Mid-Day Outlook
Daily Pivots: (S1) 1.1696; (P) 1.1741; (R1) 1.1767; More….
Sideway trading continues in EUR/USD and intraday bias remains neutral. Rise from 1.1408 is expected to continue as long as 1.1642 support holds. Firm break of 1.1848 will target 1.2081 high next. However, firm break of 1.1662 support will indicate the the rebound from 1.1408 has completed, and bring deeper decline back towards this low instead.
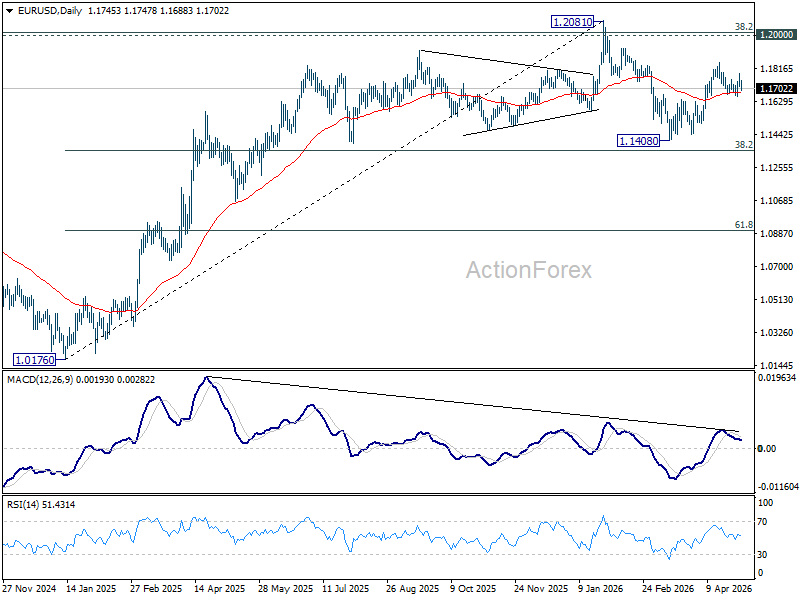
In the bigger picture, the strong support from 38.2% retracement of 1.0176 to 1.2081 at 1.1353 suggests that the pullback from 1.2081 is more likely a corrective move. Strong support was also found in 55 W EMA (now at 1.1537). Focus is back on 1.2 key cluster resistance level. Decisive break there will carry long term bullish implications. Nevertheless, break of 1.1408 support will revive the case of medium term bearish trend reversal.
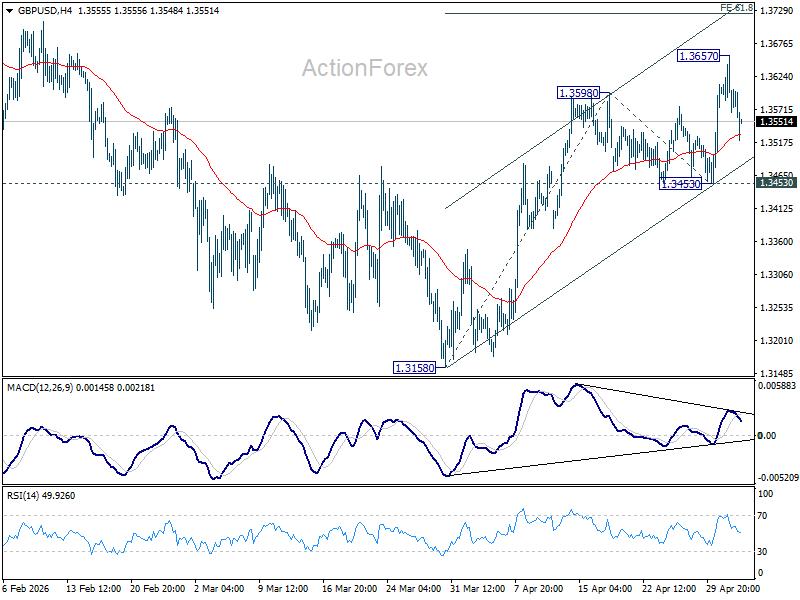
GBP/USD Mid-Day Outlook
Daily Pivots: (S1) 1.3542; (P) 1.3601; (R1) 1.3634; More...
GBP/USD is staying in consolidations below 1.3657 temporary top and intraday bias remains neutral. Further rally is expected as long as 1.3453 holds. Above 1.3657 will target 61.8% projection of 1.3158 to 1.3598 from 1.3453 at 1.3725 first. Firm break there will target a retest on 1.3867 high.
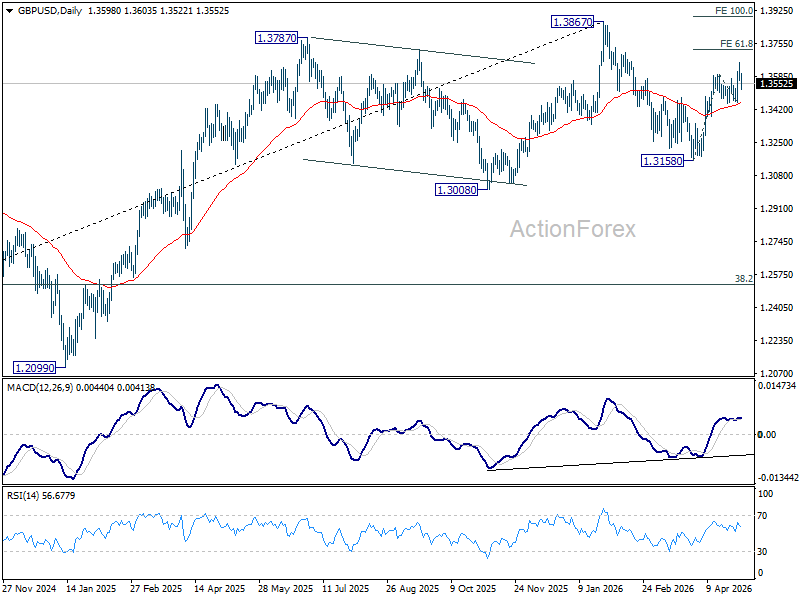
In the bigger picture, current development suggests that price actions from 1.3867 are merely a corrective pattern within the broader up trend from 1.0351 (2022 low). With 1.3008 support intact, medium term bullishness is maintained and break of 1.3867 is in favor for a later stage, towards 1.4248 key resistance (2021 high).
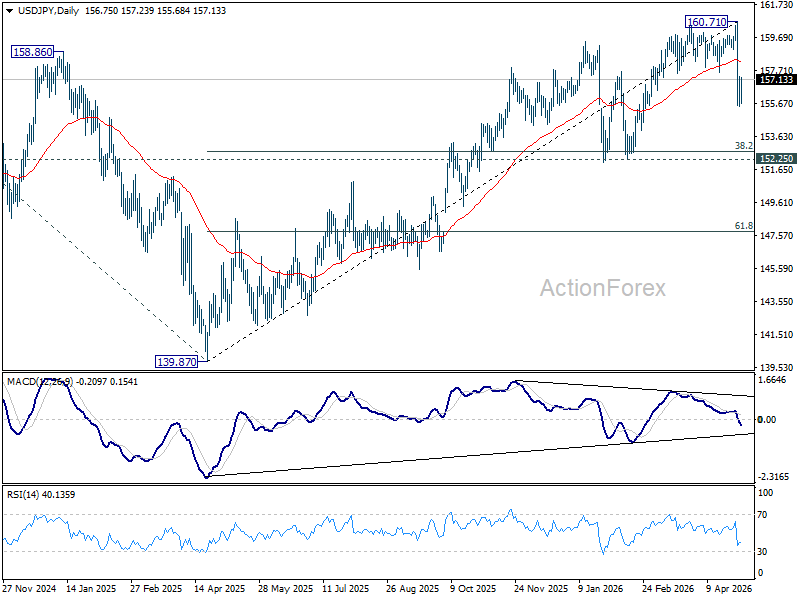
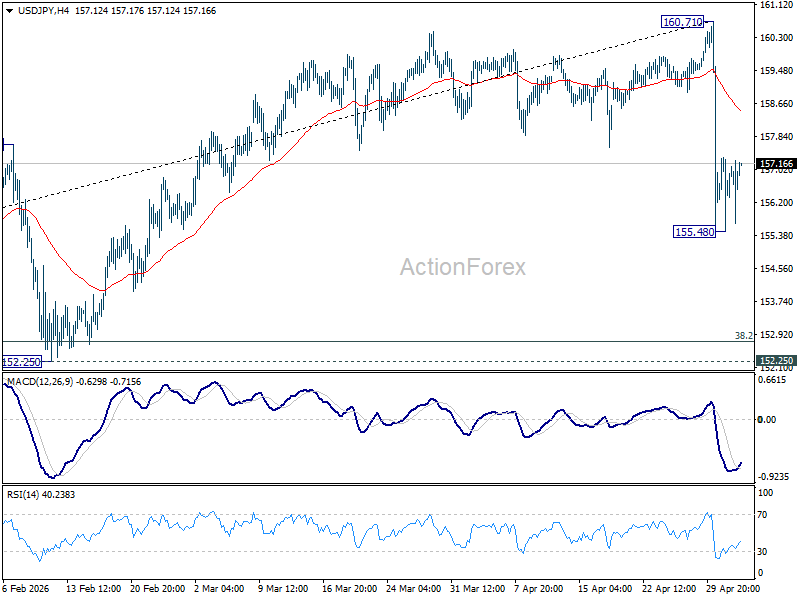
USD/JPY Mid-Day Outlook
Daily Pivots: (S1) 155.94; (P) 156.64; (R1) 157.75; More...
Intraday bias in USD/JPY remains neutral and more consolidations could be seen above 155.48 temporary low. Risk will stay on the downside as long as 55 4H EMA (now at 158.45) holds. Below 155.48 will extend the fall from 160.71 and target 152.25 cluster support (38.2% retracement of 139.87 to 160.71 at 152.74).
In the bigger picture, for now, corrective pattern from 161.94 (2024 high) is still seen as completed at 139.87. Rise from there is seen as resuming the long term up trend. So, break of 161.94 is expected at a later stage to resume the long term up trend. However, sustained break of 55 W EMA (now at 154.03) will dampen this view and bring deeper fall back towards 139.87 to extend the pattern from 161.94.