Sample Category Title
USD/JPY Mid-Day Outlook
Daily Pivots: (S1) 156.22; (P) 156.76; (R1) 157.79; More...
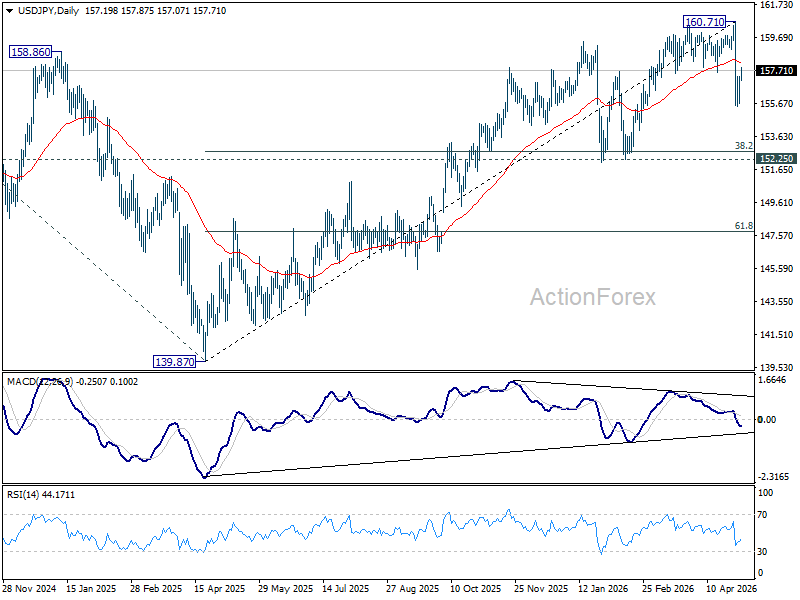
USD/JPY's recovery from 155.48 accelerates higher today, but it stays below 55 4H EMA (now at 158.27). Intraday bias remains neutral and further decline is still in favor. Below 156.55 minor support will bring retest of 155.48. Break there will extend the fall from 160.71 and target 152.25 cluster support (38.2% retracement of 139.87 to 160.71 at 152.74). However, sustained break of the 55 4H EMA will bring stronger rebound back to retest 160.71 high.
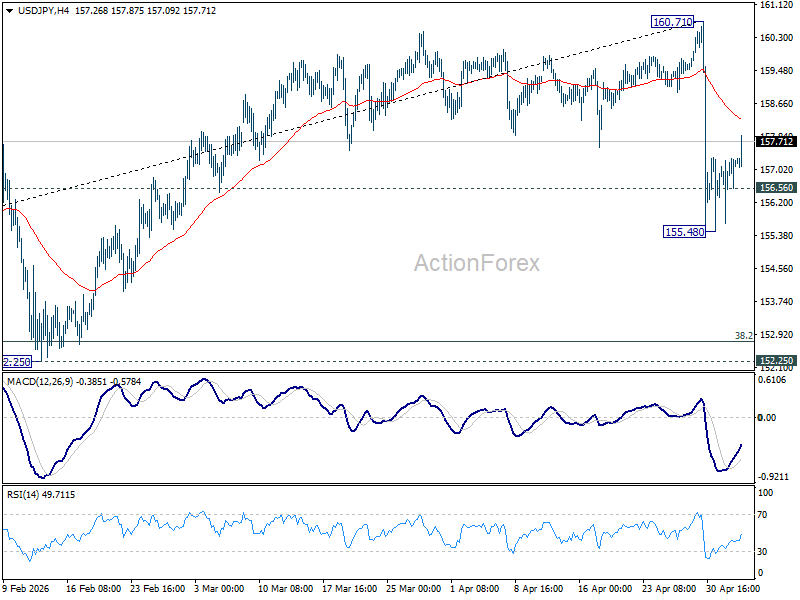
In the bigger picture, for now, corrective pattern from 161.94 (2024 high) is still seen as completed at 139.87. Rise from there is seen as resuming the long term up trend. So, break of 161.94 is expected at a later stage to resume the long term up trend. However, sustained break of 55 W EMA (now at 154.03) will dampen this view and bring deeper fall back towards 139.87 to extend the pattern from 161.94.
ETH/USD: Corporate Demand For the Coin Is Rising
According to Santiment, in early May large holders acquired more than 140,000 ETH within 96 hours. This demand is forming against a backdrop of growing corporate interest in Ethereum as a reserve asset: Bitmine Immersion Technologies holds over 5 million ETH. At the same time, an opposing trend is emerging: total assets under management in ETH-focused ETPs and ETFs amount to around $16 billion; however, at the beginning of 2026 the ETF segment experienced a period of subdued activity, with interest only starting to recover by April (source: CoinLaw).
Technical Picture
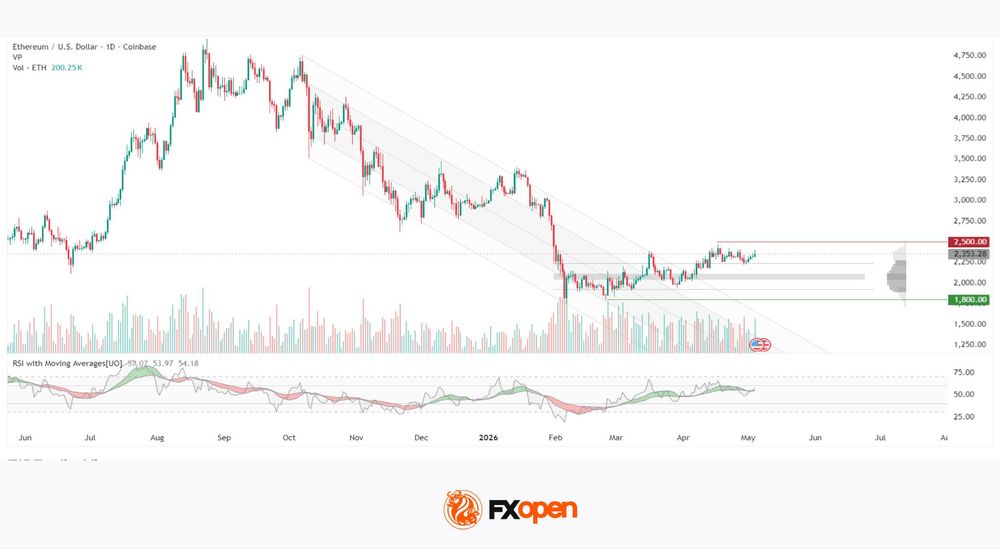
On the daily chart, an extended downward structure is evident: since early October 2025, the price has been declining within a descending channel, reaching a culmination in early February 2026 near the $1,750 level. Vertical volume during this period showed peak values, signalling the exhaustion of selling pressure. This was followed by a rebound: the price broke above the upper boundary of the channel and, during subsequent trading, formed a horizontal volume zone in the $1,920–$2,240 range, where the bulk of transactions over the period was concentrated. The point of control (POC) of this volume zone lies around $2,050–$2,100.
The price is currently trading above this zone, indicating a shift in favour of buyers. Support at $1,800 coincides with the February low from which the reversal began. Above current levels lies a resistance area near $2,500 — a zone the price approached in April but failed to consolidate above the round level. The RSI + MAs indicator shows readings of 57, 54 and 54: the oscillator is positioned above neutral, while the moving averages remain broadly neutral.
Key Takeaways
The technical profile reflects a transition from a prolonged downtrend to a consolidation phase above the volume zone. Further movement will depend on whether corporate demand for ETH can provide a sufficient basis to sustain a move towards the resistance area.
FXOpen offers the world's most popular cryptocurrency CFDs*, including Bitcoin and Ethereum. Floating spreads, 1:2 leverage — at your service (additional fees may apply). Open your trading account now or learn more about crypto CFD trading with FXOpen.
*Important: At FXOpen UK, Cryptocurrency trading via CFDs is only available to our Professional clients. They are not available for trading by Retail clients. To find out more information about how this may affect you, please get in touch with our team.
This article represents the opinion of the Companies operating under the FXOpen brand only. It is not to be construed as an offer, solicitation, or recommendation with respect to products and services provided by the Companies operating under the FXOpen brand, nor is it to be considered financial advice.
Bitcoin Has Begun Hunting Down Short Sellers
Market Overview
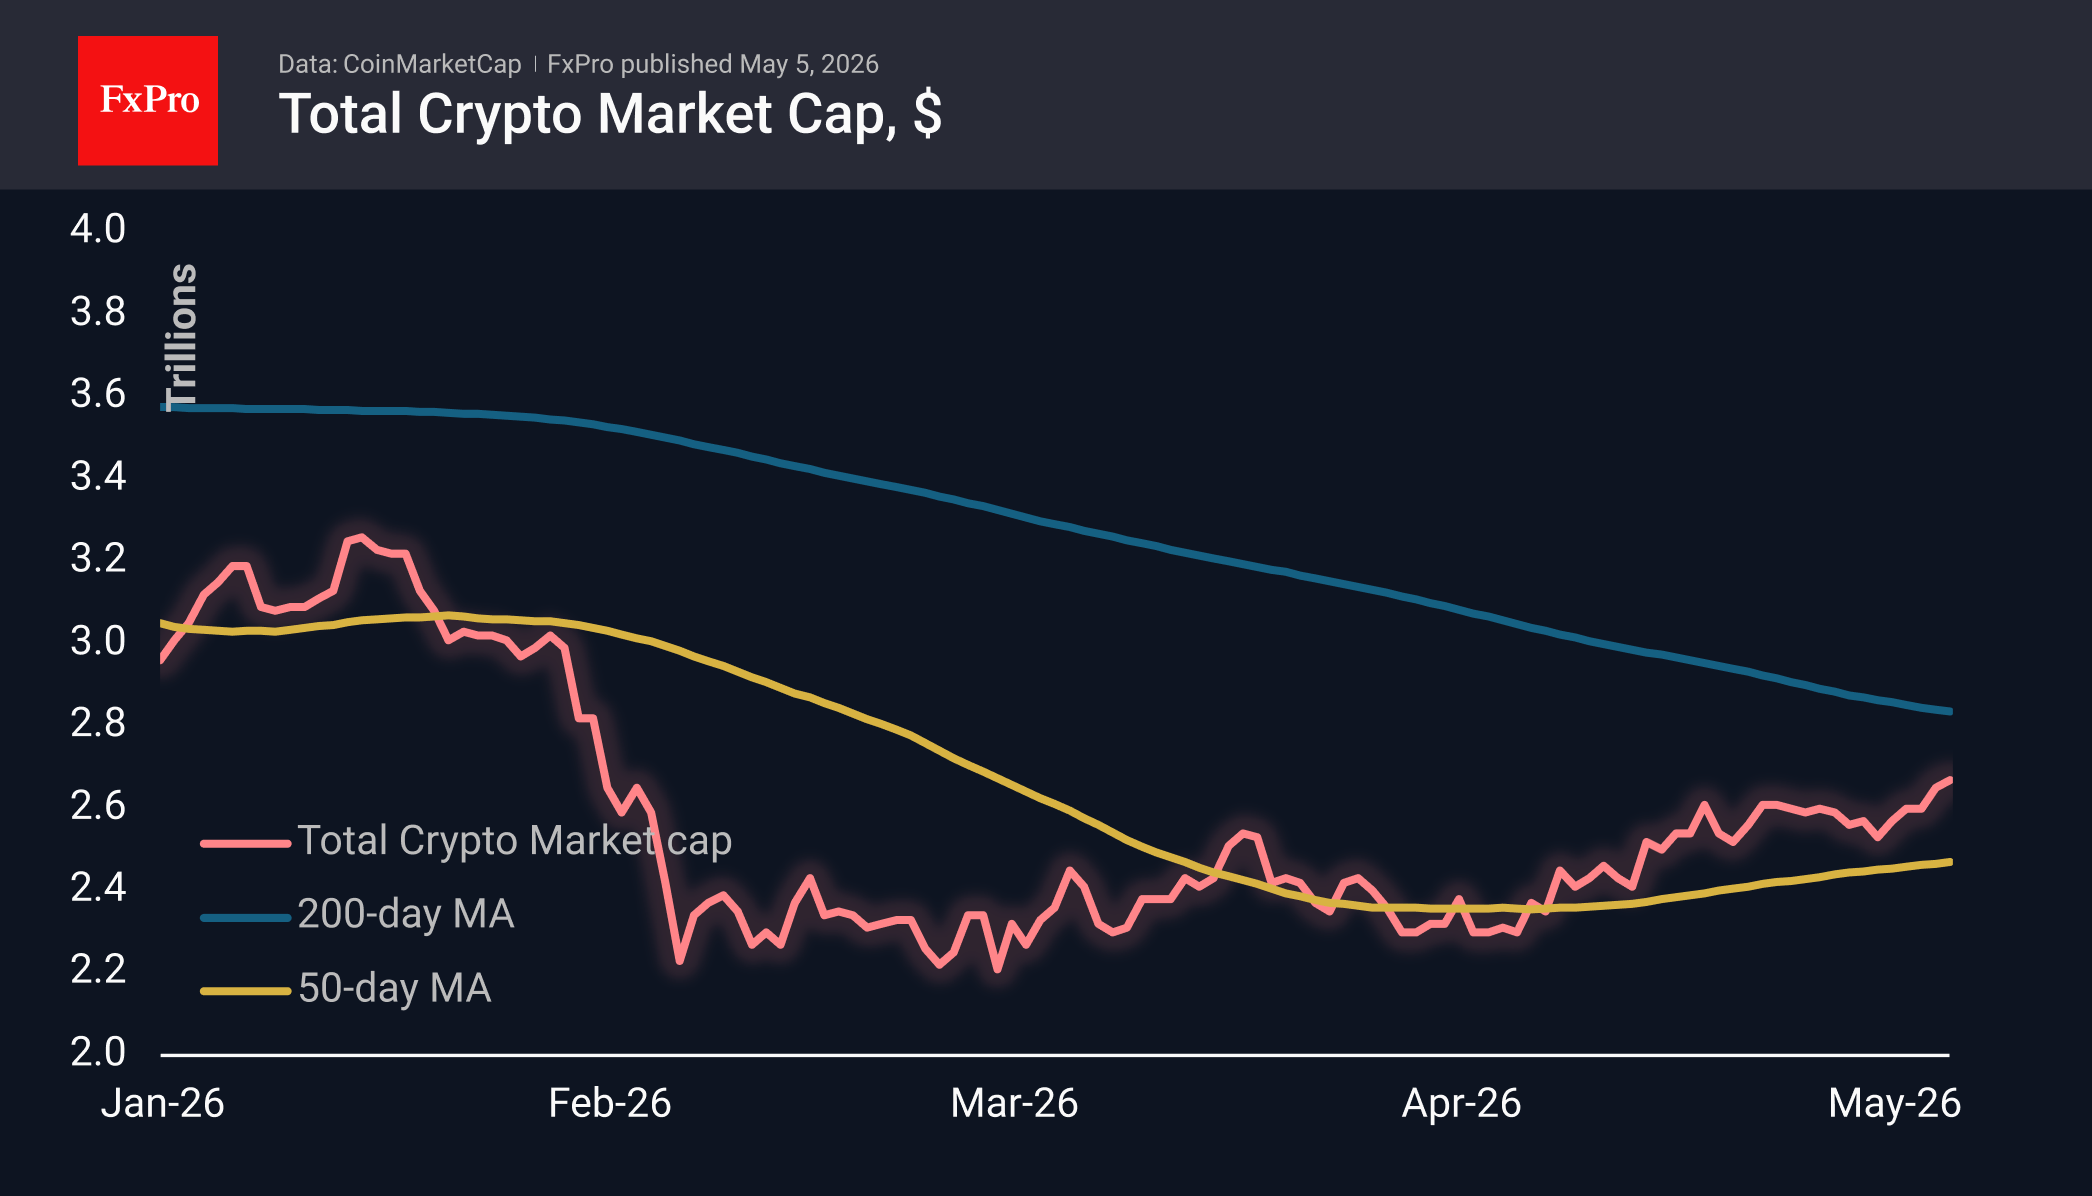
The crypto market capitalisation has continued to hit new highs since early February, reaching $2.67 trillion. This time, the movement was not uniform, consisting of individual surges led by Toncoin (+29%), followed by Algorand (+4.5%) and Basic Attention (+4%). The underperformers include Dash (-5.5%), Aptos (-2.1%) and VeChain (-1.6%).
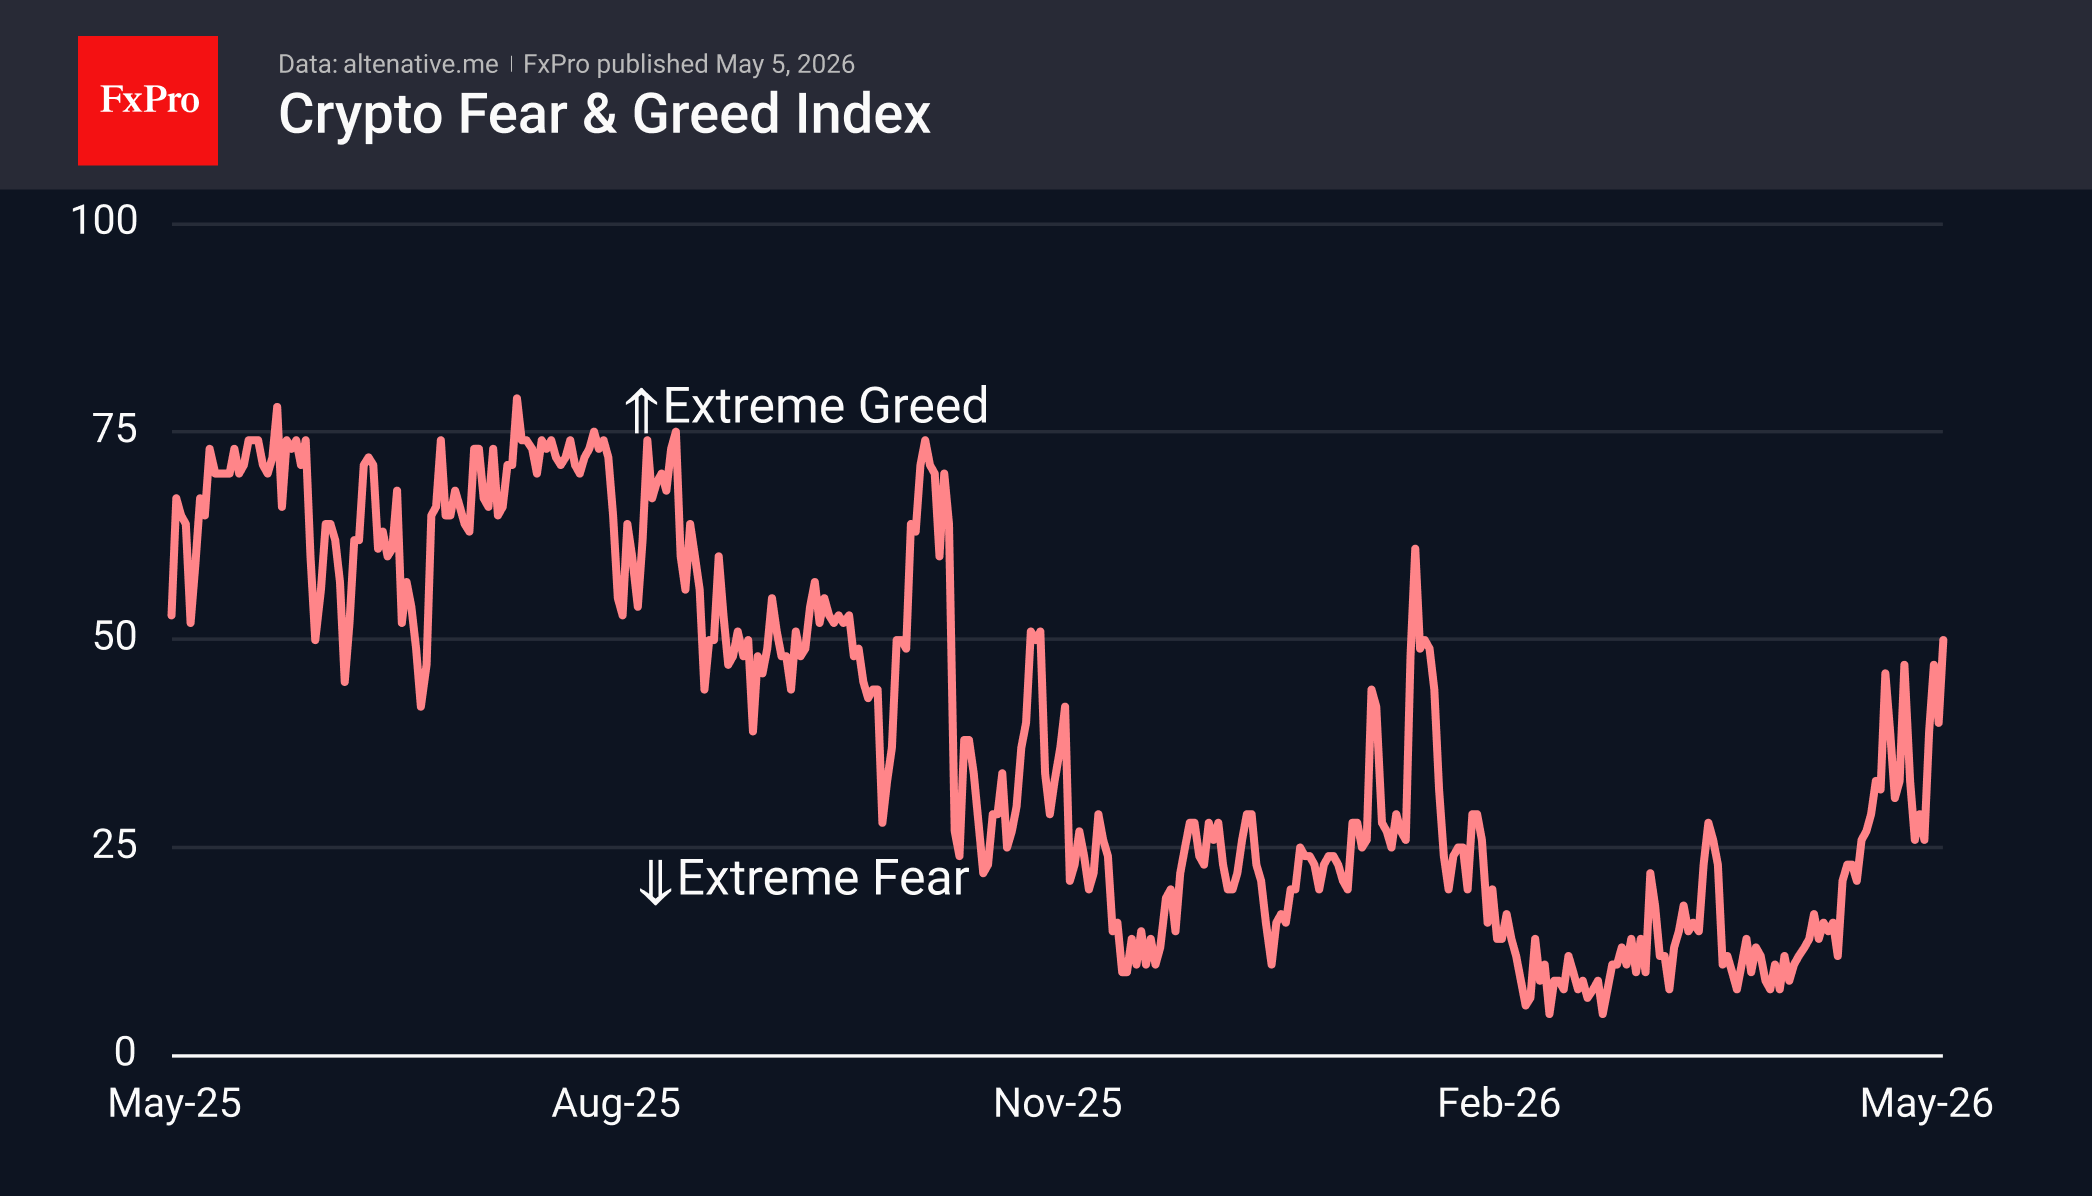
The sentiment index has reached 50, the midpoint of the indicator’s range, where it last stood on 17 January. The market is approaching a significant turning point. Since last October, there have been only brief surges in sentiment to higher levels, but these have provided excellent opportunities for bears to sell at higher prices.
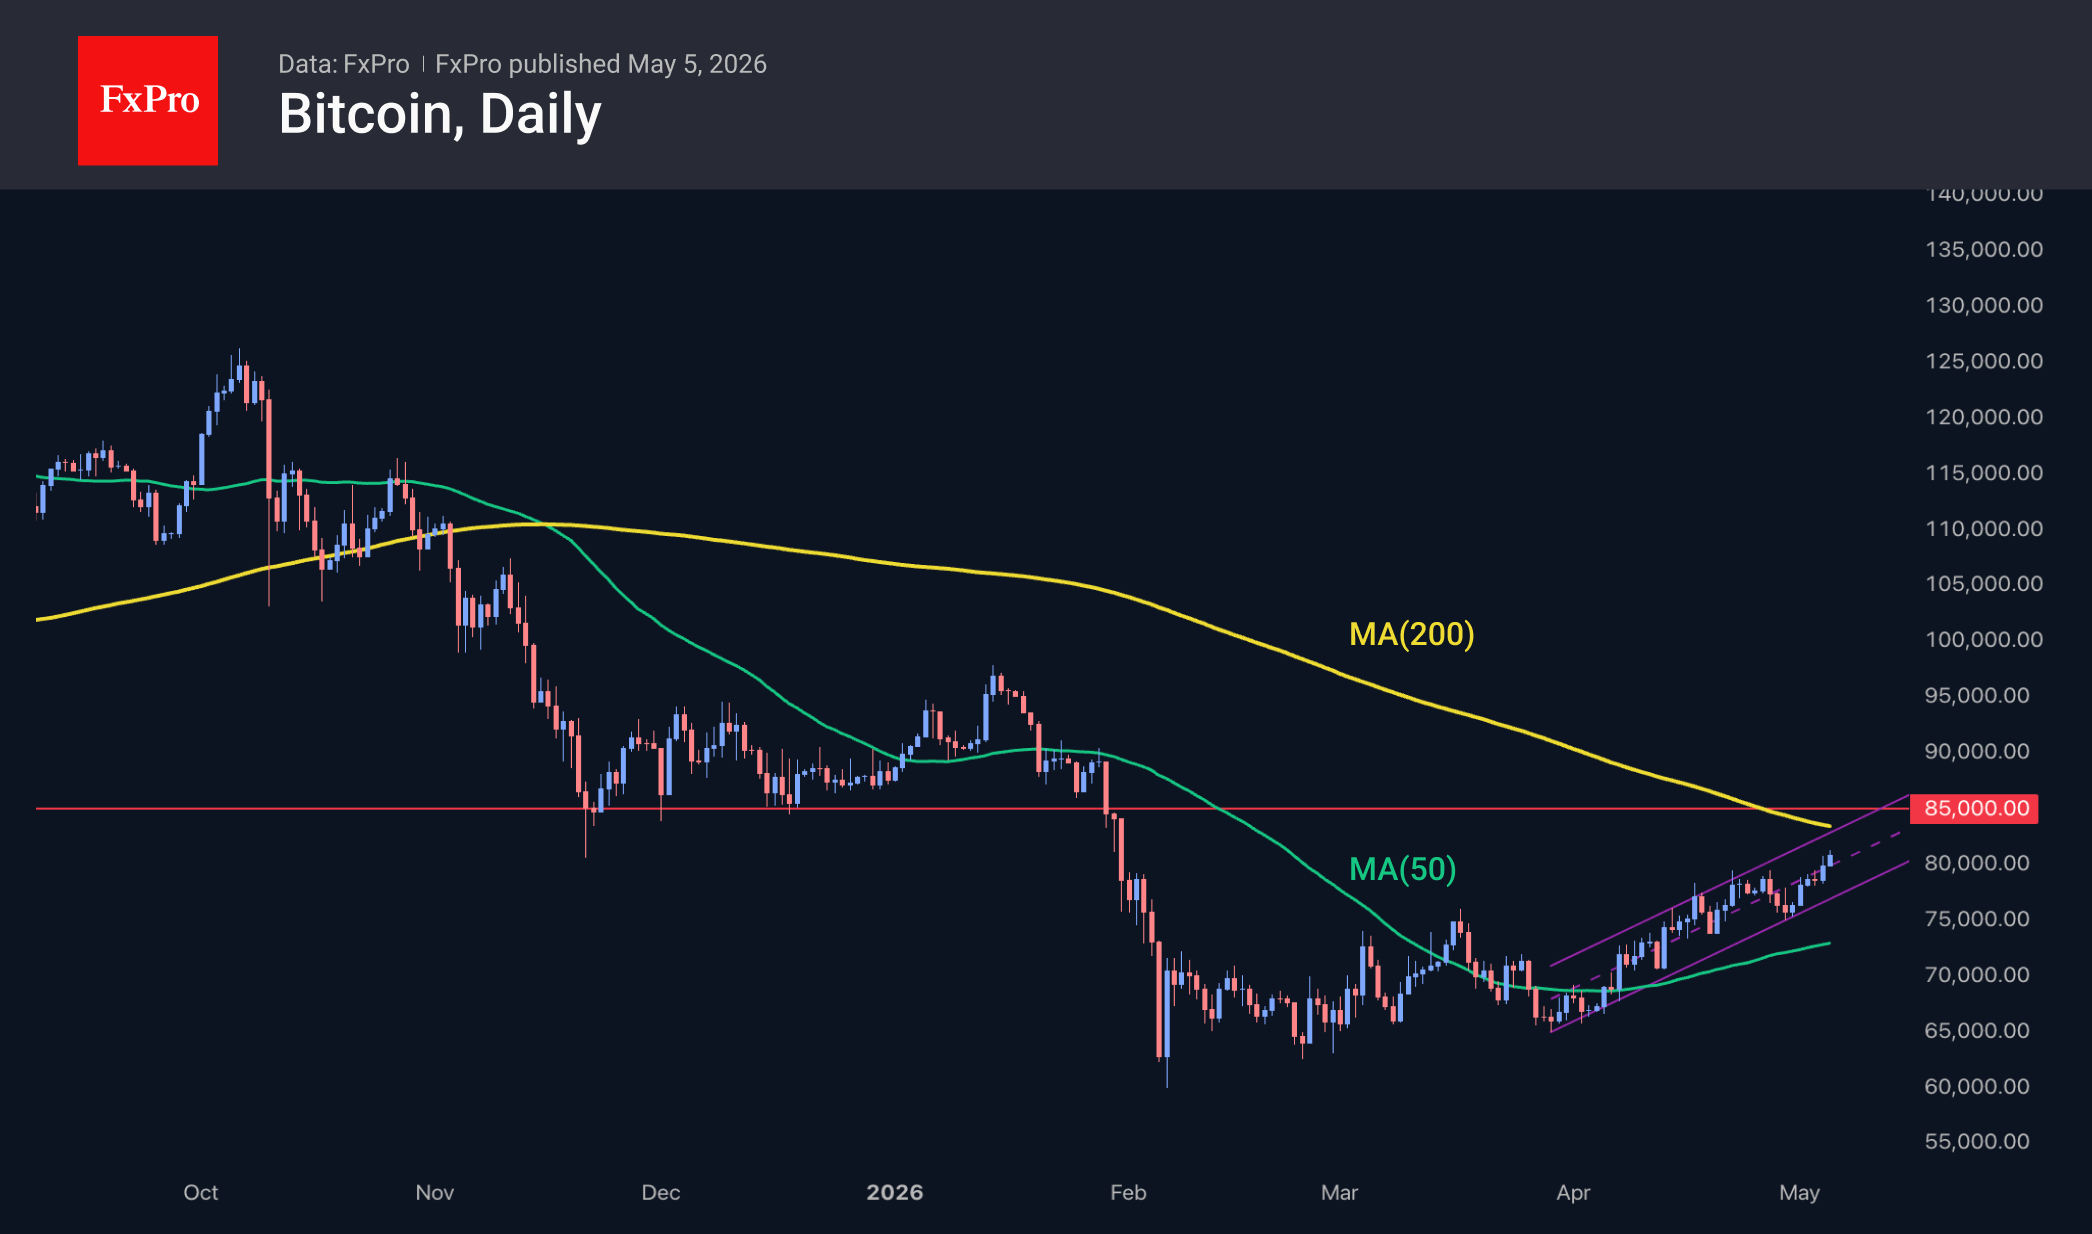
Although Bitcoin faced some pressure midday on Monday, it overcame it on Tuesday, reaching $81K and gaining 1.3% for the day, though, by and large, it covered this ground in just the last 4 hours. We attribute this rally to short squeezes, as the rise occurred during the period of the most aggressive movements ahead of the start of active trading in Asia, when liquidity is at its lowest. Meanwhile, on the stock markets, there was only a slight pullback following the downward momentum. In any case, on the daily charts, Bitcoin is recording its sixth bullish candle, and the entire April uptrend now fits within a new upward channel, with the upper boundary currently at the 200-day moving average.
News Background
The Capriole investment fund has noted a sharp rise in demand for Bitcoin from major players. Institutional investors are buying up more than 500% of the daily mining output of the leading cryptocurrency every day. Historically, such a supply shortage has led to a 24% rise in BTC over the following month.
Bitcoin appears poised for an upward surge. A break above $80K opens up the possibility of reaching $86K0–$88K in the coming period, notes MN Trading founder Michael van de Poppe.
Following the latest adjustment, Bitcoin’s mining difficulty has fallen by 2.3% to 132.47 T. According to Glassnode, the network’s average hash rate, smoothed by a 7-day moving average, stands at around 955 EH/s.
Senators Tom Tillis and Angela Olsbrooks have reached a compromise regarding stablecoin yields in the CLARITY Act. This bill regulating the US crypto market may be considered by the Senate Banking Committee in the week following 11 May.
AUD/USD Slips to 20-SMA After RBA Rate Hike
- AUD/USD loses ground as RBA meets rate hike expectations.
- Short-term risk is tilted to the downside.
- A close below 20-SMA could extend decline.
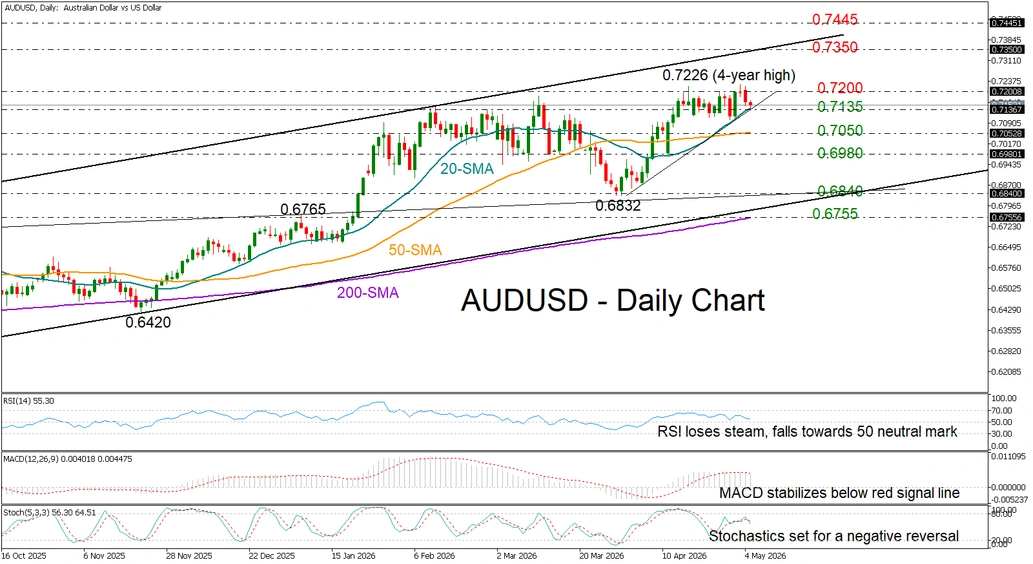
AUD/USD retreated to 0.7134, extending Monday’s losses after the Reserve Bank of Australia (RBA) delivered its third consecutive rate increase, as expected, to quell inflation while signaling a data-dependent approach for future policy actions. A relatively firmer dollar, amid escalating tensions in the Middle East, added extra pressure on the pair.
Technically, the pullback emerged after the 0.7200 bar stood firm once again near four-year highs, bringing the 20-day simple moving average (SMA) at 0.7135 back into view. A break lower would put April’s upleg into question, shifting the spotlight toward the 50-day SMA at 0.7050. Should the sell-off extend beyond 0.6980, the next pivot point could come at the March low of 0.6840.
Given the negative trajectory in the RSI and the MACD, there is limited optimism for short-term acceleration. Nevertheless, if the bulls reclaim the 0.7200 level and revive the 2025 uptrend, the door could open toward the ascending trendline connecting the 2025 and 2026 highs, currently seen near 0.7350. The 0.7445 resistance taken from April 2025, could be the next destination.
In summary, AUD/USD appears to be losing bullish momentum in the short-term picture as it tests a key support area around 0.7135. Failure to hold this level could trigger another wave of selling.
Yen Weakens as Demand for the US Dollar Returns
USD/JPY held near 157.22 on Tuesday following a volatile start to the week. Pressure on the Japanese yen has increased as demand for the US dollar has returned, with investors once again favouring the greenback as a defensive asset. The move comes amid renewed tensions in the Middle East, which threaten the fragile truce between the US and Iran.
The renewed escalation around the Strait of Hormuz has pushed energy prices higher and reignited inflation concerns. In turn, this has supported the US dollar by increasing expectations that the Federal Reserve may need to maintain a tighter monetary stance for longer.
At the same time, markets remain cautious following Japan’s suspected currency intervention last week, which triggered a sharp rebound in the yen. Market estimates suggest Tokyo may have spent as much as USD 35 billion, although the authorities have yet to confirm any direct action.
Investors continue to price in the risk of further intervention. Japan has historically preferred to act during periods of thinner liquidity and has often intervened in waves, helping to sustain elevated volatility across the foreign exchange market.
Technical Analysis
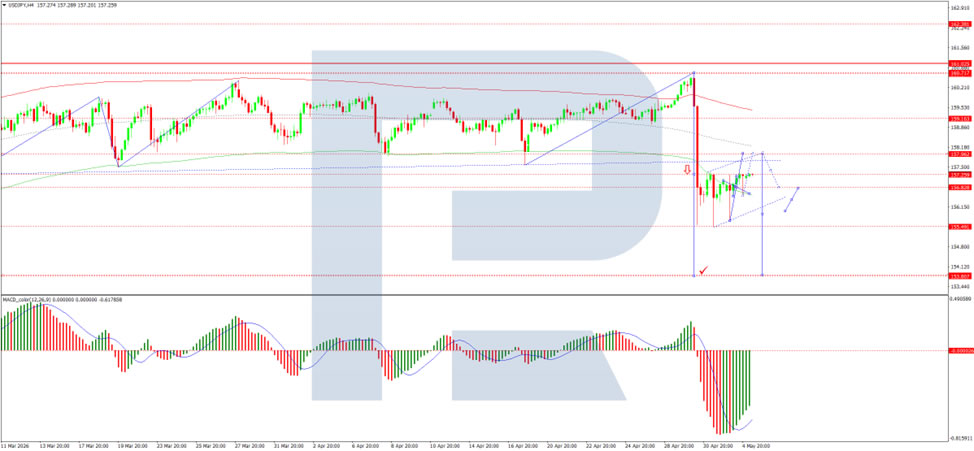
On the H4 chart, USD/JPY is trading within a consolidation range around 156.50 and is now moving towards 157.60. This level remains the immediate upside target. Once reached, a corrective move lower may begin, with scope for a decline towards 153.80 and potentially 153.00 thereafter. The MACD supports this scenario, with its signal line below zero but pointing firmly upwards, indicating that bullish momentum is still building in the short term before a broader correction may emerge.
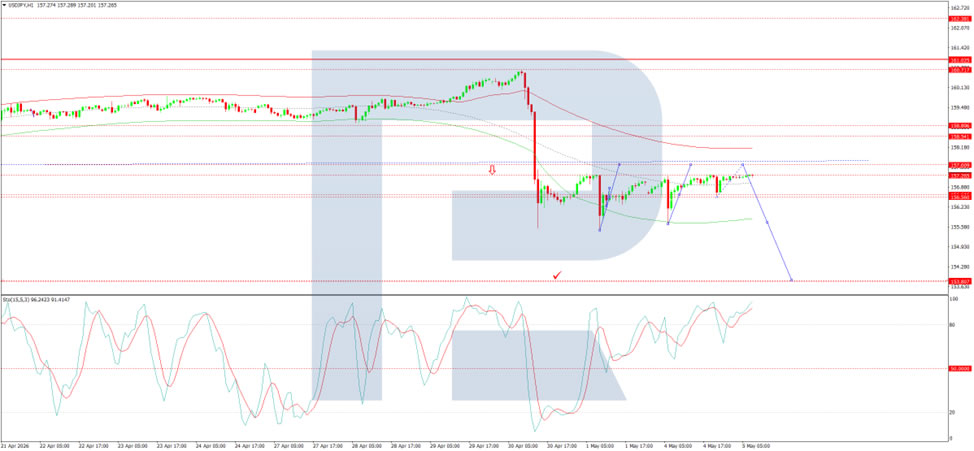
On the H1 chart, the market is attempting a breakout above 157.26. A further push higher towards 157.60 is likely in the near term. After that, a pullback towards 155.77 may follow, with the potential for the decline to extend to 153.80. The Stochastic oscillator supports this view, with its signal line above 80, indicating overbought conditions and suggesting that short-term downside pressure may begin to build once the current upward move fades.
Conclusion
USD/JPY remains supported by renewed demand for the US dollar amid heightened geopolitical tensions and inflation concerns, strengthening the greenback’s defensive appeal. However, the risk of renewed intervention from Japan continues to cap upside potential, leaving the pair vulnerable to sharp reversals despite the near-term bullish bias.
Swiss CPI Accelerates to 0.6% YoY as Energy Import Costs Rebound
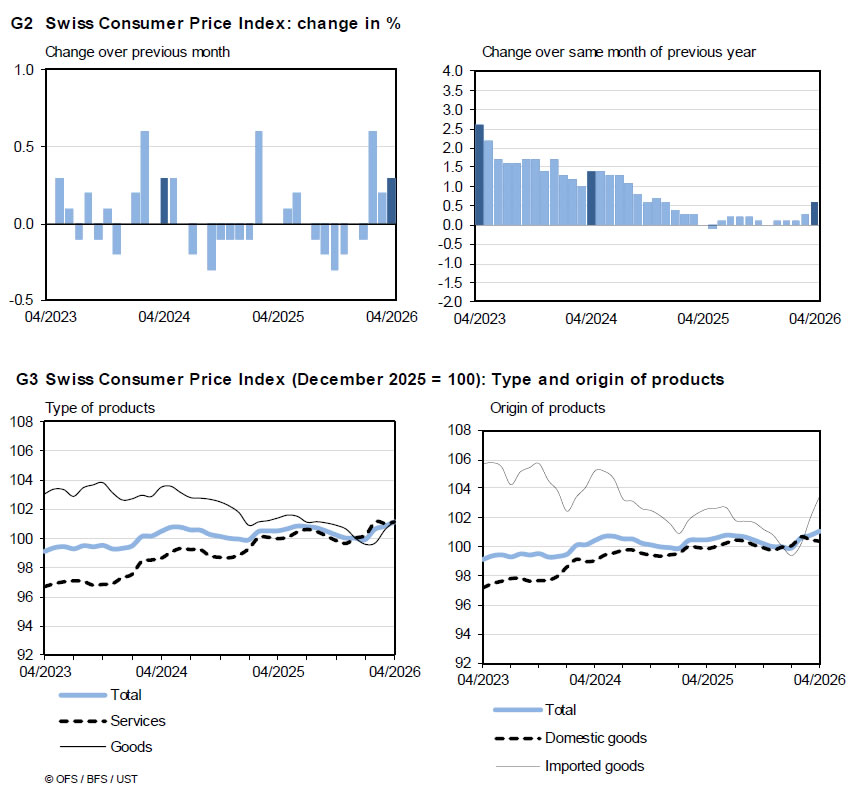
Swiss inflation picked up modestly in April, with headline CPI rising 0.3% month-on-month, driven largely by higher energy and travel-related costs. According to the Federal Statistical Office, increases in petrol, diesel and heating oil prices were key contributors, alongside higher airfares and international package holidays.
The underlying picture remains subdued. Core CPI was flat on the month, while domestic product prices slipped by -0.1% mom, pointing to limited internal price pressures. In contrast, imported product prices jumped 1.5% mom, highlighting that the recent pickup in inflation is being driven primarily by external cost factors rather than domestic demand.
On an annual basis, CPI rose from 0.3% yoy to 0.6% yoy, while core inflation edged lower from 0.4% yoy to 0.3% yoy. Domestic price growth remained unchanged at 0.5% yoy, but imported inflation rebounded sharply from -0.3% yoy to 0.9% yoy.
The data suggest that Switzerland’s inflation remains low overall, with the latest increase largely reflecting rising import costs linked to energy rather than broad-based price pressures.
| Indicator | Previous | Latest |
|---|---|---|
| CPI (YoY) | 0.3% | 0.6% |
| Core CPI (YoY) | 0.4% | 0.3% |
| Domestic Prices (YoY) | 0.5% | 0.5% |
| Imported Prices (YoY) | -0.3% | 0.9% |
Gold (XAUUSD) Chart Suggests 7-Swing Double Correction in Elliot Wave Structure
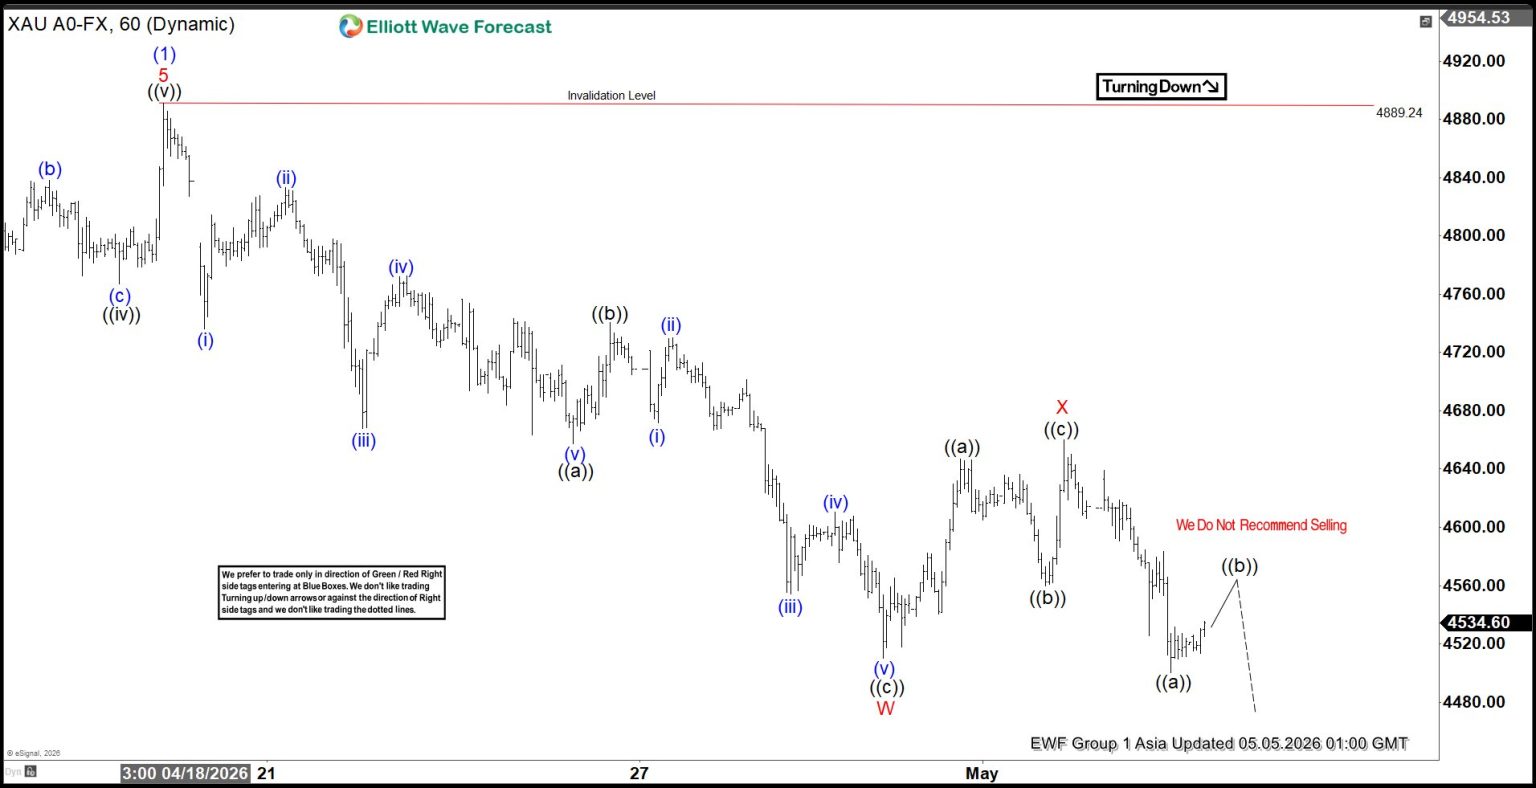
The short‑term Elliott Wave view in Gold (XAUUSD) shows that the rally from the March 23 low completed as wave (1) at 4889.24. After this peak, a corrective pullback in wave (2) began, retracing the cycle from the March 23 low. The internal subdivision of this pullback is unfolding as a double three Elliott Wave structure, a common corrective pattern. From wave (1), the decline in wave ((a)) ended at 4657.48, while the rally in wave ((b)) terminated at 4740.32. The metal then moved lower in wave ((c)), reaching 4509.88, which completed wave W at a higher degree.
The subsequent rally in wave X unfolded as a zigzag structure. Within this sequence, wave ((a)) ended at 4646.95, the pullback in wave ((b)) concluded at 4559.93, and the final leg in wave ((c)) advanced to 4660.28. This completed wave X in higher degree. At present, wave Y lower is progressing, continuing the correction against the cycle from the March 23 low. In the near term, while Gold remains below 4889.24, the expectation is for the metal to extend lower. A retest of the March 23 low at 4098.27 is anticipated before the broader bullish trend resumes. This corrective phase is important to balance the prior rally and prepare the market for the next upward cycle.
Gold 60-Minute Elliott Wave Chart
XAUUSD (Gold) Elliott Wave Video:
https://www.youtube.com/watch?v=htRwG6TgjlA
GBP/JPY Daily Outlook
Daily Pivots: (S1) 211.81; (P) 212.73; (R1) 213.68; More...
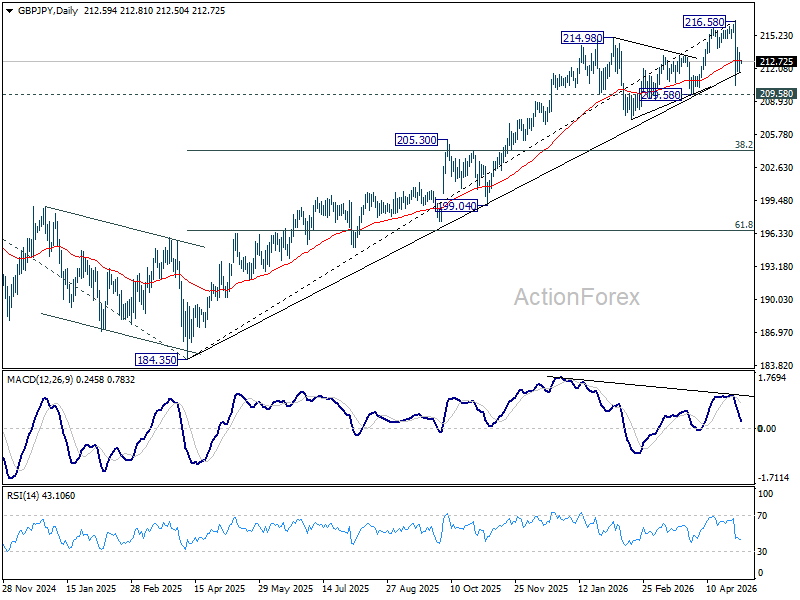
Intraday bias in GBP/JPY stays neutral for consolidations above 210.43. Risk will stay on the downside as long as 55 4H EMA (now at 214.28) holds. Below 210.43 will target 209.58 support first. Break will target 38.2% retracement of 184.35 to 216.58 at 204.28.
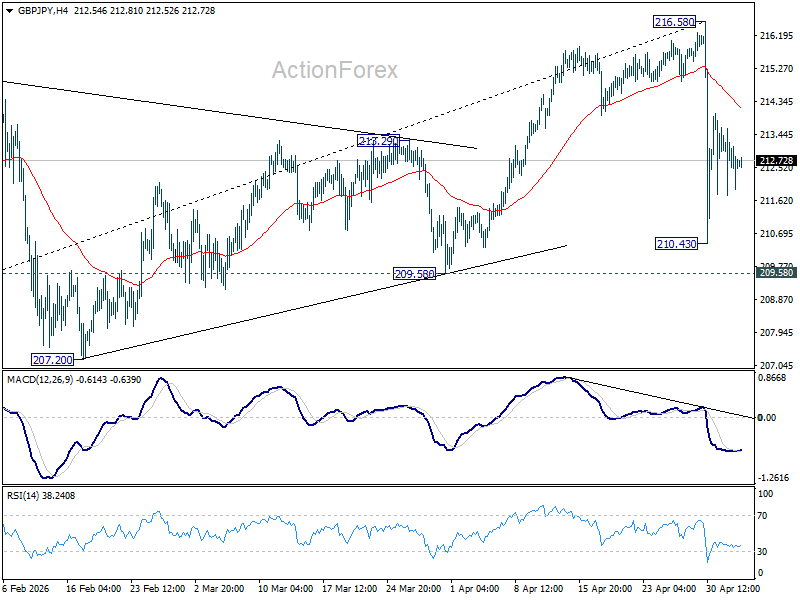
In the bigger picture, while the fall from 216.58 is steep, there is no clear sign of trend reversal yet. The long term up trend could still extend to 61.8% projection of 148.93 (2022 low) to 208.09 (2024 high) from 184.35 at 220.90 on resumption. However, sustained break of 55 W EMA (now at 205.45) will argue that it's already in medium term down trend for 184.35 support.
EUR/JPY Daily Outlook
Daily Pivots: (S1) 182.96; (P) 183.69; (R1) 184.57; More...
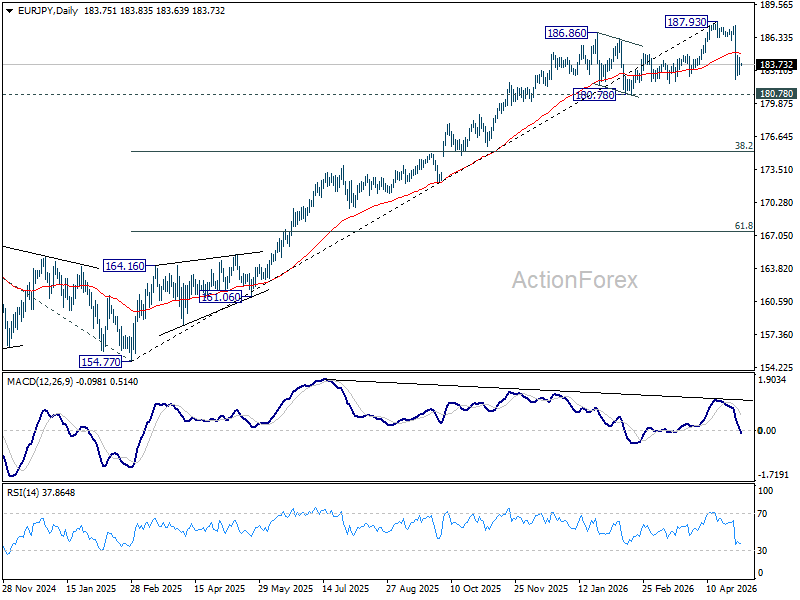
Intraday bias in EUR/JPY stays neutral and more consolidations could be seen above 182.28 temporary low. Risk will stay on the downside as long as 55 4H EMA (now at 185.45) holds. Below 182.28 will extend the fall from 187.93 to 180.78 support.
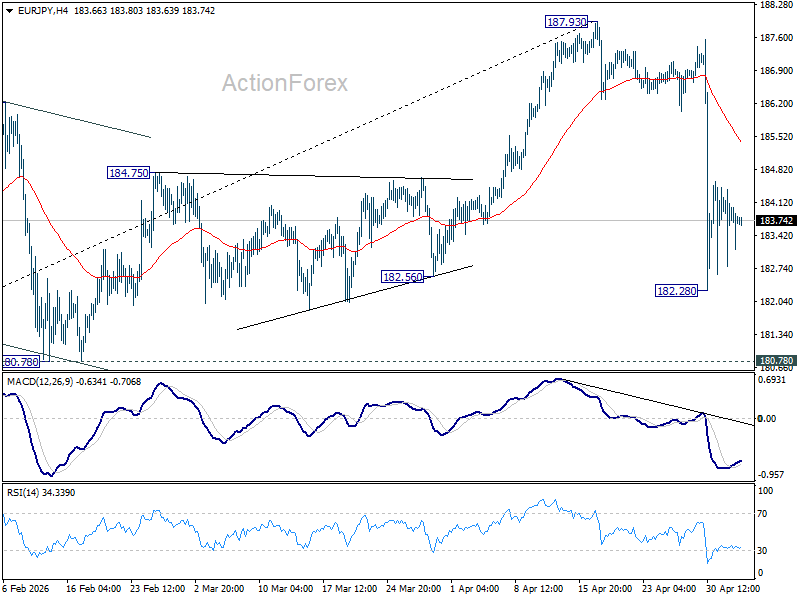
In the bigger picture, the pullback from 187.93 is steep, there is no sign of reversal yet. Uptrend from 114.42 is still expected to resume at a later stage to 78.6% projection of 124.37 (2022 low) to 175.41 (2025 high) from 154.77 at 194.88. However, sustained break of 55 W EMA (now at 177.76) will argue that it's already in a medium term down trend to 175.41 resistance turned support and below.
EUR/GBP Daily Outlook
Daily Pivots: (S1) 0.8629; (P) 0.8640; (R1) 0.8651; More…
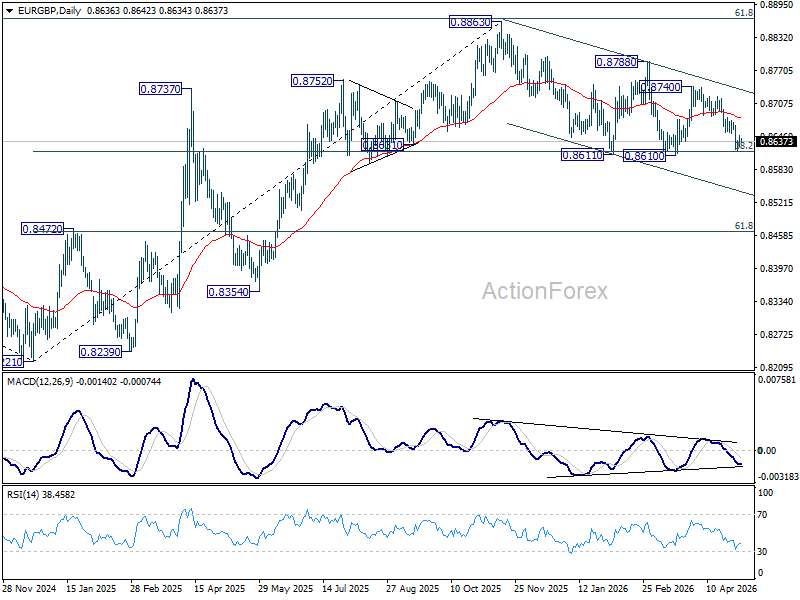
Intraday bias in EUR/GBP remains neutral for the moment, and some more sideway trading could be seen. On the downside, decisive break of 0.8610 key support carry larger bearish implications and pave the way to 0.8466 fibonacci level next. However, firm break of 0.8652 will turn bias back to the upside for stronger rebound to 55 D EMA (now at 0.8681) and above.
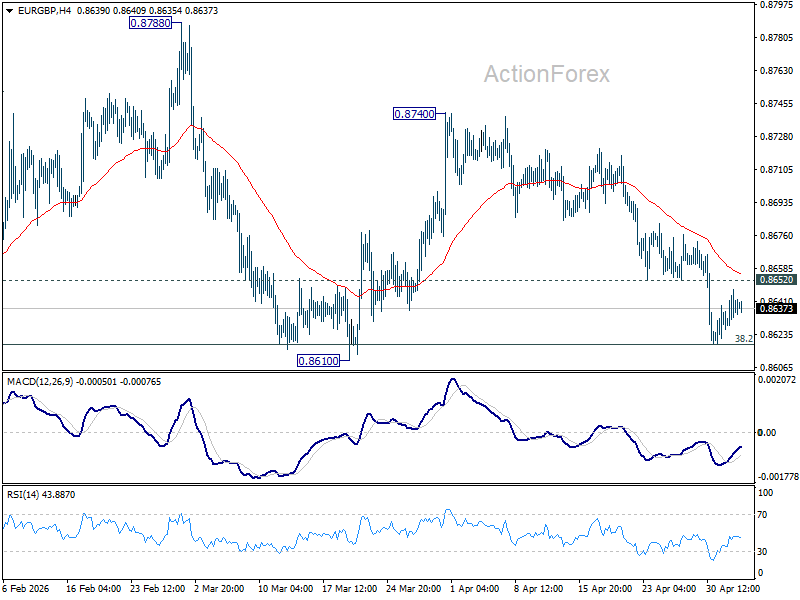
In the bigger picture, focus is back on 38.2% retracement of 0.8821 to 0.8863 at 0.8618. Sustained break there will confirm that whole rise from 0.8221 has completed at 0.8863. Deeper decline should then be seen to 61.8% retracement at 0.8466 at least. For now, risk will stay mildly on the downside as long as 55 D EMA (now at 0.8680) holds, in case of recovery.