Sample Category Title
Eco Data 5/6/26
| GMT | Ccy | Events | Act | Cons | Prev | Rev |
|---|---|---|---|---|---|---|
| 22:45 | NZD | Employment Change Q1 | 0.20% | 0.30% | 0.50% | |
| 22:45 | NZD | Unemployment Rate Q1 | 5.30% | 5.40% | 5.40% | |
| 22:45 | NZD | Labour Cost Index Q/Q Q1 | 0.50% | 0.40% | 0.40% | |
| 01:45 | CNY | RatingDog Services PMI Apr | 52.6 | 52 | 52.1 | |
| 07:50 | EUR | France Services PMI Apr F | 46.5 | 46.5 | 46.5 | |
| 07:55 | EUR | Germany Services PMI Apr F | 46.9 | 46.9 | 46.9 | |
| 08:00 | EUR | Eurozone Services PMI Apr F | 47.6 | 47.4 | 47.4 | |
| 08:30 | GBP | Services PMI Apr F | 52.7 | 52 | 52 | |
| 09:00 | EUR | Eurozone PPI M/M Mar | 3.40% | 3.30% | -0.70% | -0.60% |
| 09:00 | EUR | Eurozone PPI Y/Y Mar | 2.10% | 1.80% | -3% | |
| 12:15 | USD | ADP Employment Change Apr | 109K | 79K | 62K | 61K |
| 14:00 | CAD | Ivey PMI Apr | 57.7 | 49.9 | 49.7 | |
| 14:30 | USD | Crude Oil Inventories (May 1) | -2.3M | -3.4M | -6.2M |
| 22:45 | NZD |
| Employment Change Q1 | |
| Actual | 0.20% |
| Consensus | 0.30% |
| Previous | 0.50% |
| 22:45 | NZD |
| Unemployment Rate Q1 | |
| Actual | 5.30% |
| Consensus | 5.40% |
| Previous | 5.40% |
| 22:45 | NZD |
| Labour Cost Index Q/Q Q1 | |
| Actual | 0.50% |
| Consensus | 0.40% |
| Previous | 0.40% |
| 01:45 | CNY |
| RatingDog Services PMI Apr | |
| Actual | 52.6 |
| Consensus | 52 |
| Previous | 52.1 |
| 07:50 | EUR |
| France Services PMI Apr F | |
| Actual | 46.5 |
| Consensus | 46.5 |
| Previous | 46.5 |
| 07:55 | EUR |
| Germany Services PMI Apr F | |
| Actual | 46.9 |
| Consensus | 46.9 |
| Previous | 46.9 |
| 08:00 | EUR |
| Eurozone Services PMI Apr F | |
| Actual | 47.6 |
| Consensus | 47.4 |
| Previous | 47.4 |
| 08:30 | GBP |
| Services PMI Apr F | |
| Actual | 52.7 |
| Consensus | 52 |
| Previous | 52 |
| 09:00 | EUR |
| Eurozone PPI M/M Mar | |
| Actual | 3.40% |
| Consensus | 3.30% |
| Previous | -0.70% |
| Revised | -0.60% |
| 09:00 | EUR |
| Eurozone PPI Y/Y Mar | |
| Actual | 2.10% |
| Consensus | 1.80% |
| Previous | -3% |
| 12:15 | USD |
| ADP Employment Change Apr | |
| Actual | 109K |
| Consensus | 79K |
| Previous | 62K |
| Revised | 61K |
| 14:00 | CAD |
| Ivey PMI Apr | |
| Actual | 57.7 |
| Consensus | 49.9 |
| Previous | 49.7 |
| 14:30 | USD |
| Crude Oil Inventories (May 1) | |
| Actual | -2.3M |
| Consensus | -3.4M |
| Previous | -6.2M |
Sunset Market Commentary
Markets
The by-nature fragile ceasefire between the US and Iran was weakened severely by yesterday’s skirmishes in the Persian Gulf but survives so far. US Defense Secretary Hegseth detailed Operation Freedom in a press conference today, calling it a defensive and temporary mission to open up the vital Hormuz Strait and added that while the US is locked and loaded, it isn’t “looking for a fight”. Monday’s developments had pushed Brent oil towards the $115 barrier. Prices ease a bit today to around $112. In a broader perspective, the current actual level of oil prices is perhaps not the worrying part. On a closing basis, they haven’t so far surpassed the pre-ceasefire peak just short of $120. But what is changing is that markets are becoming increasingly concerned on the longer-term fall out of the conflict. There are non-linear consequences tied to the duration of the (oil, fertilizer, helium, LNG …) supply disruption in terms of the time it takes to normalize and inflation. The Brent forward curve is shifting higher by the week with financial markets for example now pricing in an at least $100 price through September this year.
Markets move on the rhythm spelled by oil so we’re seeing core bond yields correct a little lower from yesterday’s surge on the slight drop in Brent today. Bund yields change -4 bps to +0.6 bps in a bull steepening move. Net daily changes in the US vary between -0.8 (30-yr) and -1.4 bps (2-yr). It is telling how ultralong maturities barely respond, highlighting the presence of risk premia. The US 30-yr yield rests at 5%, the German variant is on the verge of reaching new 15-year highs. UK markets were closed yesterday for May Day and are now catching up. Gilt yields rally 10-12 bps. The UK 30-yr yield hit its highest level since 1998. European equity markets recoup some of the 2% losses at the start of the week with gains mounting to 1.4% (EuroStoxx50). US equities open between 0.2 and 1% higher. FX markets are treading water. EUR/USD is flat on the day around 1.17. Same goes for the trade-weighted dollar index around 98.5. The yen is among the few showing some volatility. Drawing conclusions comes with caution since Japanese markets are closed through Wednesday. Last week’s interventions (reportedly) are being further undone for a third day straight. USD/JPY hit a two-month low of 156.6 but has recovered the last couple of trading sessions to 157.8 currently.
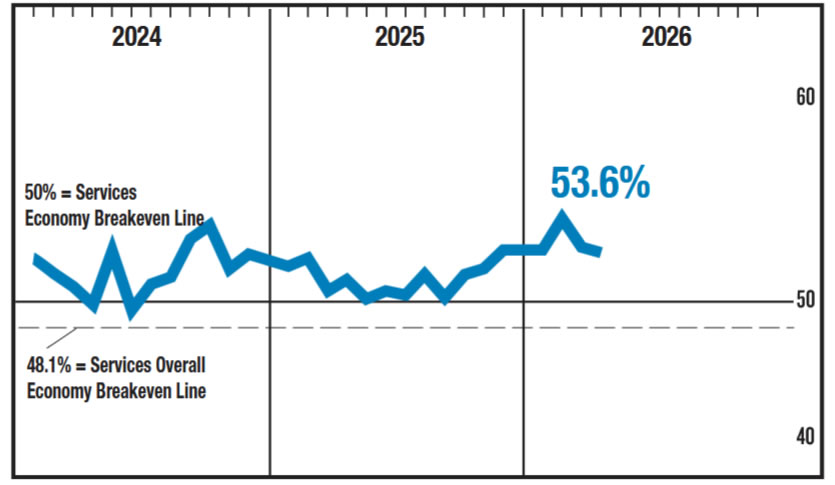
The March JOLTS report and April US services ISM were perhaps the only important event from a market point of view today. The headline number printed in line with expectations at 53.6. The new orders component retreated more than expected from March’s 60.6 to 53.5 while the unemployment gauge improved to a still contractionary 48. Prices paid stabilized at a 4-year high of 70.7, defying odds for an uptick to 73.5. March JOLTS job openings at 6.8 million were in line with the readings of the last year so far. Both the USD and yields shrugged at the outcome.
News & Views
The Swiss Statistical office today reported headline inflation in the country in April accelerated to 0.3% M/M and 0.6% Y/Y (from 0.2% M/M and 0.3% Y/Y in March). The monthly rise was due to factors including rising prices for petrol, diesel and heating oil. Prices for air transport also increased, as did international package holidays. Core inflation was unchanged M/M and even eased to 0.3% Y/Y from 0.4%. Especially inflation of domestic products (-0.1% M/M, 0.5% Y/Y) remains very modest which is also visible in subdued services inflation (0.1% M/M and 1.1% Y/Y). Imported good prices accelerated further to 1.5% M/M and 0.9% Y/Y (from 1.8% M/M and -0.3% Y/Y). Goods price deflation is gradually coming to an end (0.6% M/M and -0.2% Y/Y from -0.7%Y/Y). With inflation holding in the lower part of the 0-2% band, the SNB can feel comfortable to hold the policy rate at 0%. A risk-off spike in the franc caused EUR/CHF to test the 0.90 area early March. Strong SNB intervention warnings (and perhaps to be confirmed actual CHF) caused the franc to settle in the 0.915/0.925 trading range over the previous month.
The minority government of Romania led by Ilie Bolojan was toppled after a confidence vote supported by the nationalist far right AUR (Alliance for the Unity of Romanians) and the Social Democrats (PSD). The latter left the collation last month over disagreement with some austerity measures that PM Bolojan introduced to address a 7.65% budget deficit (2025). Reforms were a condition for the country to get access to additional EU funds. The country now faces a (potentially long) period of political uncertainty as it might not be evident for the President to bring together parties that are able/prepared to form a majority in a fractured parliament. The Romanian leu at 5.217 trades near its all-time low against the euro. A 10-y domestic government bond shows a yield near 7.25%.
US ISM Services Eases to 53.6, Prices Index Holds Near Multi-Year High
US ISM Services PMI edged down from 54.0 to 53.6 in April, slightly missing expectations of 53.8 but still remaining above the 12-month average of 52.5, indicating continued expansion in the sector. Fourteen industries reported growth, one more than in March, while the number of industries in contraction held steady at three, pointing to a broadly resilient services economy.
Details of the report were mixed but generally supportive. Business activity rose from 53.9 to 55.9, signaling stronger output, while the employment index improved from 45.2 to 48.0, though it remains in contraction territory. The data suggest that while hiring is stabilizing, momentum in services output remains intact.
Inflation pressures remain a key concern. The prices index held at 70.7, its highest level since October 2022, and has stayed above 60 for 17 consecutive months. ISM noted that rising costs for materials such as aluminum, copper, lumber, and petroleum products continue to filter through supply chains, with further upward pressure expected in coming months.
Historically, a PMI reading at this level is consistent with around 1.7% annualized GDP growth.
| Indicator | Previous | Latest | Notes |
|---|---|---|---|
| PMI Services | 54.0 | 53.6 | Slight dip, still expanding |
| Business Activity | 53.9 | 55.9 | Stronger output |
| Employment | 45.2 | 48.0 | Improving but still <50 |
| Prices Index | 70.7 | 70.7 | Highest since Oct 2022 |
FX Confusion as the US Dollar Forms a Double Bottom – Can the Ceasefire Stand? DXY Outlook
- The US Dollar recovered a good part of its losses in the early week, forming a key double-bottom – More upside to come?
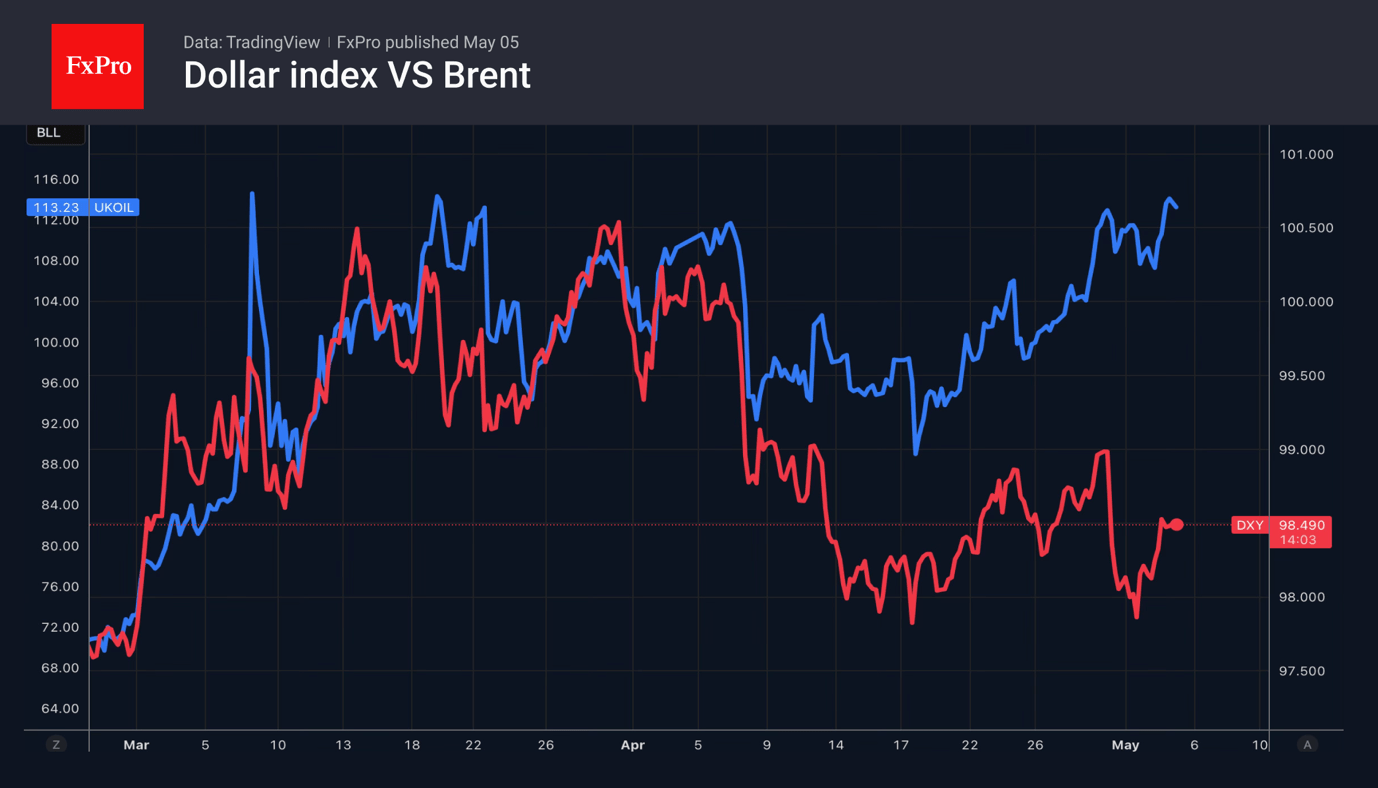
- With Oil bouncing back above $105, its correlation with the FX Market picks up again
- US Dollar Index (DXY) in-depth Technical Analysis
The US Dollar regained much of its early-week losses and formed a double-bottom pattern on the charts, making traders question if more gains are ahead. As WTI Crude jumped back above $105, the link between energy prices and the wider FX market is growing stronger again.
After all, if the past session’s speech by Fed’s Williams (the most influential voter at the Federal Reserve) showed elevated concerns about energy prices, there are many reasons to put emphasis on their price rises as traders.
Still, the NY Fed’s president eased the influence of hiking dissents, so for now, this is won’t add to the nascent flame in the Dollar.
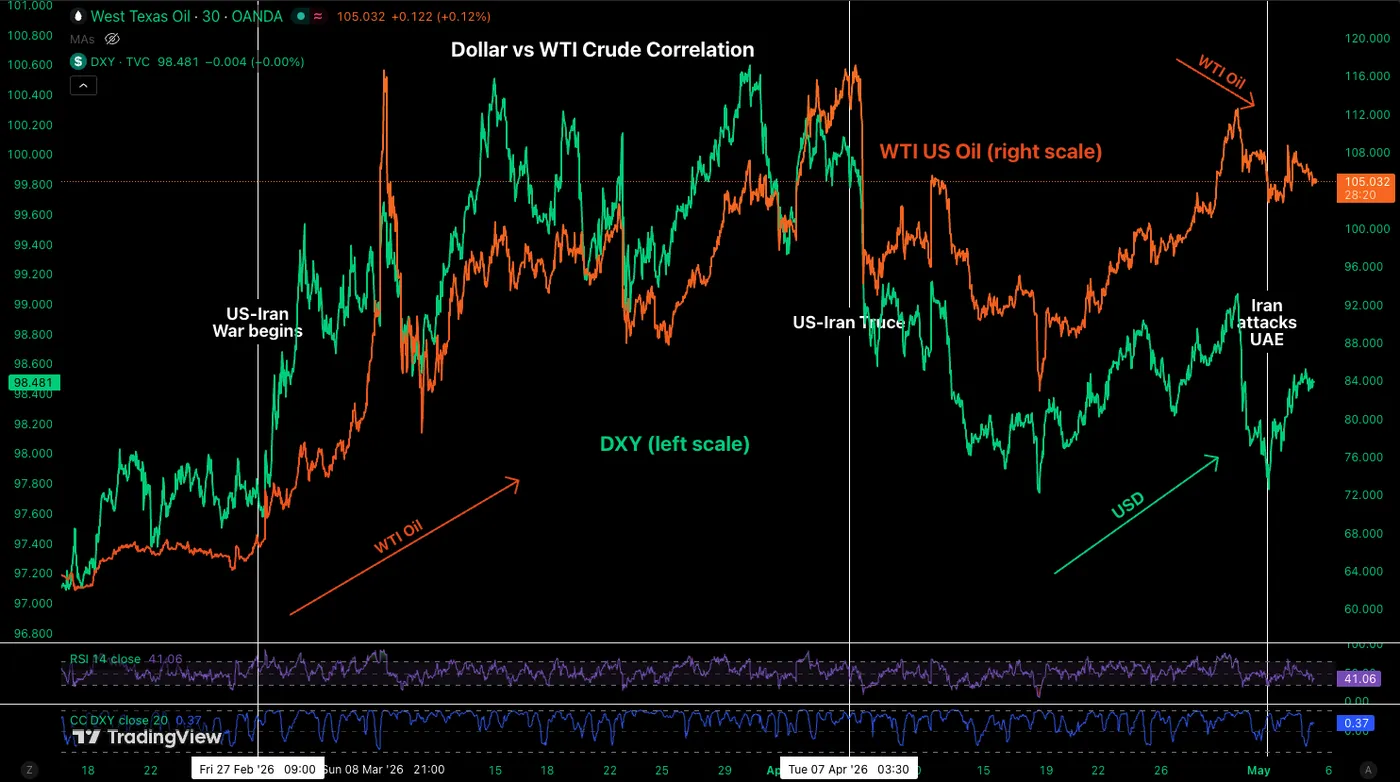
WTI Crude and Dollar Index (DXY) Correlation since Late February – Source: TradingView
Many in the market hoped to move past this long conflict.
But after yesterday’s serious geopolitical events, dollar bulls quickly returned to price in the risk of renewed war.
The semi-official Fars Agency reported that Iran launched missiles at US Navy ships in Iranian waters and carried out drone strikes on the UAE.
The US military and Israel are reportedly working together on possible limited responses. With the ceasefire just failing to lead to real diplomatic progress, hopes for peace could soon fall apart.
As a result, the wider FX markets are now at pivotal turning points, with the US Dollar leading the way, so we will look at the currency to spot how it could influence the action.
The Greenback is close to breaking its recent downtrend that followed the ceasefire.
If Crude oil rallies further, especially if it moves above $110, the petrodollar trade could quickly accelerate. Traders should keep a close eye on the war situation to see if any major breakouts are supported by real changes.
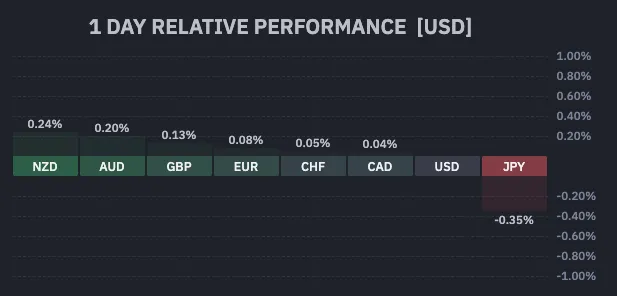
FX Performance (09:06 ET) – Source: TradingView. May 5, 2026
We’ll explore a few scenarios for upcoming action in an in-depth technical analysis of DXY.
Dollar Index (DXY) Multi-Timeframe Analysis
Daily Chart
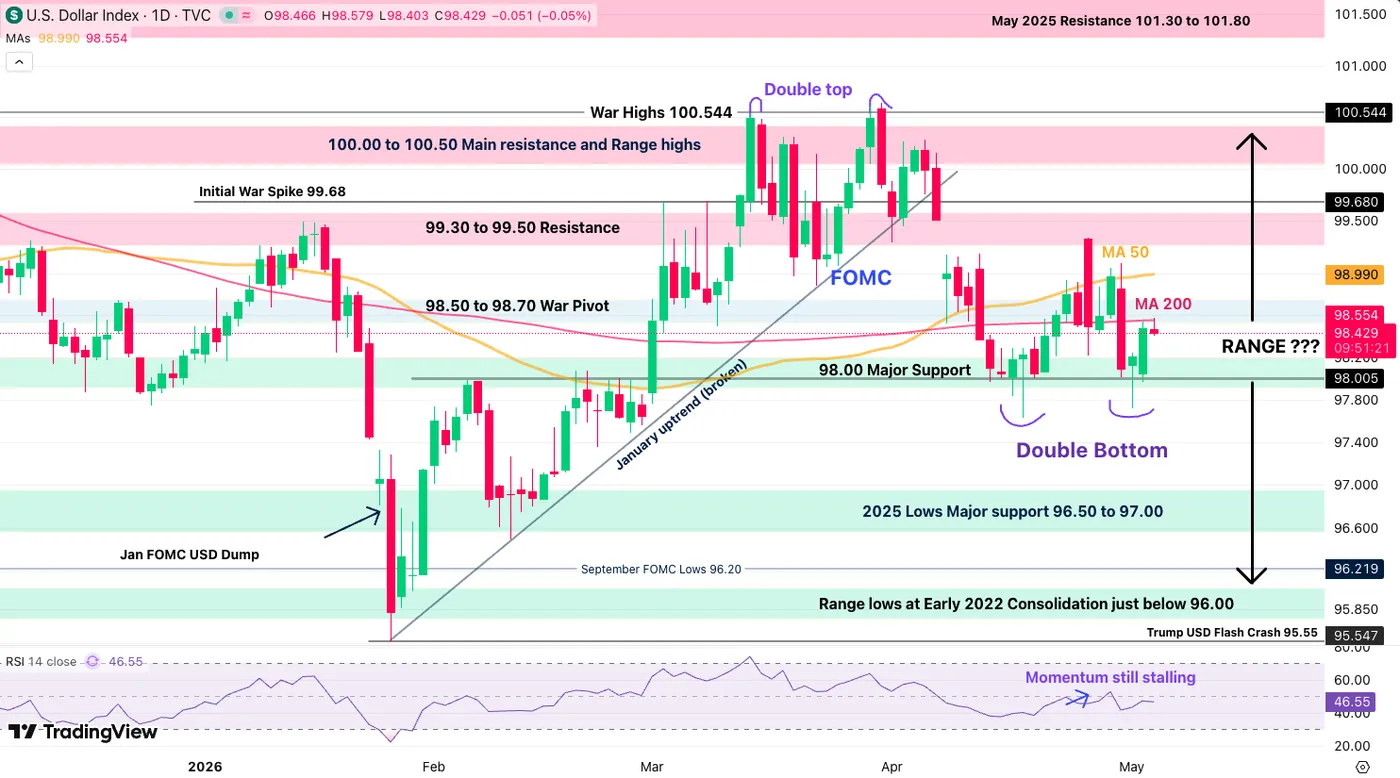
Dollar Index (DXY) Daily Chart. May 5, 2026 – Source: TradingView
The US Dollar is stalling right at the middle of its 96.00 to 100.00 July 2025 range, forming a double bottom after repeatedly failed diplomatic attempts.
The Daily moving averages are now flattening, showing the general confusion across the FX and overall Markets – With the 200-Day MA getting tested in the morning, right at the 98.50 level, traders will want to see if it holds or breaks to power the next moves in currencies.
Let's take a closer look.
4H Chart and Technical Levels
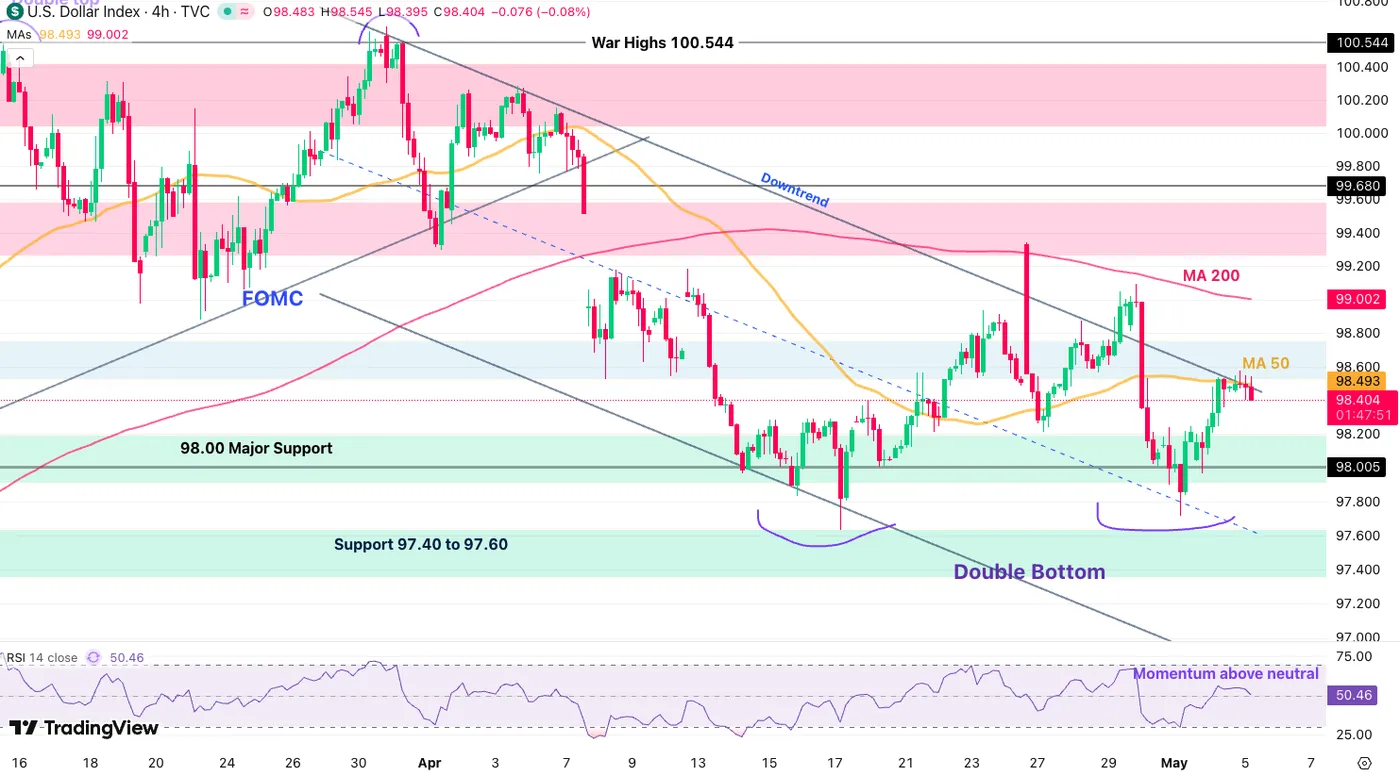
Dollar Index (DXY) 4H Chart. May 5, 2026 – Source: TradingView
The immediate action is tricky:
Sellers are attempting an entry at the downward channel top and 4H 50-period MA, but their momentum is shy.
Two scenarios should help to discern upcoming action.
- Above 98.60, the rally in the dollar confirms, with the next key level entering at 99.00 (and possibility for 99.50)
- Below 98.20, the bear channel holds and this could point to a test of 97.60 in coming days (this would require a lower WTI Crude).
Depending on the bull/bear scenarios, look for trades in FX pairs which provide interesting risk-reward scenarios, including EUR/USD, GBP/USD and GBP/USD – Don't forget to do your own due diligence!
Levels to place on your DXY charts:
Resistance Levels
- 98.50 4H 50-period MA & 200-day MA
- 99.00 4H 200-period MA
- 99.30 to 99.50 Resistance
- 100.00 to 100.50 Main resistance and Range highs
- War Highs 100.544 (Double Top)
Support Levels
- 98.00 Major Support
- Support 97.40 to 97.70 (double bottom level)
- 2025 Lows Major support 96.50 to 97.00 (bear channel lows)
- Range lows at Early 2022 Consolidation just below 96.00
Safe Trades and keep track of the latest headlines!
Canada’s Trade Books Flip to a Surplus in March
Canada's trade balance moved into a $1.8 billion surplus in March, from a $5.1 billion deficit the prior month.
Exports in March surged by 8.5% month-on-month (m/m) following February's sturdy gain. Rapidly rising energy prices pushed crude oil exports up 18.9% m/m, while exports of unwrought gold, silver, and platinum rose by a sizeable 37.7% m/m. Meanwhile, exports of motor vehicles and parts (+4.5% m/m) rose again in March as they continued their recovery from January's depressed level. In total, 7 of 11 product categories registered a gain.
Goods imports decreased by 1.6% m/m in March, paring some of the prior month's robust 9.4% monthly gain, with 8 of 11 subsectors booking a loss. Consumer goods imports (-3.9% m/m) and imports of aircraft and other transportation equipment (-12.8% m/m) contributed most to the monthly decline.
In volume terms, exports edged lower by 0.3% m/m while imports fell by a larger 2.0% m/m.
Canada's merchandise trade surplus with the United States widened from $2.9 billion in February to $7.1 billion in March. Exports to non-U.S. destinations rose by a healthy 9.1% m/m, setting a new all-time high.
Key Implications
March's trade data showed some firming in headline activity, though all of the positive print in exports came from price impacts of higher oil prices. With data up until March in the books, net trade still appears poised to subtract from Q1 2026 real GDP growth, reflecting a broadly stronger quarter for imports. Looking ahead, higher oil prices should meaningfully lift nominal export values into Q2, helping to further improve the trade balance.
The upcoming USMCA renegotiation remains a key near-term risk for Canada. With the July 1st review approaching, renewed engagement between Canadian and U.S. officials is a positive first step, but concrete outcomes remain limited. Our base case continues to assume the agreement stays intact, though elevated uncertainty is likely to restrain business confidence and investment decisions.
Politics is Weighing on the Pound
- Labour risks losing the local elections, which could pressure GBPUSD.
- Japan may be able to afford further currency intervention.
The US dollar capitalised on the pullback in stock indices from record highs and the surge in Brent futures. Buyers of the USD index stepped up their pressure, driven by rising demand for safe-haven assets and a worsening economic outlook in the eurozone amid higher energy prices.
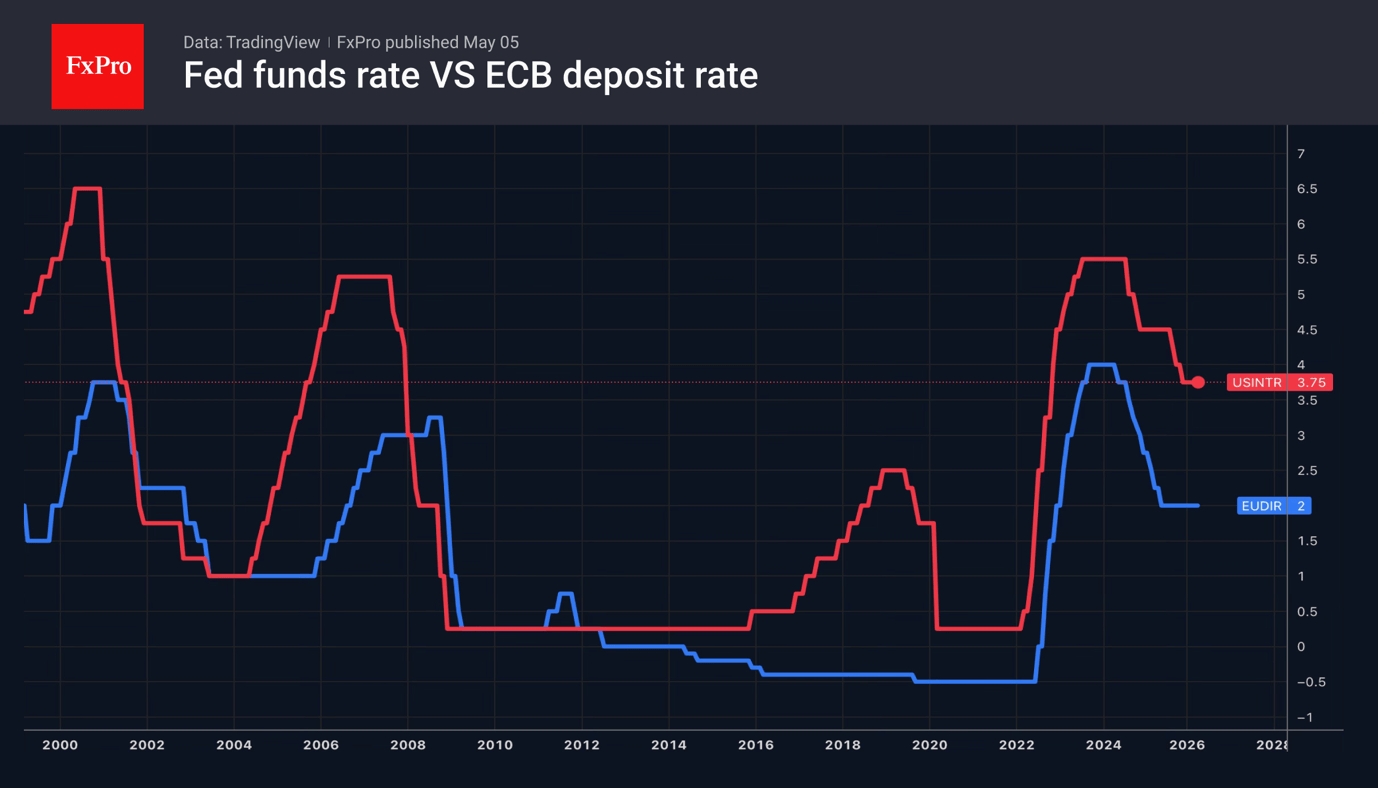
The escalation of the conflict in the Middle East has reignited investor interest in the US dollar as a safe-haven asset. At the same time, oil prices have risen, as have the risks of a surge in US inflation. To combat this, the Fed may raise interest rates this year, with the likelihood of such a move rising from 11% to 32%.
The Bundesbank is prepared to follow the ECB’s path of monetary tightening. According to Bundesbank President Joachim Nagel, the objective is clear: to bring inflation back to 2% in the medium term. If this does not happen, interest rates will have to be raised. Nevertheless, investors view such rhetoric as a ‘hawkish’ bluff. EU Economic Affairs Commissioner Valdis Dombrovskis argues that Europe is facing a stagflationary shock, as high energy prices are pushing the region towards higher inflation and slower GDP growth.
The yen’s appreciation over three consecutive days following currency intervention has prompted the Ministry of Finance to comment on the rules. The IMF regards this entire period as a single episode. Unless there are up to three such episodes within six months, the exchange rate regime will not be changed from a managed float to a free float. This means that Japan may resume selling USDJPY until 5 May.
The escalation in the Middle East and the approaching local elections in Britain are putting pressure on GBPUSD. Labour risks losing the vote due to Keir Starmer’s weakened approval ratings. Rising political uncertainty is driving volatility in the pound and a decline in its exchange rate.
EUR/USD Mid-Day Outlook
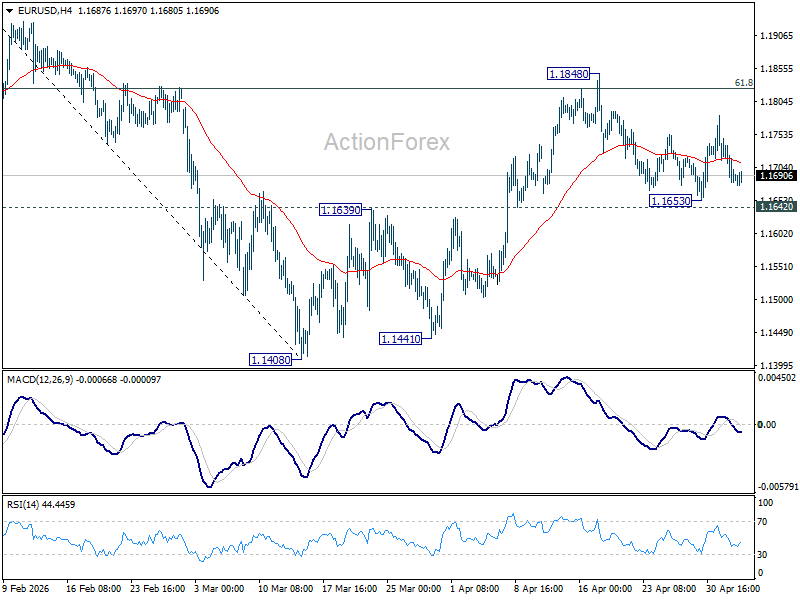
Daily Pivots: (S1) 1.1664; (P) 1.1707; (R1) 1.1732; More….
Range trading continues in EUR/USD and intraday bias stays neutral. Rise from 1.1408 is expected to continue as long as 1.1642 support holds. Firm break of 1.1848 will target 1.2081 high next. However, firm break of 1.1662 support will indicate the the rebound from 1.1408 has completed, and bring deeper decline back towards this low instead.
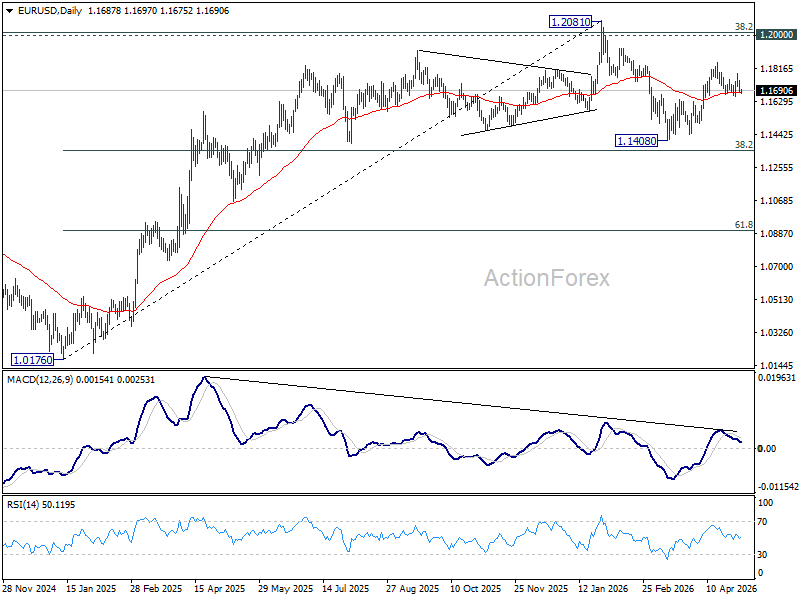
In the bigger picture, the strong support from 38.2% retracement of 1.0176 to 1.2081 at 1.1353 suggests that the pullback from 1.2081 is more likely a corrective move. Strong support was also found in 55 W EMA (now at 1.1537). Focus is back on 1.2 key cluster resistance level. Decisive break there will carry long term bullish implications. Nevertheless, break of 1.1408 support will revive the case of medium term bearish trend reversal.
GBP/USD Mid-Day Outlook
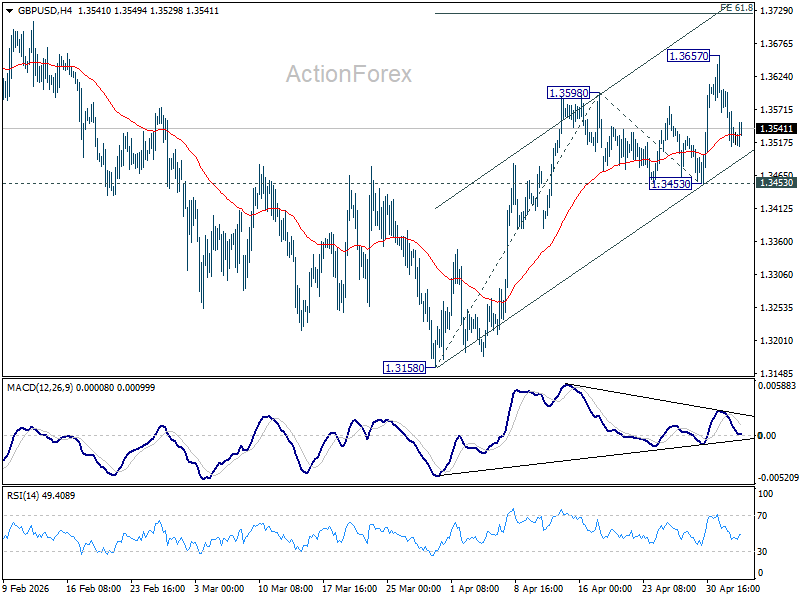
Daily Pivots: (S1) 1.3542; (P) 1.3601; (R1) 1.3634; More...
Intraday bias in GBP/USD stays neutral as consolidations continue. Further rise is still expected as long as 1.3453 holds. Above 1.3657 will target 61.8% projection of 1.3158 to 1.3598 from 1.3453 at 1.3725 first. Firm break there will target a retest on 1.3867 high. However, break of 1.3453 will turn bias back to the downside for 1.3158 support instead.
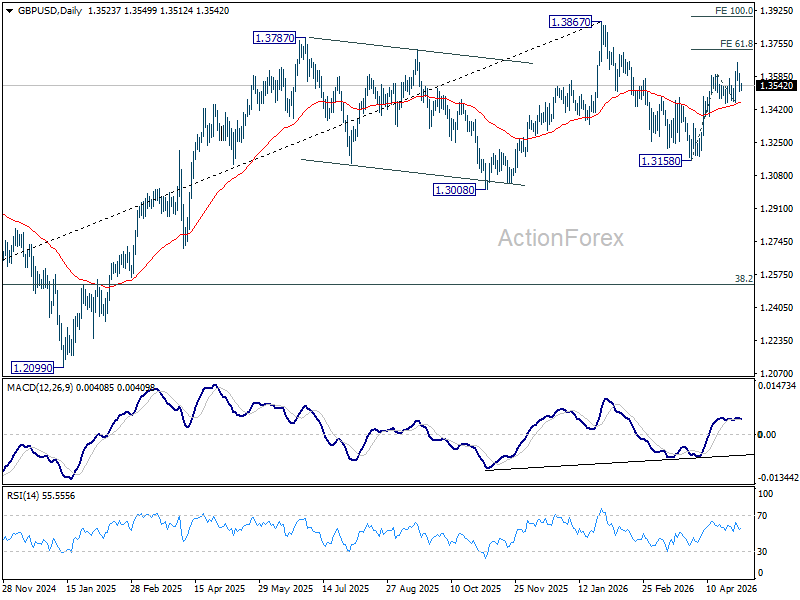
In the bigger picture, current development suggests that price actions from 1.3867 are merely a corrective pattern within the broader up trend from 1.0351 (2022 low). With 1.3008 support intact, medium term bullishness is maintained and break of 1.3867 is in favor for a later stage, towards 1.4248 key resistance (2021 high).
USD/CHF Mid-Day Outlook
Daily Pivots: (S1) 0.7808; (P) 0.7829; (R1) 0.7861; More….
USD/CHF is staying in consolidations above 0.7778 and intraday bias remains neutral. Risk will remain on the downside as long as 0.7923 resistance holds. Firm break of 61.8% projection of 0.8041 to 0.7774 from 0.7923 at 0.7758 will extend the fall from 0.8041 to 100% projection at 0.7656. However, firm break of 0.7923 will turn bias back to the upside for stronger rebound.
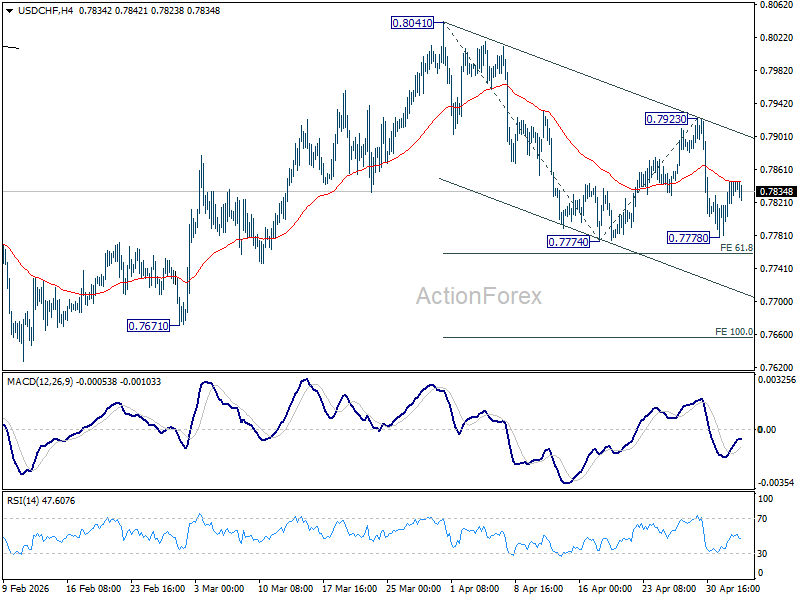
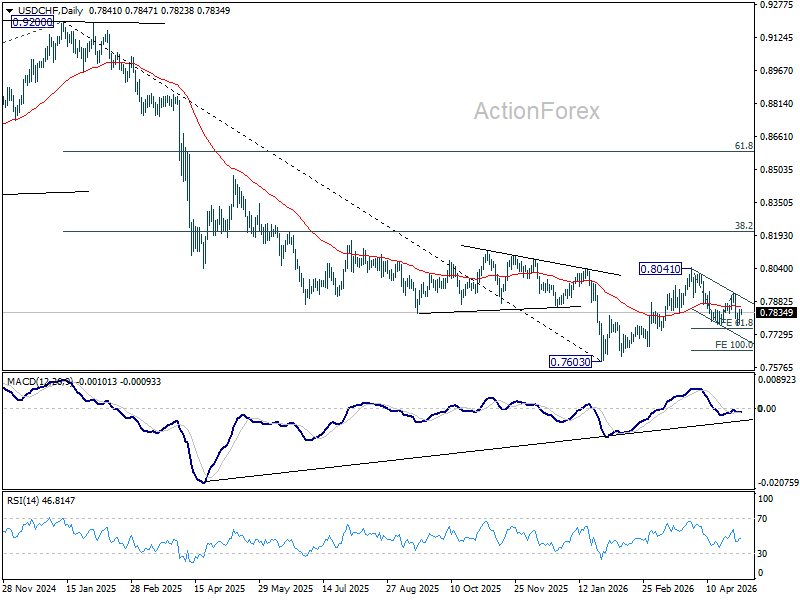
In the bigger picture, rebound from 0.7603 medium term bottom is seen as correcting the fall from 0.9200 only. Rejection by 55 W EMA (now at 0.8042) will affirm this bearish case, and setup down trend resumption to 100% projection of 1.0146 (2022 high) to 0.8332 from 0.9200 at 0.7382 at a later stage. Though, sustained break of 55 W EMA will suggest that it's probably correcting the larger scale down trend from 1.0146 (2022 high).
Is USD/JPY Heading Back to 160? Not Yet—Unless Yields Break 4.5% and Oil Hits $120
Is USD/JPY heading back to 160? For now, the answer is no—but the risk is clearly building as global yield dynamics shift and geopolitical tensions intensify. The Yen is back under pressure today, driven primarily by widening rate differentials as US and European yields continue to climb.
The US 10-year Treasury yield has surged above 4.45% and is now approaching the key 4.5% mark, a level that has previously acted as a psychological ceiling. The move is being fueled by a combination of factors: renewed geopolitical tensions in the Middle East, rising inflation concerns linked to higher energy prices, and a shift in Federal Reserve expectations away from rate cuts.
Energy markets remain on high alert as the fragile ceasefire between the US and Iran shows signs of breaking down. Elevated oil prices are reinforcing inflation risks, which in turn are pushing bond yields higher. Markets are increasingly concerned that sustained energy-driven price pressures could delay disinflation and force the Fed to tighten policy again.
This repricing is already visible in interest rate markets. Fed funds futures are now assigning nearly a 30% probability of a rate hike by year-end, while expectations for rate cuts have largely been priced out. The shift marks a significant turnaround in policy expectations and is providing strong support for US yields.
The global yield move is not limited to the US. Germany’s 10-year Bund yield has risen above 3.05%, while the UK 10-year gilt yield has climbed to 5.04%. These moves reflect both the global nature of the inflation shock and the possibility that the ECB and BoE would also need to maintain or even tighten policy at the next meeting.
For the Yen, widening yield differentials are once again driving weakness. USD/JPY has rebounded following last week’s sharp decline, though the current move still appears to be driven more by short covering than fresh directional positioning.
That said, the outlook could change quickly if key thresholds are breached. A sustained move in US 10-year yields above 4.5% would likely trigger a stronger wave of algorithmic selling in the Yen, amplifying upward pressure on USD/JPY. At the same time, a further rise in oil prices toward the $120 level would reinforce inflation fears and strengthen the case for higher global yields.
Intervention risk remains a complicating factor. Japanese authorities are reported to have deployed more than USD 30 billion in last week's operations that helped push USD/JPY back toward the 155 area. Officials have also signaled a willingness to act again, even during the Golden Week holiday period.
However, intervention may prove less effective if underlying market forces intensify. Acting against a backdrop of rising yields and surging oil prices would present a much more difficult challenge. In such a scenario, attempts to stabilize the Yen could slow the move, but are unlikely to reverse the broader trend.
For now, USD/JPY remains contained within last week’s range, suggesting that markets are not yet fully committed to a renewed push higher. But with yields and oil prices approaching key trigger levels, the risk of a move back toward 160 is no longer hypothetical—it is conditional.
For the day so far, Yen is currently the worst performer, followed by Dollar, and then Euro. Kiw is the strongest, followed by Aussie and then Loonie. Sterling and Swiss Franc are positioning in the middle.
Swiss CPI Accelerates to 0.6% YoY as Energy Import Costs Rebound
A rise in Swiss CPI masks weak underlying inflation. Energy-driven import costs are lifting headline prices, but core inflation is flat and domestic pressures are subdued. The trend suggests limited internal inflation momentum. Read More.
RBA Hikes to 4.35%, Signals It’s Not Done Yet
RBA raise interest rate as expected, and signaled a clear shift to higher-for-longer policy. Inflation is now expected to peak higher and fall more slowly, while growth forecasts are being downgraded. With rates projected near 4.7% through 2028, the central bank is preparing for a prolonged fight against persistent price pressures. Read more.
Gold Slides on Hormuz Attacks, 4,400 Breakdown in Focus, 4,000 Next
Gold is under renewed pressure as Hormuz tensions escalate and oil prices surge. Iran’s attacks on ships and a UAE oil port have intensified supply fears, lifting the Dollar and shifting focus back to inflation risks. With 4,400 support now under threat, a breakdown could accelerate the slide toward the 4,000 level. Read More.
USD/JPY Mid-Day Outlook
Daily Pivots: (S1) 156.22; (P) 156.76; (R1) 157.79; More...
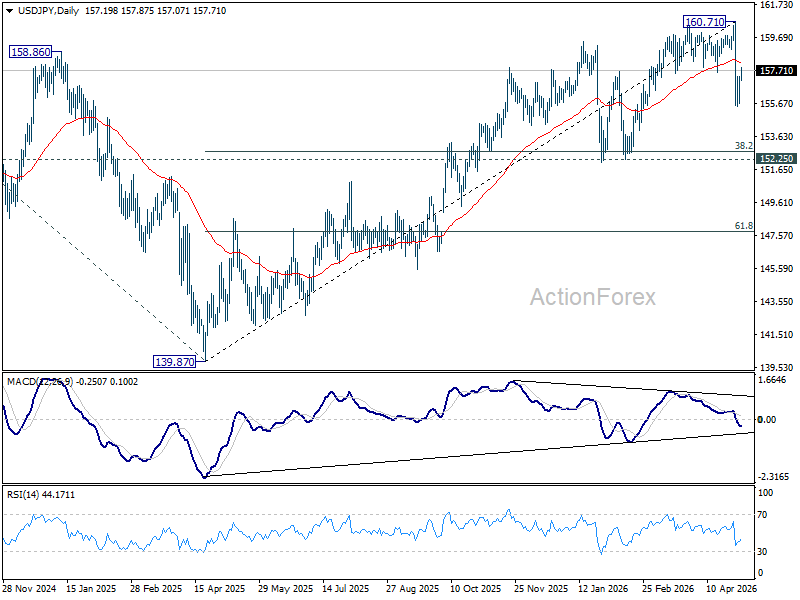
USD/JPY's recovery from 155.48 accelerates higher today, but it stays below 55 4H EMA (now at 158.27). Intraday bias remains neutral and further decline is still in favor. Below 156.55 minor support will bring retest of 155.48. Break there will extend the fall from 160.71 and target 152.25 cluster support (38.2% retracement of 139.87 to 160.71 at 152.74). However, sustained break of the 55 4H EMA will bring stronger rebound back to retest 160.71 high.
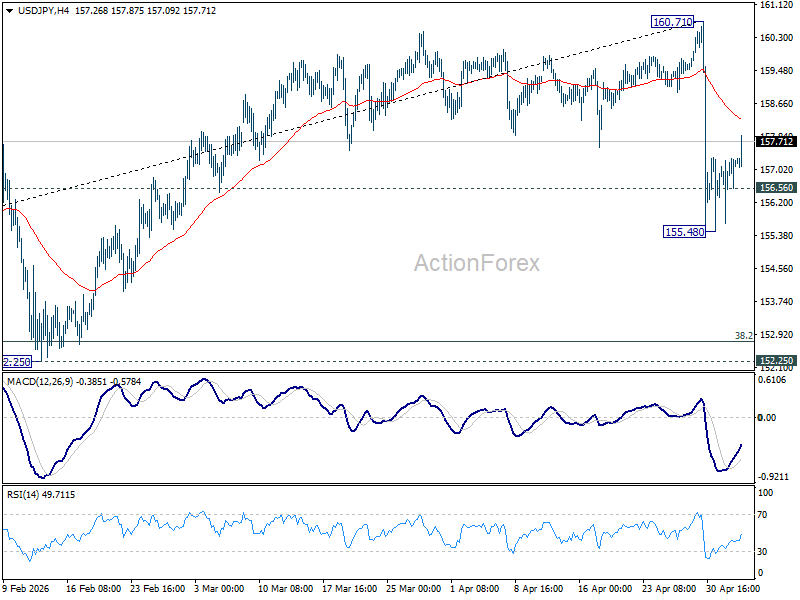
In the bigger picture, for now, corrective pattern from 161.94 (2024 high) is still seen as completed at 139.87. Rise from there is seen as resuming the long term up trend. So, break of 161.94 is expected at a later stage to resume the long term up trend. However, sustained break of 55 W EMA (now at 154.03) will dampen this view and bring deeper fall back towards 139.87 to extend the pattern from 161.94.