

Sample Category Title
Summary 5/4 – 5/8
Monday, May 4, 2026
| GMT | Ccy | Events | Cons | Prev |
|---|---|---|---|---|
| 01:00 | AUD | TD-MI Inflation Gauge M/M Apr | 1.30% | |
| 07:30 | CHF | Manufacturing PMI Apr | 51.9 | 53.3 |
| 07:50 | EUR | France Manufacturing PMI Apr F | 52.8 | 52.8 |
| 07:55 | EUR | Germany Manufacturing PMI Apr F | 51.2 | 51.2 |
| 08:00 | EUR | Eurozone Manufacturing PMI Apr F | 52.2 | 52.2 |
| 08:30 | EUR | Eurozone Sentix Investor Confidence May | -20.5 | -19.2 |
| 14:00 | USD | Factory Orders M/M Mar | 0.40% | 0.00% |
| 01:00 | AUD |
| TD-MI Inflation Gauge M/M Apr | |
| Consensus | |
| Previous | 1.30% |
| 07:30 | CHF |
| Manufacturing PMI Apr | |
| Consensus | 51.9 |
| Previous | 53.3 |
| 07:50 | EUR |
| France Manufacturing PMI Apr F | |
| Consensus | 52.8 |
| Previous | 52.8 |
| 07:55 | EUR |
| Germany Manufacturing PMI Apr F | |
| Consensus | 51.2 |
| Previous | 51.2 |
| 08:00 | EUR |
| Eurozone Manufacturing PMI Apr F | |
| Consensus | 52.2 |
| Previous | 52.2 |
| 08:30 | EUR |
| Eurozone Sentix Investor Confidence May | |
| Consensus | -20.5 |
| Previous | -19.2 |
| 14:00 | USD |
| Factory Orders M/M Mar | |
| Consensus | 0.40% |
| Previous | 0.00% |
Tuesday, May 5, 2026
| GMT | Ccy | Events | Cons | Prev |
|---|---|---|---|---|
| 04:30 | AUD | RBA Interest Rate Decision | 4.35% | 4.10% |
| 05:30 | AUD | RBA Press Conference | ||
| 06:30 | CHF | CPI M/M Apr | 0.40% | 0.20% |
| 06:30 | CHF | CPI Y/Y Apr | 0.30% | |
| 12:30 | CAD | Trade Balance (CAD) Mar | -2.8B | -5.7B |
| 12:30 | USD | Trade Balance (USD) Mar | -59.0B | -57.3B |
| 13:45 | USD | Services PMI Apr F | 51.3 | 51.3 |
| 14:00 | USD | ISM Services PMI Apr | 53.8 | 54 |
| 04:30 | AUD |
| RBA Interest Rate Decision | |
| Consensus | 4.35% |
| Previous | 4.10% |
| 05:30 | AUD |
| RBA Press Conference | |
| Consensus | |
| Previous | |
| 06:30 | CHF |
| CPI M/M Apr | |
| Consensus | 0.40% |
| Previous | 0.20% |
| 06:30 | CHF |
| CPI Y/Y Apr | |
| Consensus | |
| Previous | 0.30% |
| 12:30 | CAD |
| Trade Balance (CAD) Mar | |
| Consensus | -2.8B |
| Previous | -5.7B |
| 12:30 | USD |
| Trade Balance (USD) Mar | |
| Consensus | -59.0B |
| Previous | -57.3B |
| 13:45 | USD |
| Services PMI Apr F | |
| Consensus | 51.3 |
| Previous | 51.3 |
| 14:00 | USD |
| ISM Services PMI Apr | |
| Consensus | 53.8 |
| Previous | 54 |
Wednesday, May 6, 2026
| GMT | Ccy | Events | Cons | Prev |
|---|---|---|---|---|
| 22:45 | NZD | Employment Change Q1 | 0.30% | 0.50% |
| 22:45 | NZD | Unemployment Rate Q1 | 5.40% | 5.40% |
| 22:45 | NZD | Labour Cost Index Q/Q Q1 | 0.40% | 0.40% |
| 01:45 | CNY | RatingDog Services PMI Apr | 52 | 52.1 |
| 07:50 | EUR | France Services PMI Apr F | 46.5 | 46.5 |
| 07:55 | EUR | Germany Services PMI Apr F | 46.9 | 46.9 |
| 08:00 | EUR | Eurozone Services PMI Apr F | 47.4 | 47.4 |
| 08:30 | GBP | Services PMI Apr F | 52 | 52 |
| 09:00 | EUR | Eurozone PPI M/M Mar | 3.30% | -0.70% |
| 09:00 | EUR | Eurozone PPI Y/Y Mar | 1.80% | -3% |
| 12:15 | USD | ADP Employment Change Apr | 79K | 62K |
| 14:00 | CAD | Ivey PMI Apr | 49.9 | 49.7 |
| 14:30 | USD | Crude Oil Inventories (May 1) | -3.4M | -6.2M |
| 22:45 | NZD |
| Employment Change Q1 | |
| Consensus | 0.30% |
| Previous | 0.50% |
| 22:45 | NZD |
| Unemployment Rate Q1 | |
| Consensus | 5.40% |
| Previous | 5.40% |
| 22:45 | NZD |
| Labour Cost Index Q/Q Q1 | |
| Consensus | 0.40% |
| Previous | 0.40% |
| 01:45 | CNY |
| RatingDog Services PMI Apr | |
| Consensus | 52 |
| Previous | 52.1 |
| 07:50 | EUR |
| France Services PMI Apr F | |
| Consensus | 46.5 |
| Previous | 46.5 |
| 07:55 | EUR |
| Germany Services PMI Apr F | |
| Consensus | 46.9 |
| Previous | 46.9 |
| 08:00 | EUR |
| Eurozone Services PMI Apr F | |
| Consensus | 47.4 |
| Previous | 47.4 |
| 08:30 | GBP |
| Services PMI Apr F | |
| Consensus | 52 |
| Previous | 52 |
| 09:00 | EUR |
| Eurozone PPI M/M Mar | |
| Consensus | 3.30% |
| Previous | -0.70% |
| 09:00 | EUR |
| Eurozone PPI Y/Y Mar | |
| Consensus | 1.80% |
| Previous | -3% |
| 12:15 | USD |
| ADP Employment Change Apr | |
| Consensus | 79K |
| Previous | 62K |
| 14:00 | CAD |
| Ivey PMI Apr | |
| Consensus | 49.9 |
| Previous | 49.7 |
| 14:30 | USD |
| Crude Oil Inventories (May 1) | |
| Consensus | -3.4M |
| Previous | -6.2M |
Thursday, May 7, 2026
| GMT | Ccy | Events | Cons | Prev |
|---|---|---|---|---|
| 23:50 | JPY | Monetary Base Y/Y Apr | -10.50% | -11.60% |
| 23:50 | JPY | BoJ Minutes | ||
| 01:30 | AUD | Trade Balance (AUD) Mar | 4.45B | 5.69B |
| 06:00 | EUR | Germany Factory Orders M/M Mar | 1.10% | 0.90% |
| 07:00 | CHF | Foreign Currency Reserves *CHF) Apr | 721B | |
| 08:00 | CHF | Unemployment Rate M/M Apr | 3.00% | 3.00% |
| 08:30 | GBP | Construction PMI Apr | 46.2 | 45.6 |
| 09:00 | EUR | Eurozone Retail Sales M/M Mar | -0.40% | -0.20% |
| 12:30 | USD | Initial Jobless Claims (May 1) | 199K | 189K |
| 12:30 | USD | Nonfarm Productivity Q1 P | 0.70% | 1.80% |
| 12:30 | USD | Unit Labor Costs Q1 P | 2.60% | 4.40% |
| 14:30 | USD | Natural Gas Storage (May 1) | 72B | 79B |
| 23:50 | JPY |
| Monetary Base Y/Y Apr | |
| Consensus | -10.50% |
| Previous | -11.60% |
| 23:50 | JPY |
| BoJ Minutes | |
| Consensus | |
| Previous | |
| 01:30 | AUD |
| Trade Balance (AUD) Mar | |
| Consensus | 4.45B |
| Previous | 5.69B |
| 06:00 | EUR |
| Germany Factory Orders M/M Mar | |
| Consensus | 1.10% |
| Previous | 0.90% |
| 07:00 | CHF |
| Foreign Currency Reserves *CHF) Apr | |
| Consensus | |
| Previous | 721B |
| 08:00 | CHF |
| Unemployment Rate M/M Apr | |
| Consensus | 3.00% |
| Previous | 3.00% |
| 08:30 | GBP |
| Construction PMI Apr | |
| Consensus | 46.2 |
| Previous | 45.6 |
| 09:00 | EUR |
| Eurozone Retail Sales M/M Mar | |
| Consensus | -0.40% |
| Previous | -0.20% |
| 12:30 | USD |
| Initial Jobless Claims (May 1) | |
| Consensus | 199K |
| Previous | 189K |
| 12:30 | USD |
| Nonfarm Productivity Q1 P | |
| Consensus | 0.70% |
| Previous | 1.80% |
| 12:30 | USD |
| Unit Labor Costs Q1 P | |
| Consensus | 2.60% |
| Previous | 4.40% |
| 14:30 | USD |
| Natural Gas Storage (May 1) | |
| Consensus | 72B |
| Previous | 79B |
Friday, May 8, 2026
| GMT | Ccy | Events | Cons | Prev |
|---|---|---|---|---|
| 23:30 | JPY | Labor Cash Earnings Y/Y Mar | 3.20% | 3.30% |
| 00:30 | JPY | Services PMI Apr F | 51.2 | 51.2 |
| 06:00 | EUR | Germany Industrial Production M/M Mar | 0.40% | -0.30% |
| 06:00 | EUR | Germany Trade Balance (EUR) Mar | 18.9B | 19.8B |
| 12:30 | CAD | Net Change in Employment Apr | 5.1K | 14.1K |
| 12:30 | CAD | Unemployment Rate Apr | 6.70% | 6.70% |
| 12:30 | USD | Nonfarm Payrolls Apr | 60K | 178K |
| 12:30 | USD | Unemployment Rate Apr | 4.30% | 4.30% |
| 12:30 | USD | Average Hourly Earnings M/M Apr | 0.30% | 0.20% |
| 14:00 | USD | UoM Consumer Sentiment P | 49.7 | 49.8 |
| 14:00 | USD | UoM Inflation Expectations P | 4.70% |
| 23:30 | JPY |
| Labor Cash Earnings Y/Y Mar | |
| Consensus | 3.20% |
| Previous | 3.30% |
| 00:30 | JPY |
| Services PMI Apr F | |
| Consensus | 51.2 |
| Previous | 51.2 |
| 06:00 | EUR |
| Germany Industrial Production M/M Mar | |
| Consensus | 0.40% |
| Previous | -0.30% |
| 06:00 | EUR |
| Germany Trade Balance (EUR) Mar | |
| Consensus | 18.9B |
| Previous | 19.8B |
| 12:30 | CAD |
| Net Change in Employment Apr | |
| Consensus | 5.1K |
| Previous | 14.1K |
| 12:30 | CAD |
| Unemployment Rate Apr | |
| Consensus | 6.70% |
| Previous | 6.70% |
| 12:30 | USD |
| Nonfarm Payrolls Apr | |
| Consensus | 60K |
| Previous | 178K |
| 12:30 | USD |
| Unemployment Rate Apr | |
| Consensus | 4.30% |
| Previous | 4.30% |
| 12:30 | USD |
| Average Hourly Earnings M/M Apr | |
| Consensus | 0.30% |
| Previous | 0.20% |
| 14:00 | USD |
| UoM Consumer Sentiment P | |
| Consensus | 49.7 |
| Previous | 49.8 |
| 14:00 | USD |
| UoM Inflation Expectations P | |
| Consensus | |
| Previous | 4.70% |
Canada’s Jobs Market Expected to Chug Along Even as Labour Force Shrinks
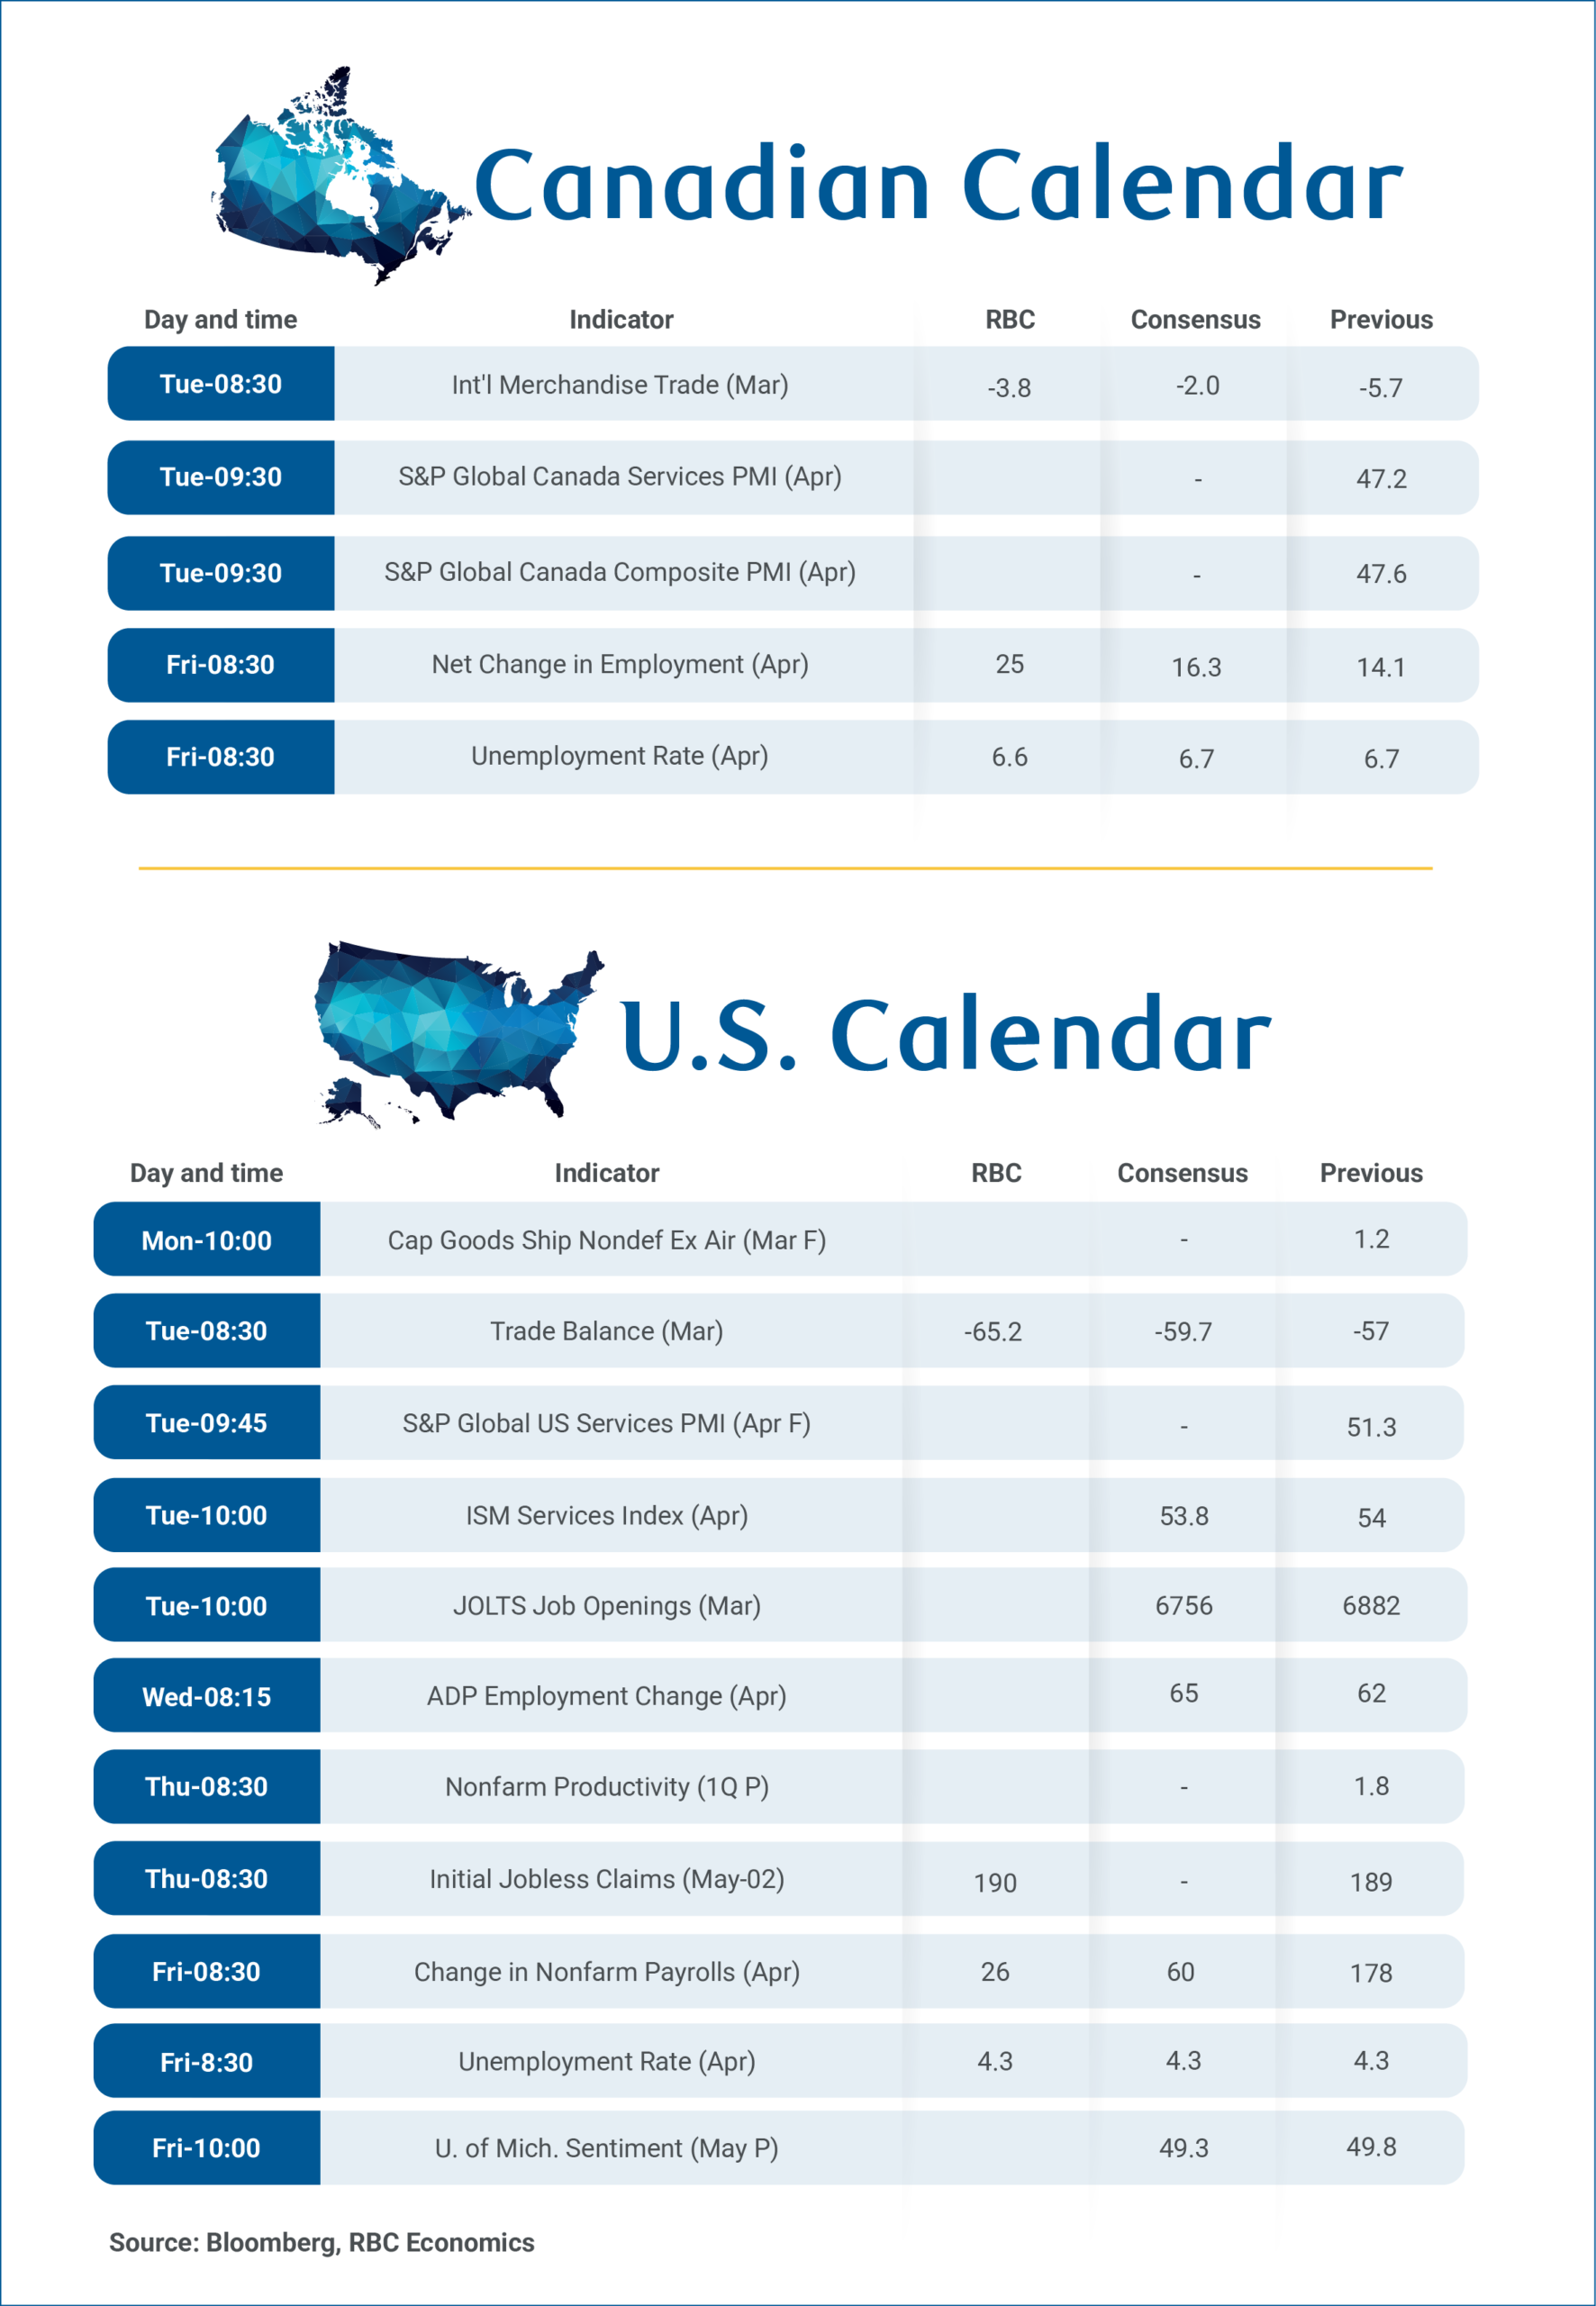
Canadian labour market data for April next Friday will be in focus, and we expect employment to remain broadly consistent with a gradual improvement in per-worker conditions after controlling for an unprecedented pullback in labour force growth.
We expect about 25,000 jobs were added in April following losses in January and February that only partially recovered in March.
That would still leave employment down 70,000 in the first four months of 2026, but would also likely still be enough to push the unemployment rate down to 6.6% from 6.7%—further below the recent 7.1% peak in August and September 2025.
We have discussed before how aggressive federal immigration caps and an aging population have sharply lowered the amount of employment growth needed to push the unemployment rate (the better indicator of per-worker labour conditions) lower.
Details of recent labour market reports have also not been as soft as headline employment growth numbers imply. Specifically:
- Weakness has been largely contained to trade-exposed sectors with little evidence of spreading. Employment in sectors heavily exposed to U.S. trade (with 35% or more jobs due to demand from the U.S.) have declined 3% since February 2024, while other sectors grew by 1%.
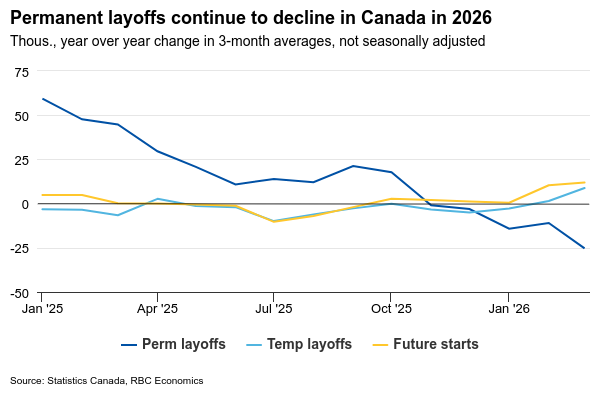
- Permanent layoffs have declined. Early 2026 job losses were not driven by permanent layoffs, which have fallen since October 2025. Instead, temporary layoffs and future starts (workers with a future job start date, but still technically unemployed) account for recent increases.
- No signs of “hidden” unemployment. The unemployment rate provides a “clean” read of per-worker conditions only if discouraged workers are not giving up their jobs or being pushed into part-time work when they would rather have full time jobs.
- Still, broader unemployment measures like R-8, which include such workers (discouraged and involuntary part-time workers) remain aligned with the official rate. Both measures have been relatively unchanged from a year ago, indicating weakness is not masked beneath the surface.
- Business sentiment is brightening. The Bank of Canada’s Business Outlook Survey, conducted in February, revealed strengthening hiring and investment intentions. Businesses reported plans focused on productivity gains and capacity expansion, reflecting a healthy rebound in household spending in 2025, and substantial improvement in trade uncertainties.
The labour market is not yet strong: Unemployment rate declines have still been modest to date, and we don’t expect a spike in wages in March will be repeated in April.
But, our base case projections assume further gradual improvements this year with the unemployment rate edging down to 6.3% by year end even with job growth softer than historically normal.
Canadian international trade data has been exceptionally volatile, but the merchandise trade deficit should narrow in March with a 40% surge in oil prices due to the Middle East conflict pushing the energy surplus higher. We look for exports to rise almost 5%, and imports to post a smaller 1.5% increase, pushing the trade deficit down to -$3.8 billion from -$5.7 billion in February.
We expect U.S. nonfarm payrolls added just 26,000 jobs in March—a number that, given current conditions, represents breakeven growth and has become routine. With shrinking labor supply, the U.S. does not need substantial job additions to maintain a steady unemployment rate. A meaningful decline in continuing claims between the March and April reference weeks supports our expectation that the unemployment rate will hold steady at 4.3% in March.
Weekly Focus – Steady Central Banks Weigh Their Options
Crude oil prices continued higher this week as the market is becoming increasingly sceptical about the prospect of a near-term opening of the Strait of Hormuz. This pushed yields higher until the peak was reached and oil prices dropped sharply again on Thursday. The oil crunch has also triggered some action in the FX market where Japanese authorities intervened to support the yen for the first time since July 2024. Looking ahead, the UAE's decision to leave OPEC creates a bearish outlook for oil prices, when oil starts to flow through the strait again.
The Fed kept rates on hold at Powell's last meeting as chair. The takeaway for markets was to the hawkish side as three participants dissented against the Fed's current easing bias and Powell decided to stay on as governor which blocks Trump from nominating a dovish replacement. This means the exit of Stephen Miran, when Kevin Warsh replaces Powell as Fed chair after the Senate Banking Committee finally advanced his nomination this week. Further, Powell specified that the majority of the FOMC did not want to send a signal that a hike would be equally likely as a cut.
Growth was slightly on the weak side of expectations in Q1, as US q/q GDP growth, fuelled by a reopening of the public sector, ended up at 0.5%, on steady but cooling private consumption. The euro area almost came to a standstill at 0.1% on the back of disappointing French growth and volatile Irish data.
The EU Commission's April surveys highlighted the dilemma the ECB is faced with, and which the PMIs also reflected last week. They showed inflation expectations have surged among businesses and consumers, but confidence is declining. Noticeably service sector employment expectations recorded the steepest decline since the early pandemic shutdowns. So far, actual inflation shows no signs of broader price pressures. Core inflation even edged lower to 2.2% in April as service inflation declined to 3% for the first time in four years. Headline inflation on the other hand increased to 3%, digging into consumers' purchasing power. ECB president Lagarde is "certainly not seeing second-round effects" as she put it after the decision to keep rates on hold. A rate hike was debated but the decision was unanimous.
The Bank of England also held rates steady with an "active hold" decision, as Governor Bailey phrased it and did not push back on the hawkish market pricing as tighter financial conditions push the breaks on economic activity. Japan has for long been on a very slow-moving hiking cycle. The uncertain implications for the big energy importer caused the Bank of Japan to postpone further tightening for now. We expect them to hike their policy rate to 1% for the first time since 1995 in June. Elsewhere in Asia, Chinese exports remain the key growth engine highlighted by solid April manufacturing PMIs above 50 from both official and private measures. The non-manufacturing PMI on the other hand fell below 50 and the construction sector slowdown accelerated further, leaving the economy vulnerable to a global downturn.
Next week a whole string of labour market reports is published in the US, concluding with the jobs report on Friday, where we expect a solid 80K new jobs. We expect unemployment, which is more important for the Fed, to be unchanged at 4.3%.
Ethereum (ETH) on Path to a Continued Breakout – Will It Pull Other Altcoins?
Ethereum has slowly broken out of its October downtrend that had led to its progressive, but brutal 64% correction.
Global disinterest for high-beta, AI and Tech assets had shun interest for Cryptocurrencies but with the Conflict turning the script on Energy prices, hence normal consumption, traders slowly turned away from traditional assets.
The idea is that Digital Assets are fairly isolated from any rise on Crude Oil or Nat Gas, quite the contrary. Crypto mining is energy intensive; hence, with higher costs, mining gets less interest, so that provides a temporary supply restriction which has a boosting effect on Cryptos.
Since the beginning of the conflict, Bitcoin and Ethereum are up 20%, while the Total Market Cap is up just a bit less (~18%) – While there is still a lot to cover to return to all-time highs, this is strong progress; Bulls will want to keep pushing and they might just turn the trend around.
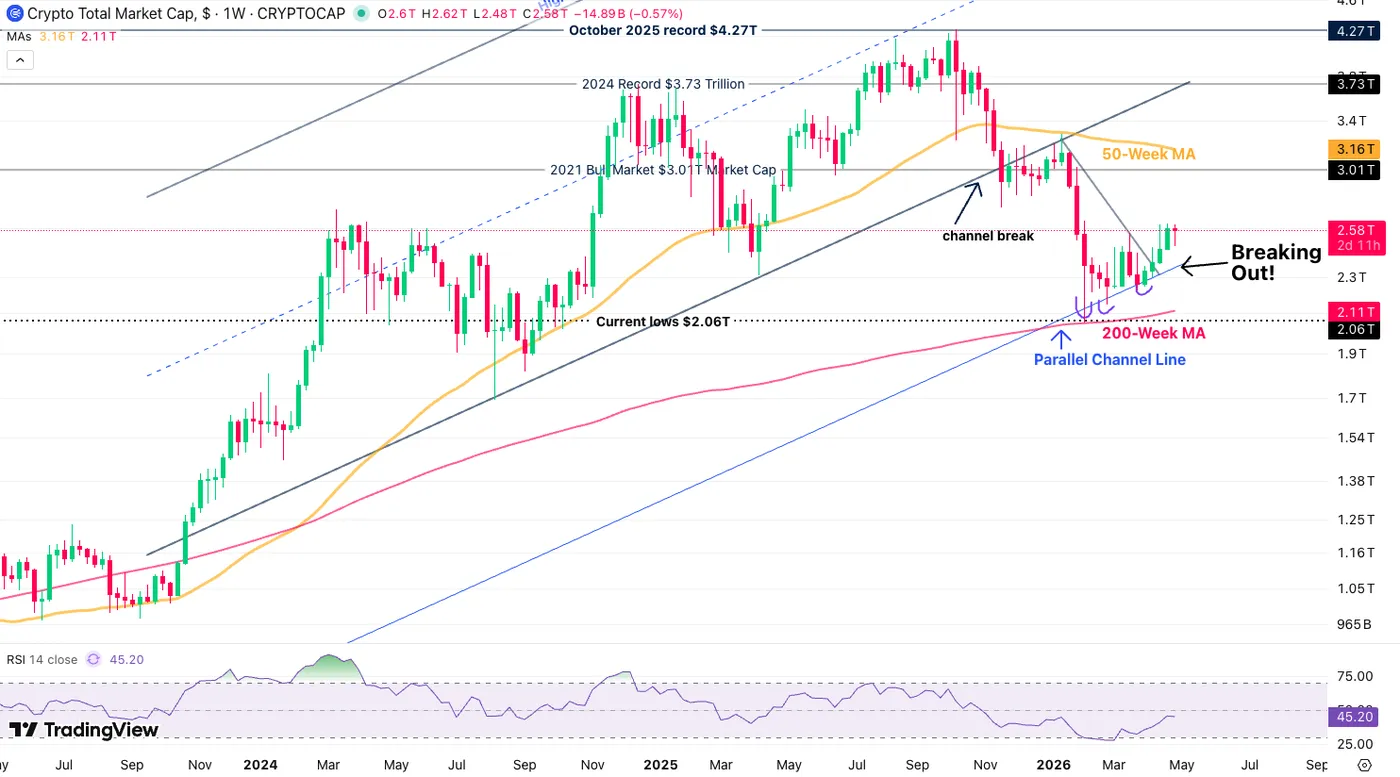
Crypto Total Market Cap – Source: TradingView. May 1, 2026
ETH/BTC – Bull flag formation?
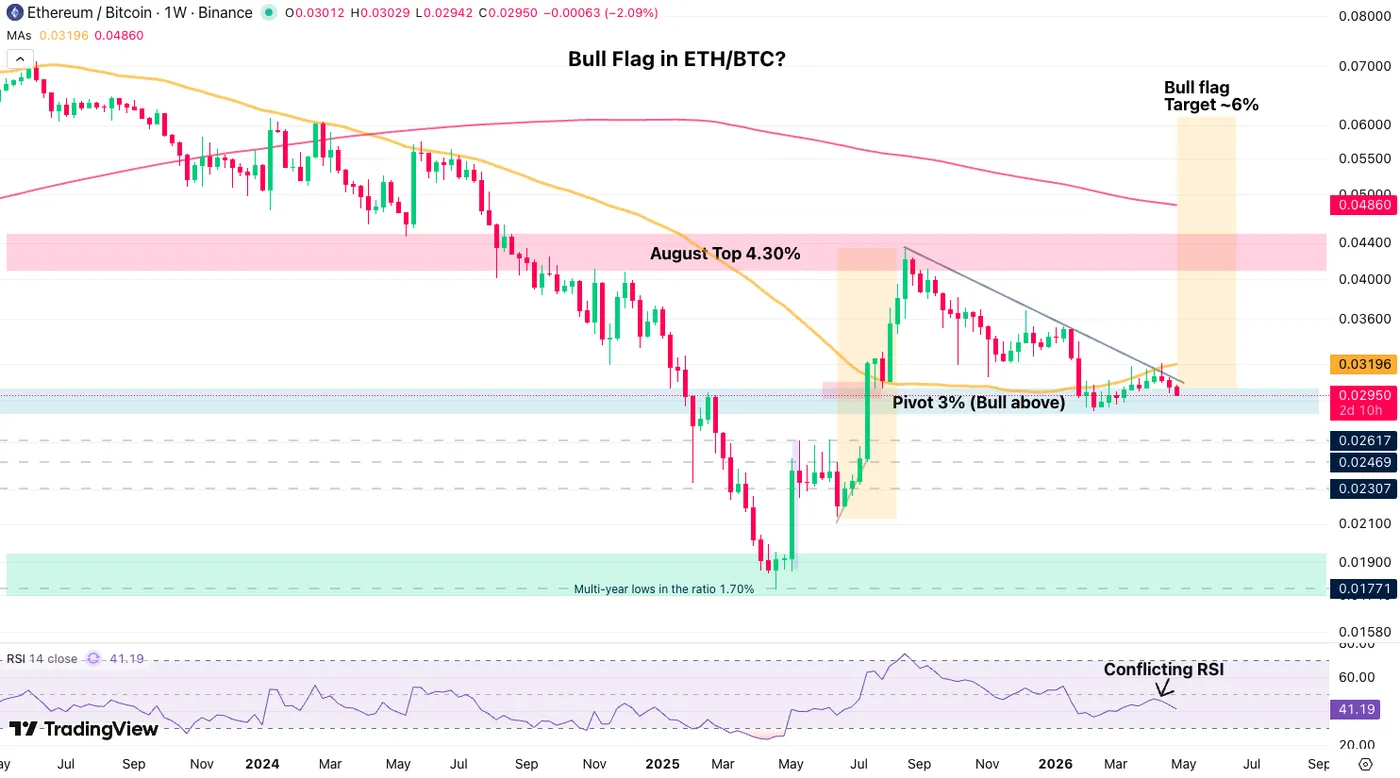
ETH/BTC – Source: TradingView. May 1, 2026
The Second to First Crypto ratio is essential to track the appetite for Altcoins, key to depth in the Digital Asset Market as Bitcoin had taken a significant advantage since it started rallying to its first $100,000 trip – The initial drop in ETH in August 2025 marked a top in the ratio
Today, ETH/BTC is hanging right around the 3% level, which itself does not imply much about the state of the Crypto Market, however, a bull flag formation could bring some happy days for Alternative Coins.
Its target is at 6% of the Bitcoin price, hence that would signify a significant rally in Ethereum which tends to trigger altcoin rallies (except if Bitcoin slashes its value, but in the past, that often reduced the ratio in a flight to Crypto Safety).
Ethereum Technical Analysis
ETH Daily Timeframe
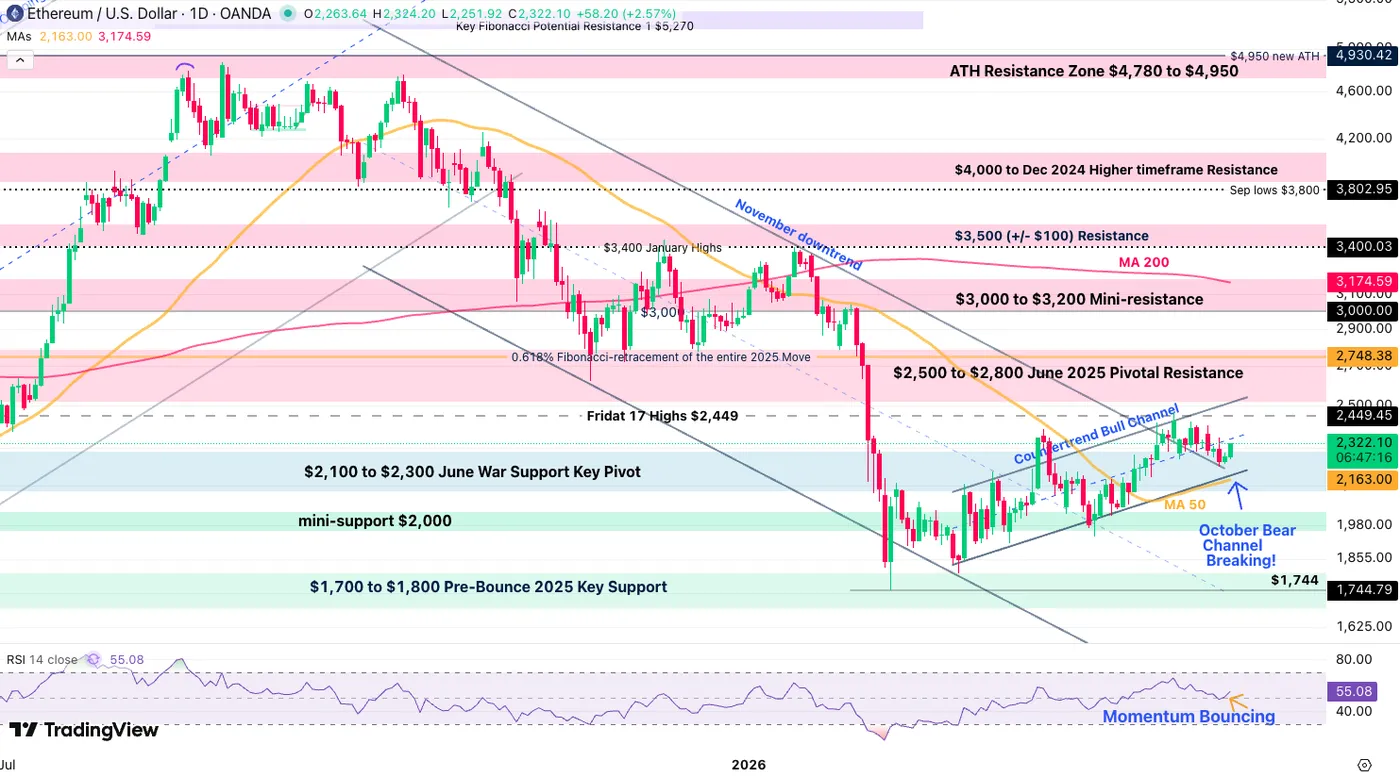
Ethereum Daily Chart, May 1, 2026 – Source: TradingView
Ethereum has now officially consolidated above its key $2,100 to $2,300 Pivot Zone and pushed above its downward Channel.
While momentum is still timid, a bounce from Neutral RSI, confirming with a nascent bull channel brings back higher odds to retest the $2,500 level (not seen since January).
ETH 4H Timeframe and Technical Levels
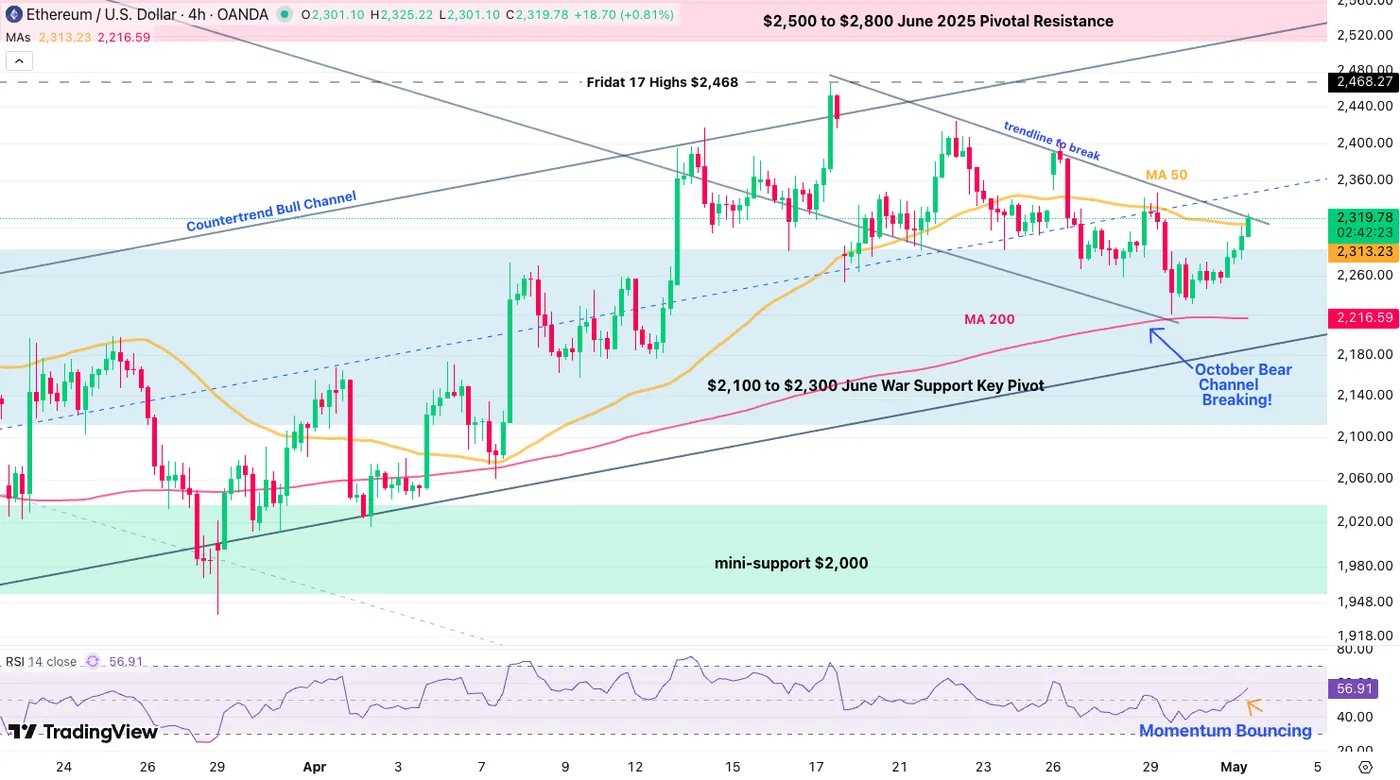
Ethereum 4H Chart, May 1, 2026 – Source: TradingView
Ethereum is forming an intraday tight bull channel after finding its bottom at the FOMC, right around the 4H 200-period MA.
Currently testing a break of a short-term top-line, bulls are already pushing above the 50-period MA and that provides the needed signs for continued upside.
To confirm, look for an hourly close above $2,330 which would hint to a rally to the top of the counter-trend bull channel ($2,520).
Levels of interest for ETH trading:
Support Levels:
- $2,100 to $2,300 June War Support Key Pivot
- $2,215 4H 200-period MA
- Channel lows $2,000
- $1,700 to $1,800 Pre-Bounce 2025 Key Support (testing)
- $1,744 February 6 lows
Resistance Levels:
- Trendline top $2,330
- $2,400 mini-resistance
- $2,500 to $2,700 June 2025 Key Support now Resistance (Channel Highs)
- $3,000 to $3,200 Major momentum Pivot (Test of the $3,000)
- $4,950 Current new All-time highs
Ethereum 1H Chart
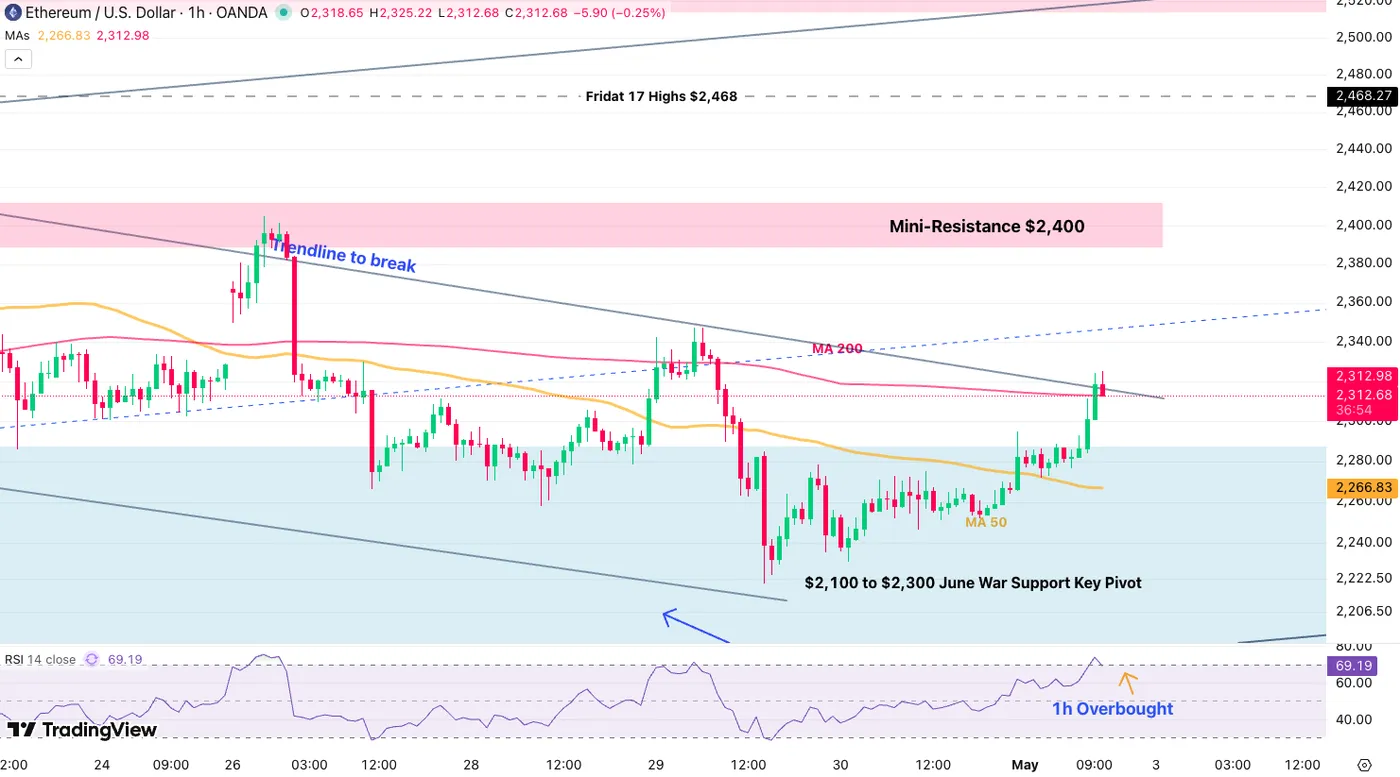
Ethereum 1H Chart, May 1, 2026 – Source: TradingView
The shorter timeframe points to momentum slightly exhausting with a short-term double top and overbought RSI, but with this price action, the pull back should not extend much beyond $2,300.
Breaking the 50-Hour MA ($2,266) cancels out the bull attempt in would imply further consolidation in times ahead.
Safe Trades!
US ISM Manufacturing Holds at 52.7 as Price Pressures Surge and Employment Weakens
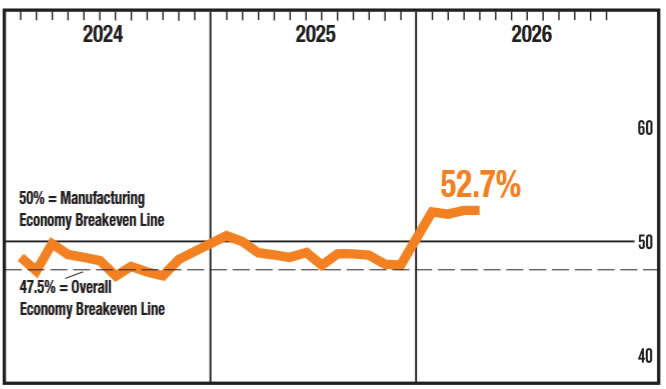
US ISM Manufacturing PMI held steady at 52.7 in April, signaling continued expansion in the sector and broadly aligning with a moderate growth outlook. Based on historical relationships, the reading corresponds to around 1.8% annualized GDP growth, suggesting that manufacturing is still contributing positively to overall economic activity.
Beneath the headline, the details were mixed. New orders improved from 53.5 to 54.1, indicating firm demand conditions, while production eased from 55.1 to 53.4, pointing to some moderation in output momentum. The labor market remains a weak spot, with the employment index falling further from 48.7 to 46.4, highlighting ongoing softness in hiring within the sector.
The most notable development was the sharp rise in price pressures. The Prices Index surged from 78.3 to 84.6, extending a three-month increase of 25.6 points and reaching its highest level since April 2022. This reflects intensifying cost pressures, driven in part by supply disruptions and higher energy prices linked to the ongoing Middle East conflict.
Sentiment among manufacturers remains cautious. During the second month of the Iran War, 69% of comments were negative compared to 31% positive, with nearly half referencing the conflict and others highlighting tariffs.
| Indicator | March | April | Change |
|---|---|---|---|
| PMI | 52.7 | 52.7 | — |
| New Orders | 53.5 | 54.1 | ↑ +0.6 |
| Production | 55.1 | 53.4 | ↓ -1.7 |
| Employment | 48.7 | 46.4 | ↓ -2.3 |
| Prices | 78.3 | 84.6 | ↑ +6.3 |
GBP/USD Mid-Day Outlook
Daily Pivots: (S1) 1.3502; (P) 1.3557; (R1) 1.3660; More...
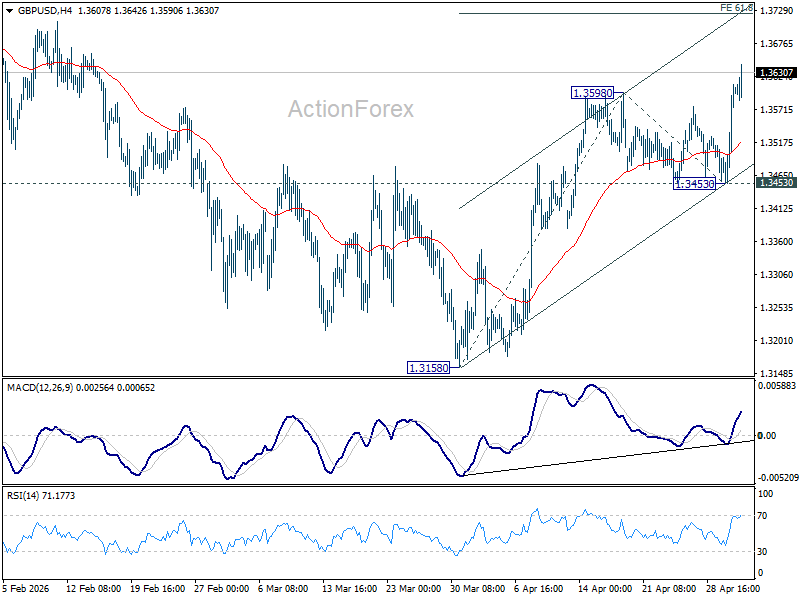
Intraday bias in GBP/USD remains on the upside for the moment. Rise from 1.3158 is in progress for 61.8% projection of 1.3158 to 1.3598 from 1.3453 at 1.3725 first. Firm break there will target a retest on 1.3867 high. For now, risk will stay on the upside as long as 1.3453 support holds, in case of retreat.
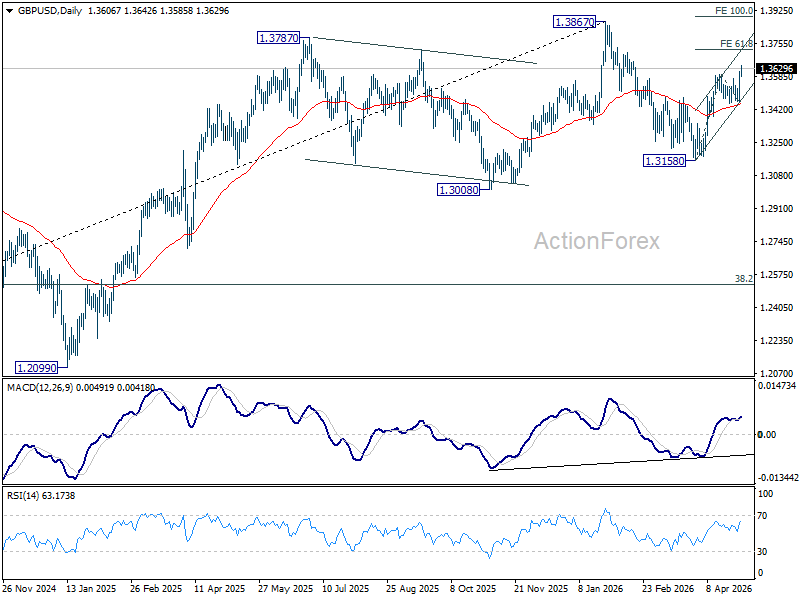
In the bigger picture, current development suggests that price actions from 1.3867 are merely a corrective pattern within the broader up trend from 1.0351 (2022 low). With 1.3008 support intact, medium term bullishness is maintained and break of 1.3867 is back in favor for a later stage, towards 1.4248 key resistance (2021 high).
EUR/USD Mid-Day Outlook
Daily Pivots: (S1) 1.1677; (P) 1.1709; (R1) 1.1764; More….
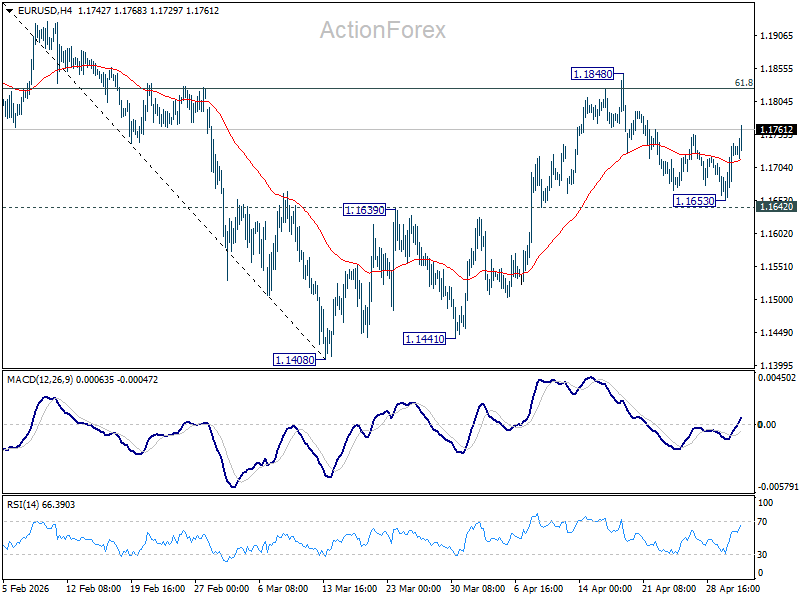
Intraday bias in EUR/USD stays neutral, and further rise is in favor with 1.1642 support intact. On the upside, sustained trading above 61.8% retracement of 1.2081 to 1.1408 at 1.1824 will pave the way to retest 1.2081 high. However, firm break of 1.1642 support will indicate the the rebound from 1.1408 has completed, and bring deeper decline back towards this low instead.
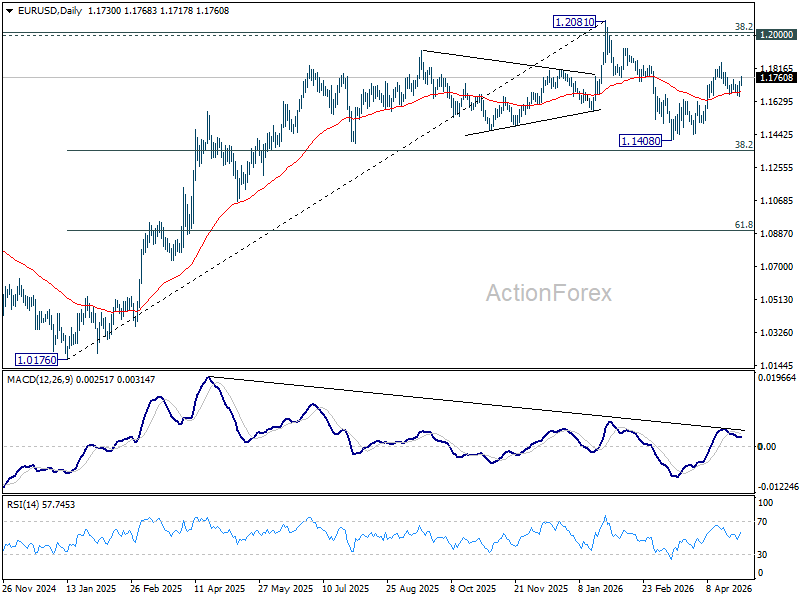
In the bigger picture, the strong support from 38.2% retracement of 1.0176 to 1.2081 at 1.1353 suggests that the pullback from 1.2081 is more likely a corrective move. Strong support was also found in 55 W EMA (now at 1.1530). Focus is back on 1.2 key cluster resistance level. Decisive break there will carry long term bullish implications. Nevertheless, break of 1.1408 support will revive the case of medium term bearish trend reversal.
USD/JPY Mid-Day Outlook
Daily Pivots: (S1) 154.55; (P) 157.63; (R1) 159.71; More...
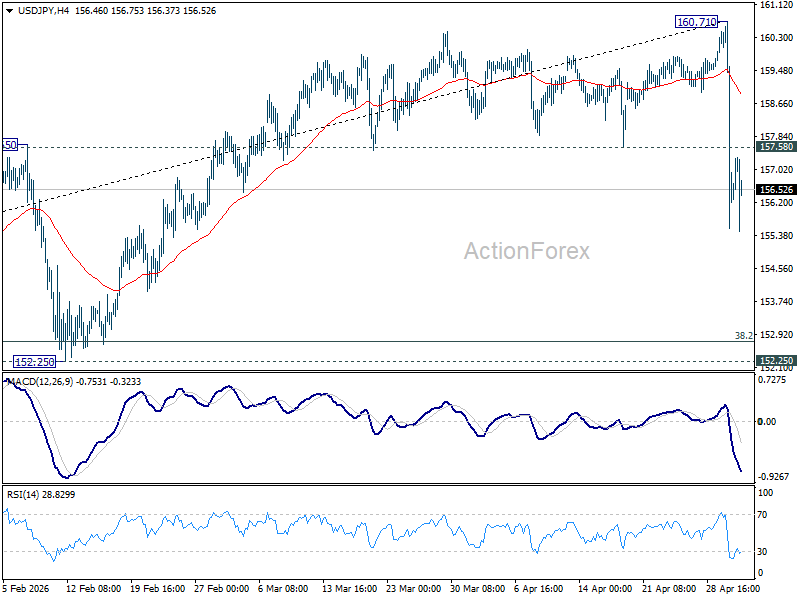
Intraday bias in USD/JPY remains on the downside, and fall from 160.71 would extend lower towards 152.25 cluster support (38.2% retracement of 139.87 to 160.71 at 152.74). Strong support should emerge there to bring rebound, at least on first attempt. On the upside, above 157.58 support turned resistance will turn intraday bias neutral first.
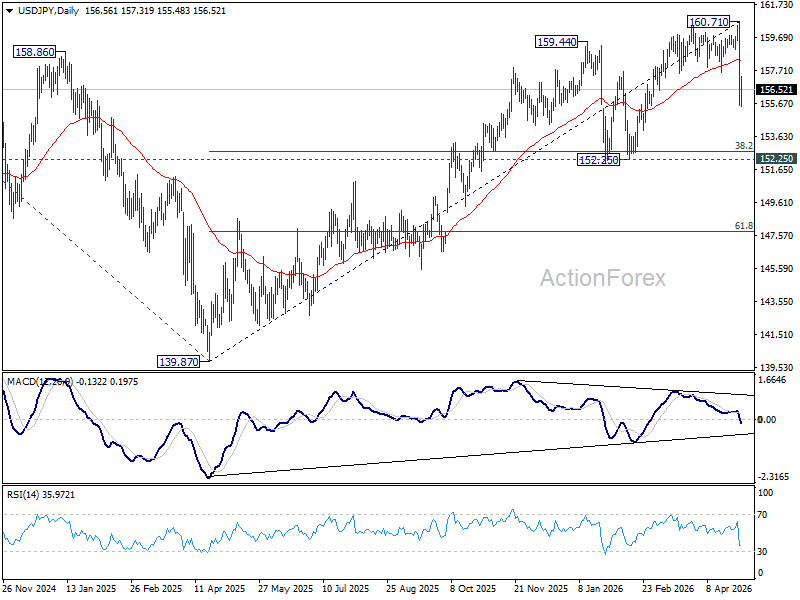
In the bigger picture, for now, corrective pattern from 161.94 (2024 high) is still seen as completed at 139.87. Rise from there is seen as resuming the long term up trend. So, break of 161.94 is expected at a later stage to resume the long term up trend. However, sustained break of 55 W EMA (now at 153.90) will dampen this view and bring deeper fall back towards 139.87 to extend the pattern from 161.94.
USD/CHF Mid-Day Outlook
Daily Pivots: (S1) 0.7773; (P) 0.7848; (R1) 0.7891; More….
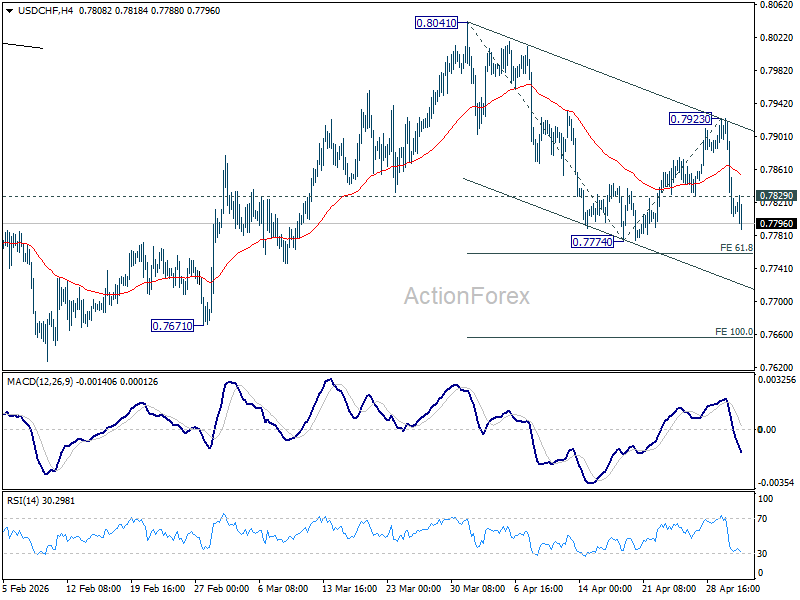
Intraday bias in USD/CHF remains on the downside for 0.7774 and then 61.8% projection of 0.8041 to 0.7774 from 0.7923 at 0.7758. Firm break there will target 100% projection at 0.7656. On the upside, above 0.7829 minor resistance will turn intraday bias neutral first. But risk will stay on the downside as long as 0.7923 resistance holds, in case of recovery.
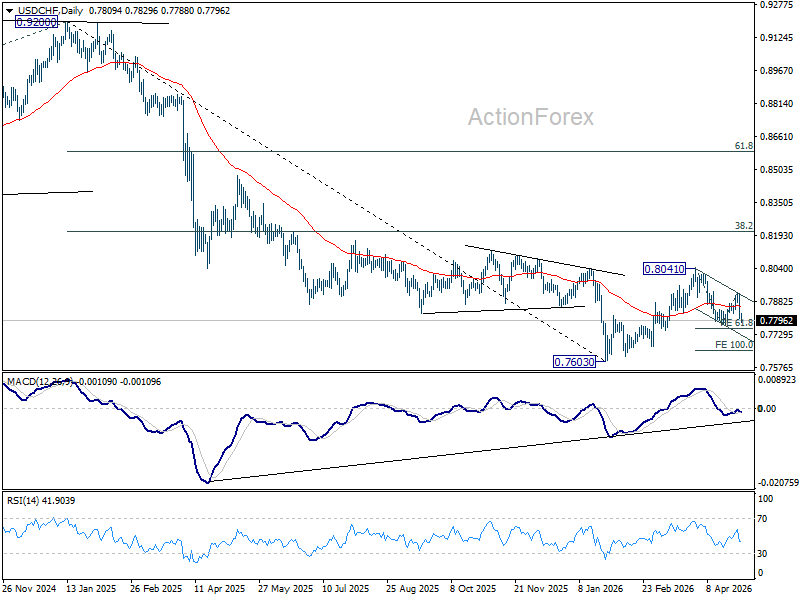
In the bigger picture, rebound from 0.7603 medium term bottom is seen as correcting the fall from 0.9200 only. Rejection by 55 W EMA (now at 0.8053) will affirm this bearish case, and setup down trend resumption to 100% projection of 1.0146 (2022 high) to 0.8332 from 0.9200 at 0.7382 at a later stage. Though, sustained break of 55 W EMA will suggest that it's probably correcting the larger scale down trend from 1.0146 (2022 high).
Dollar Stays on the Back Foot as Markets Embrace Risk and Look Past Geopolitics
Dollar remains firmly on the defensive as markets head into the US session, with selling pressure picking up once again. Despite a busy geopolitical backdrop, the greenback is being weighed down by a strong risk-on environment that continues to dominate market thinking.
April delivered a powerful signal for equities. US stock markets closed the month on a strong note, with even the underperforming DOW registering its best performance since November 2024. A robust earnings season has reinforced the narrative that corporate profits remain resilient, helping to sustain the rally into May.
Crucially, investors are showing a growing willingness to ignore geopolitical risks. The ongoing tensions surrounding the Iran conflict have done little to dent sentiment, as markets focus instead on growth prospects and the durability of the tech-driven expansion story.
The political backdrop remains complex, however. US President Donald Trump is facing a key 60-day deadline under the War Powers Resolution related to the Iran conflict. While the timeline technically expires today, the administration has argued that a ceasefire reached in early April effectively ended hostilities, removing the need for further Congressional approval.
Officials have emphasized that the lack of direct military engagement since April 7 means the legal framework no longer applies. While this interpretation leaves room for prolonged tension, markets are treating it as a sign that escalation risks are contained for now.
Oil markets reflect that view. Brent crude, while still elevated, has retreated toward $115, suggesting that traders are not positioning for a near-term escalation. The easing in oil prices has also reduced one of the key pillars of recent Dollar strength, contributing to the currency’s ongoing weakness.
In FX markets, the divergence is clear. Yen remains the standout performer, supported by intervention dynamics and a sharp reversal in positioning. Loonie is holding firm on oil support, while Aussie benefits from improving risk sentiment.
Dollar, by contrast, is lagging across the board, with Euro and Kiwi also underperforming. Sterling and Swiss Franc are sitting in the middle of the pack, reflecting a more mixed set of influences.
UK Manufacturing PMI Finalized at Near Four-Year High, but Cost Pressures Surge
UK manufacturing is rebounding—but rising costs are a warning sign. Supply disruptions are pushing inflation pressures higher. Read More
Tokyo Inflation Cools to Multi-Year Low, but Energy Risks Point to Rebound Ahead
Tokyo inflation is cooling—but not for long. Subsidies are masking price pressures as energy costs threaten a rebound. Read More.
Japan Manufacturing PMI Jumps to 55.1, but Supply Strains Raise Sustainability Concerns
Japan’s factory sector is booming—but cracks are forming. Supply delays and rising costs could quickly reverse the gains. Read More.
USD/CHF Mid-Day Outlook
Daily Pivots: (S1) 0.7773; (P) 0.7848; (R1) 0.7891; More….
Intraday bias in USD/CHF remains on the downside for 0.7774 and then 61.8% projection of 0.8041 to 0.7774 from 0.7923 at 0.7758. Firm break there will target 100% projection at 0.7656. On the upside, above 0.7829 minor resistance will turn intraday bias neutral first. But risk will stay on the downside as long as 0.7923 resistance holds, in case of recovery.
In the bigger picture, rebound from 0.7603 medium term bottom is seen as correcting the fall from 0.9200 only. Rejection by 55 W EMA (now at 0.8053) will affirm this bearish case, and setup down trend resumption to 100% projection of 1.0146 (2022 high) to 0.8332 from 0.9200 at 0.7382 at a later stage. Though, sustained break of 55 W EMA will suggest that it's probably correcting the larger scale down trend from 1.0146 (2022 high).