

Sample Category Title
Chart alert: Silver (XAG/USD) rout extends below $75.90 key intraday resistance, bearish trend intact
Key takeaways
- Silver underperforms despite geopolitical risk: Silver (XAG/USD) has lagged major assets, falling sharply since the US–Iran conflict and failing to attract safe-haven demand, with momentum—not fundamentals—driving price action.
- Bearish trend remains intact technically: A breakdown below the 20-day moving average and rejection at the 50-day MA signal the end of the prior rebound, reinforcing a broader corrective downtrend from January highs.
- Downside risks dominate below key resistance: Holding below $75.90 keeps the bearish bias intact, with potential further declines toward $69.64 and $67.70, while only a sustained break above resistance would negate the negative outlook.
Precious metals, gold and silver, have failed to ignite a similar risk-on rally in terms of magnitude and duration as seen on the benchmark US stock indices and other major stock indices after the “fragile” ceasefire agreement between the US and Iran that has been in place on 8 April 2026.
Silver flipped to become an underperforming asset class
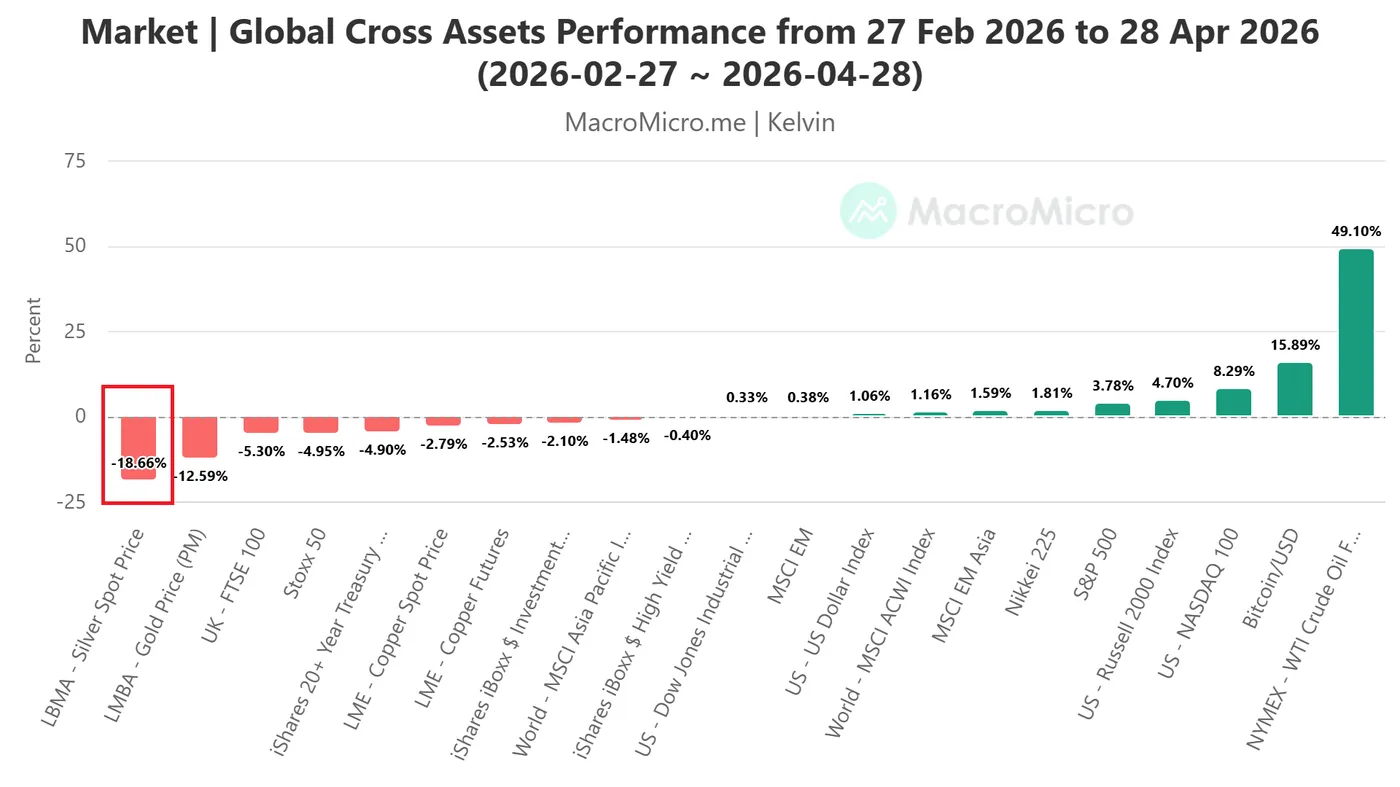
Fig. 1: Silver & other major cross assets performances from 27 Feb 2026 to 28 Apr 2026 (Source: MacroMicro).
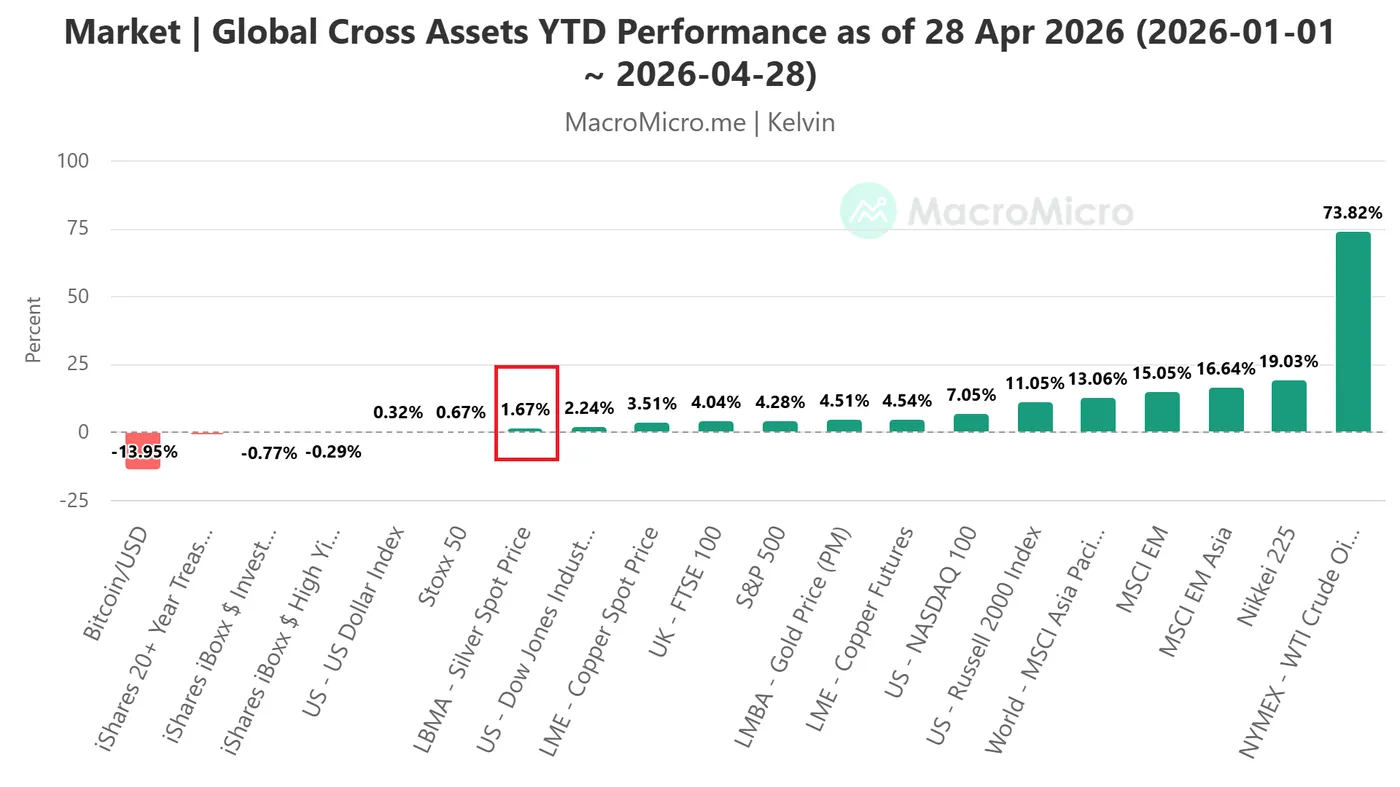
Fig. 2: Silver & other major cross assets year-to-date performances as of 28 Apr 2026 (Source: MacroMicro).
The US-Iran war started on 28 February 2026. Using the pre-war baseline of 27 February 2026 to Tuesday, 28 April 2026, spot silver (LBMA) was the worst performer among other key cross assets, with a loss of 19% (see Fig. 1).
On a year-to-date performance basis as of 28 April 2026, spot silver’s gain has been reduced miserably to 1.7% (see Fig. 2).
Despite the geopolitical gridlock between the US and Iran, and any miscalculation from either side is likely to trigger a rise in geopolitical risk premiums, we are not seeing any safe-haven demand push towards precious metals at this juncture.
Hence, it is the momentum factor that is driving the direction of silver at this juncture and overrides fundamental elements.
Let’s now focus on the technical factors to determine silver (XAG/USD)’s potential short-term trajectory (1 to 3 days).
Silver (XAG/USD) – End of corrective rebound from 23 March 2026 low
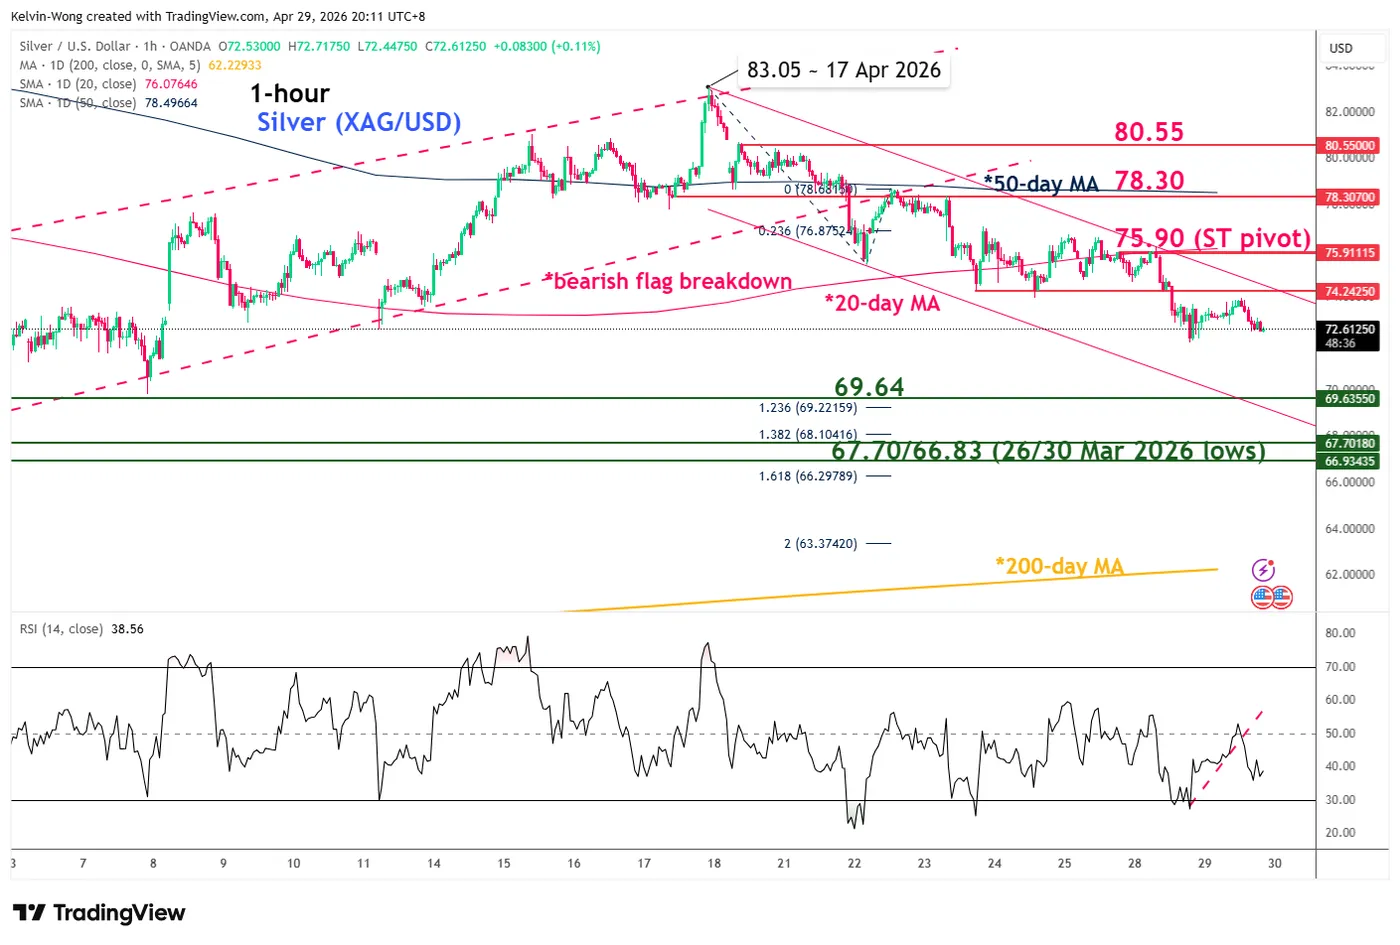
Fig. 3: Silver (XAG/USD) minor trend as of 29 Apr 2026 (Source: TradingView).
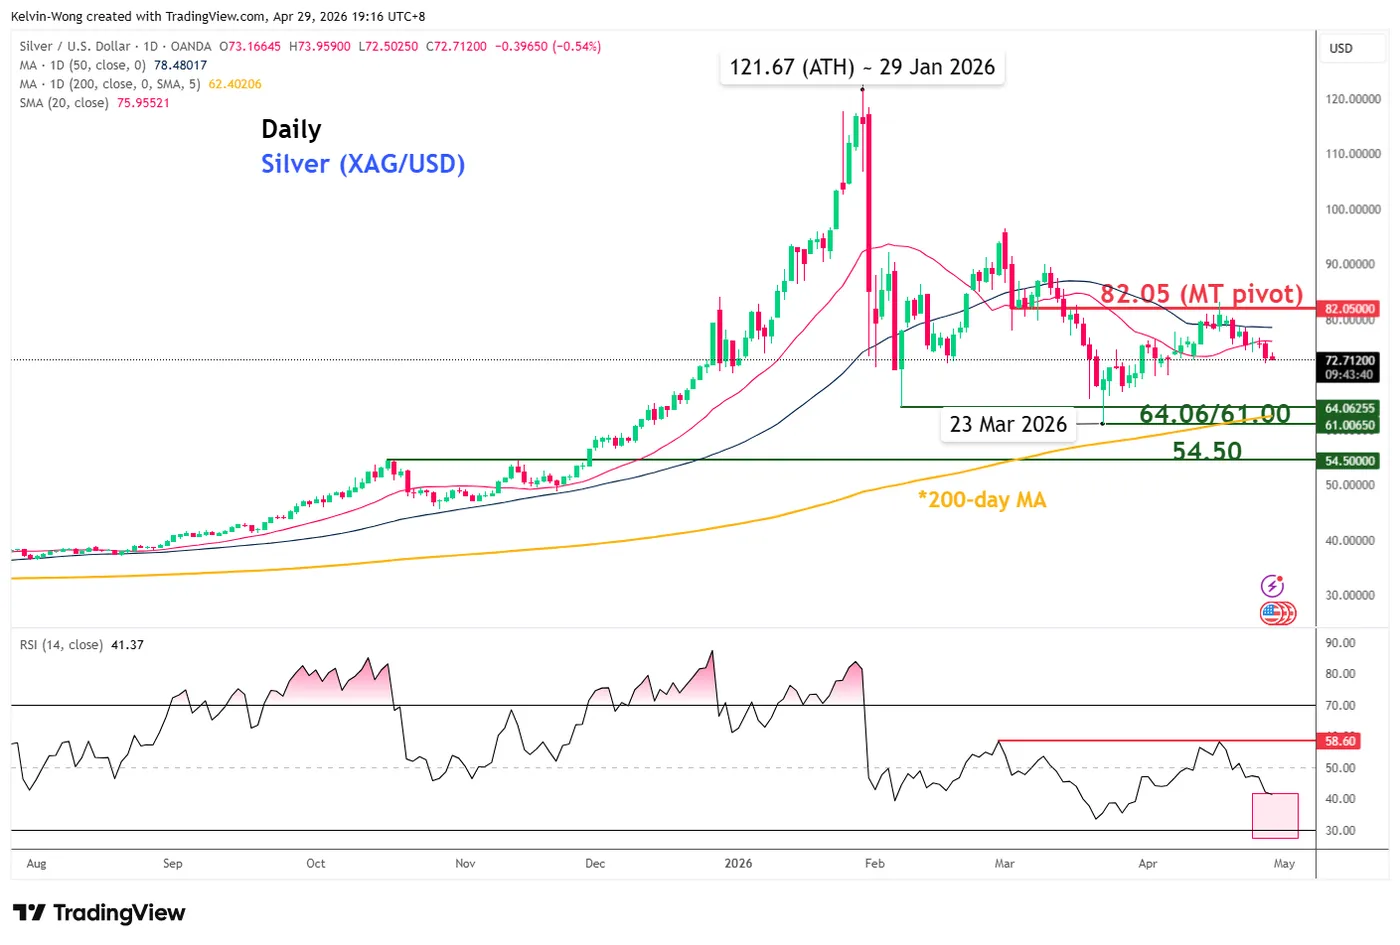
Fig. 4: Silver (XAG/USD) medium-term trend as of 29 Apr 2026 (Source: TradingView).
The price actions of silver (XAG/USD) have staged a bearish breakdown below its 20-day moving average on Tuesday, 28 April 2026, coupled with an earlier rejection around its 50-day moving average on 16 April 2026, suggesting that the 36% corrective rebound from the 29 April 2026 low has been damaged (see Fig. 4).
Start of another minor bearish impulsive down move sequence with a multi-month medium-term corrective decline structure that is still intact since its current all-time high of $121.67 printed on 29 January 2026
Watch 75.90 key short-term pivotal resistance on silver (XAG/USD) for another potential down leg to expose the next intermediate supports at 69.64 and 67.70/66.83 (also a Fibonacci extension) in the first step (see Fig. 3).
On the other hand, a clearance and an hourly close above 75.90 invalidates the bearish scenario for a sequence up to retest the next intermediate resistance at 78.30 (also the 50-day moving average).
Key elements to support the near-term bearish bias on silver (XAG/USD)
- Since its “bearish flag” and 20-day moving average breakdown, the price actions of silver (XAG/USD) have been oscillating within a minor descending channel.
- Price actions have not reached the lower boundary of the minor descending channel which confluences at around the 67.70/66.83 support zone.
- The daily RSI momentum indicator has continued to flash out a bearish momentum condition and has not reached its oversold region (below the 30 level).
Oil Continues to Face a Blockade
- The US has no intention of reopening the Strait of Hormuz and is demanding that Iran sign an agreement.
- The narrowing of the spread between the spot and futures markets is a positive sign, but it is not enough.
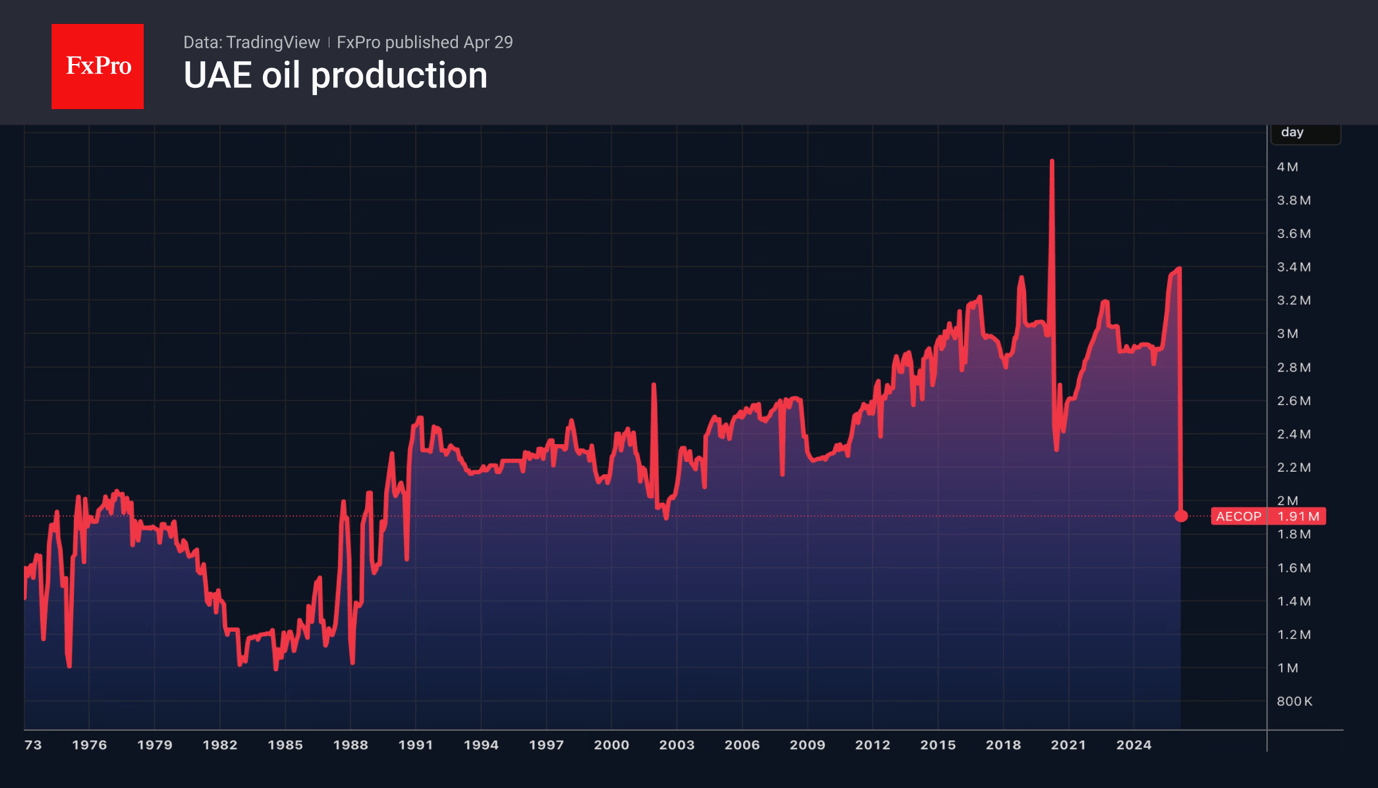
The UAE’s decision to withdraw from OPEC and OPEC+ came as a surprise but did not send shockwaves through the oil market. This move could undermine the cartel’s position and increase the UAE’s production capacity from its current quota of 3.4 million bpd to a technically feasible 4.8 million bpd. However, we did not see an immediate market reaction in the form of a decline in Brent and WTI prices, despite the Strait of Hormuz blockade, which has reduced production to just 1.8 million bpd.
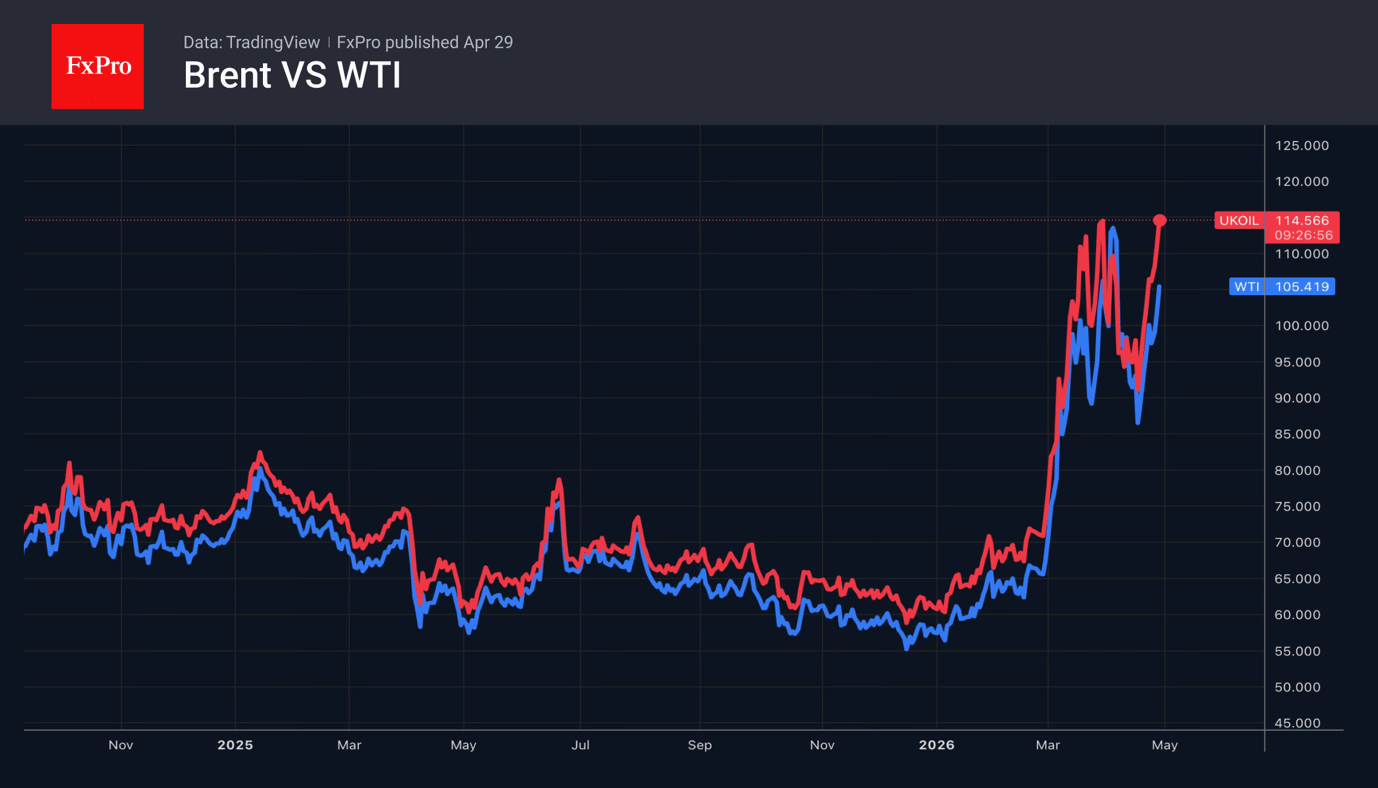
North Sea crude has been rising for 7 of the last 8 days, as Donald Trump threatens to prolong the blockade of the key oil artery indefinitely and appeals to Iran’s reason. Tehran must abandon its plans to develop nuclear weapons and sign the deal. Any resistance will keep the Strait of Hormuz closed. Ongoing supply disruptions and fears that the situation will worsen are driving Brent and WTI prices ever higher.
US politicians are doing everything they can to mitigate the negative impact. Trump intends to meet with American oil producers, is temporarily lifting sanctions on Russia, and welcomes the UAE’s intention to leave OPEC. Abu Dhabi is beginning to offer its customers barrels from Fujairah, outside the Persian Gulf. The United Arab Emirates accounted for around 13% of the cartel’s production capacity. The breakdown in relations will damage the organisation’s ability to manage the black gold market and risks increasing the number of defectors dissatisfied with Saudi Arabia’s actions.
It should be noted that the premium between spot oil and futures is narrowing. They reached $30 per barrel in early April; however, this is due in no small part to the rise in futures prices as the expected timeline for the normalisation of supplies has been pushed back. Spot prices are also under pressure from reduced demand from oil refineries, their drawdown of previously held reserves, and large-scale sales of commercial stocks by China’s Sinopec and PetroChina.
There is some good news, but the situation on the oil market remains tense. The World Bank notes that, due to supply disruptions, commodity prices are set to soar to their highest levels in four years. The organisation has raised its forecast for the average Brent price in 2026 from $60 per barrel in January to $86.
EUR/USD Mid-Day Outlook
Daily Pivots: (S1) 1.1684; (P) 1.1706; (R1) 1.1735; More….
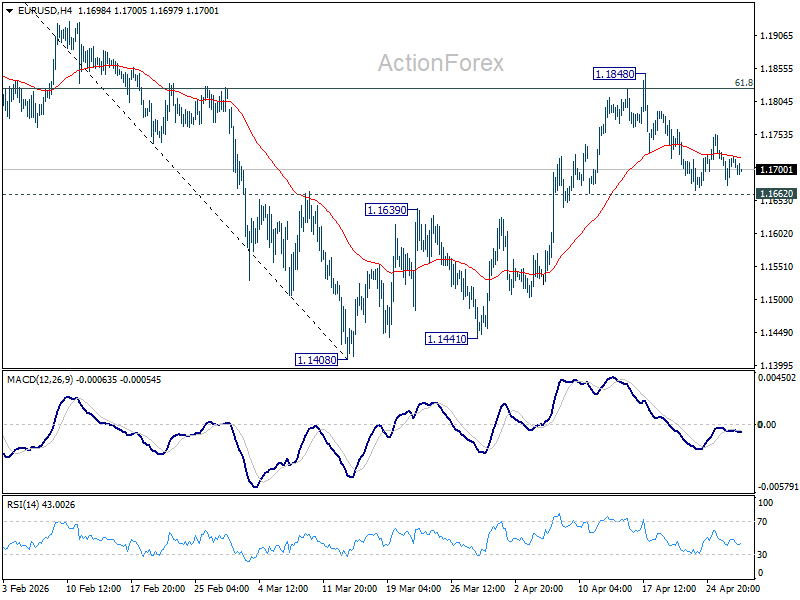
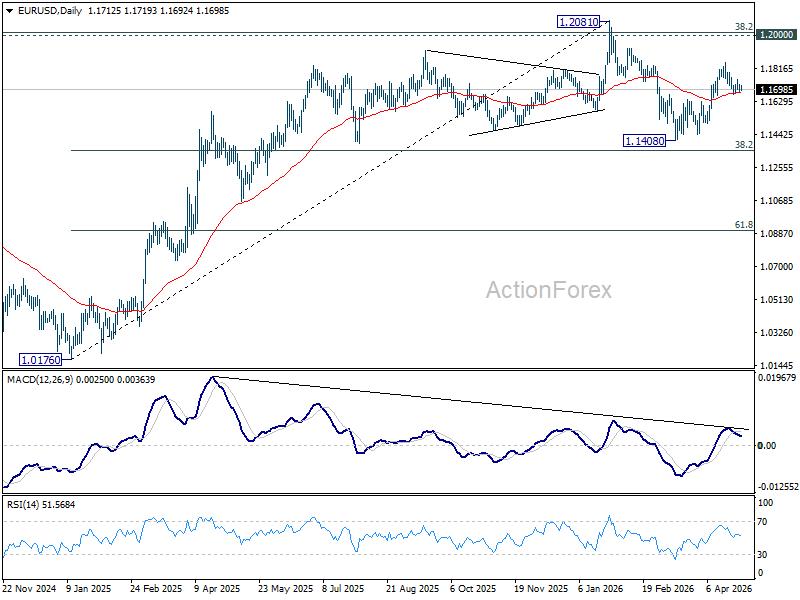
Range trading continues in EUR/USD and intraday bias stays neutral. Further rally is expected with 1.1662 support intact. On the upside, sustained trading above 61.8% retracement of 1.2081 to 1.1408 at 1.1824 will pave the way to retest 1.2081 high. However, firm break of 1.1662 support will indicate the the rebound from 1.1408 has completed, and bring deeper decline back towards this low instead.
In the bigger picture, the strong support from 38.2% retracement of 1.0176 to 1.2081 at 1.1353 suggests that the pullback from 1.2081 is more likely a corrective move. Strong support was also found in 55 W EMA (now at 1.1530). Focus is back on 1.2 key cluster resistance level. Decisive break there will carry long term bullish implications. Nevertheless, break of 1.1408 support will revive the case of medium term bearish trend reversal.
GBP/USD Mid-Day Outlook
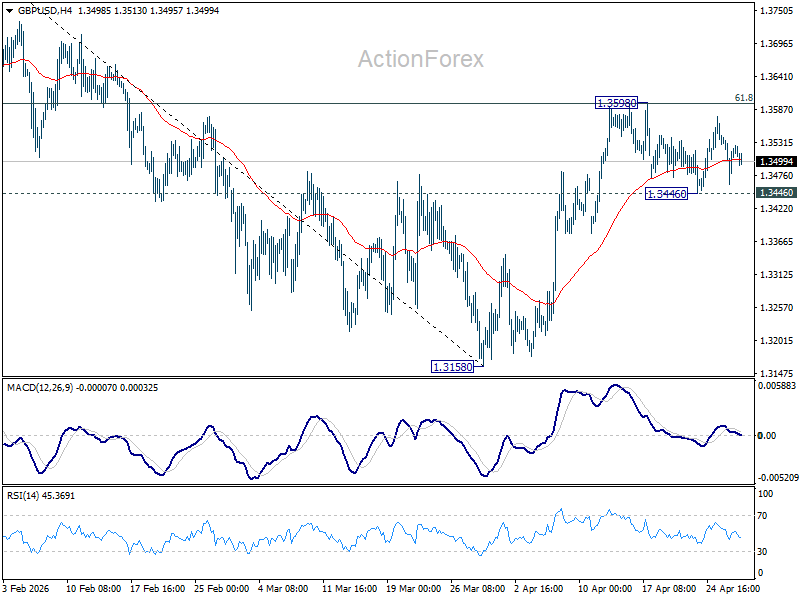
Daily Pivots: (S1) 1.3472; (P) 1.3509; (R1) 1.3556; More...
Intraday bias in GBP/USD remains neutral as range trading continues. Further rise is still in favor with 1.3446 support intact. On the upside, firm break of 61.8% retracement of 1.3867 to 1.3158 at 1.3596 will pave the way to retest 1.3867 high. However, break of 1.3446 will turn bias back to the downside for deeper pullback.
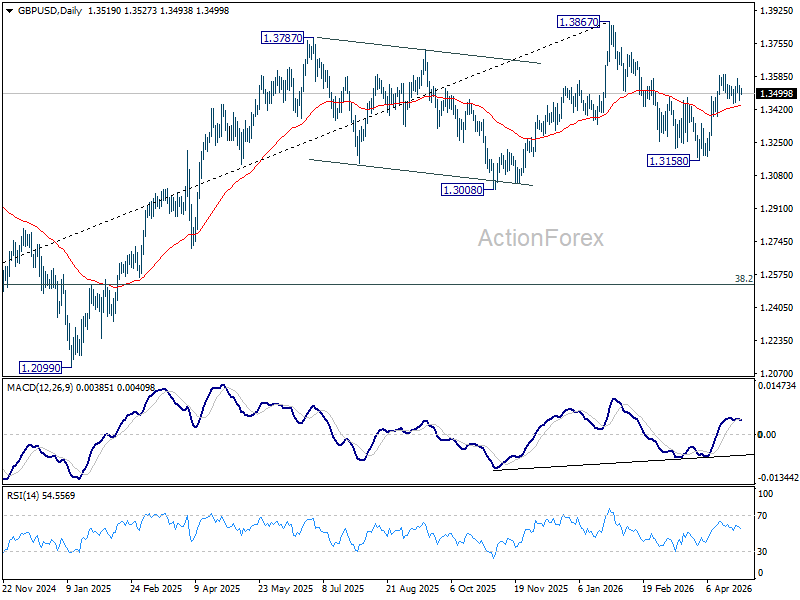
In the bigger picture, current development suggests that price actions from 1.3867 are merely a corrective pattern within the broader up trend from 1.0351 (2022 low). With 1.3008 support intact, medium term bullishness is maintained and break of 1.3867 is back in favor for a later stage, towards 1.4248 key resistance (2021 high).
USD/CHF Mid-Day Outlook
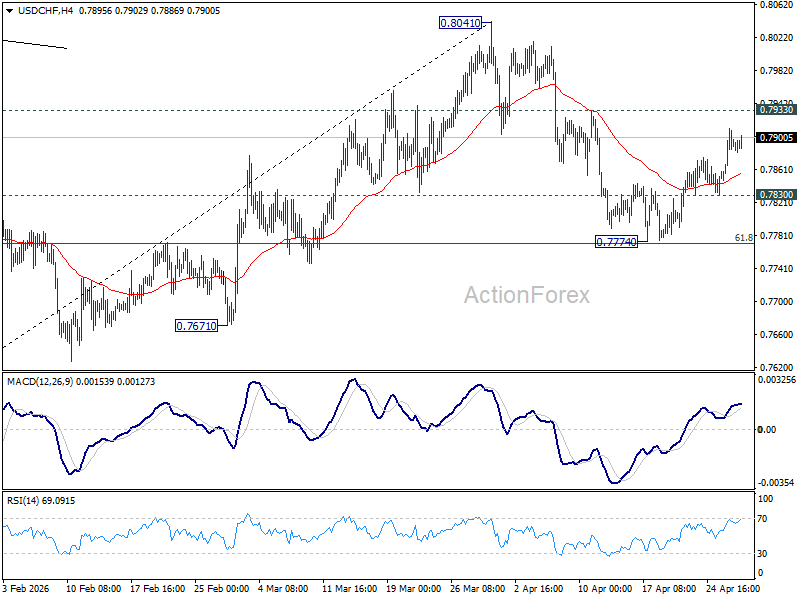
Daily Pivots: (S1) 0.7853; (P) 0.7883; (R1) 0.7923; More….
Intraday bias in USD/CHF stays neutral and outlook is unchanged. On the downside, below 0.7830 will turn bias to the downside for 0.7774 support. Sustained break of 61.8% retracement of 0.7603 to 0.8041 at 0.7770 will pave the way to retest 0.7603 low. However, decisive break of 0.7933 will argue that fall from 0.8041 has completed as a corrective move. Further rise should then be seen through 0.8041 to resume the whole rebound from 0.7603.
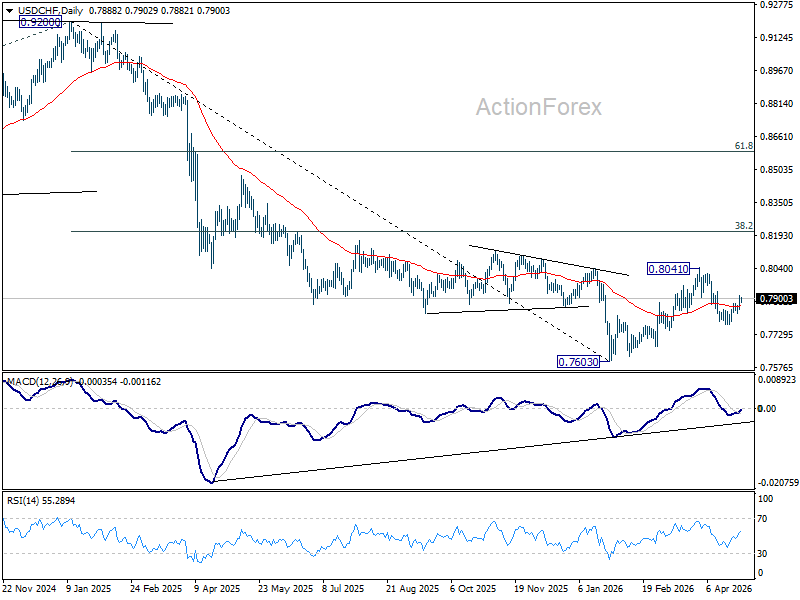
In the bigger picture, rebound from 0.7603 medium term bottom is seen as correcting the fall from 0.9200 only. Rejection by 55 W EMA (now at 0.8053) will affirm this bearish case, and setup down trend resumption to 100% projection of 1.0146 (2022 high) to 0.8332 from 0.9200 at 0.7382 at a later stage. Though, sustained break of 55 W EMA will suggest that it's probably correcting the larger scale down trend from 1.0146 (2022 high).
USD/JPY Mid-Day Outlook
Daily Pivots: (S1) 159.12; (P) 159.45; (R1) 159.95; More...
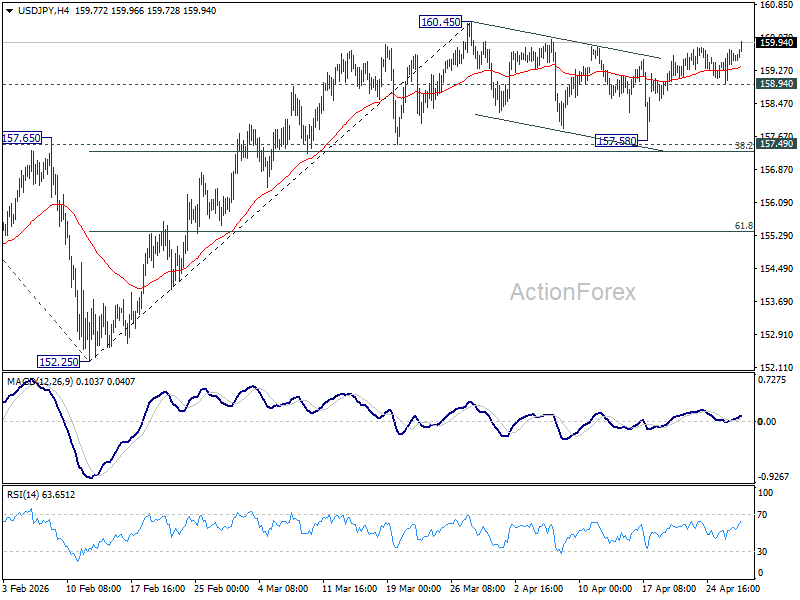
USD/JPY's rally continues today and focus is now on 160.45 resistance. Firm break there will confirm larger rally resumption for 161.94 high next. On the downside, below 158.94 minor support will indicate that consolidation pattern from 160.45 is starting another down leg. But still, overall outlook will remain bullish as long as 157.49 cluster support (38.2% retracement of 152.25 to 160.45 at 157.31) holds. Upside breakout is just delayed in this case.
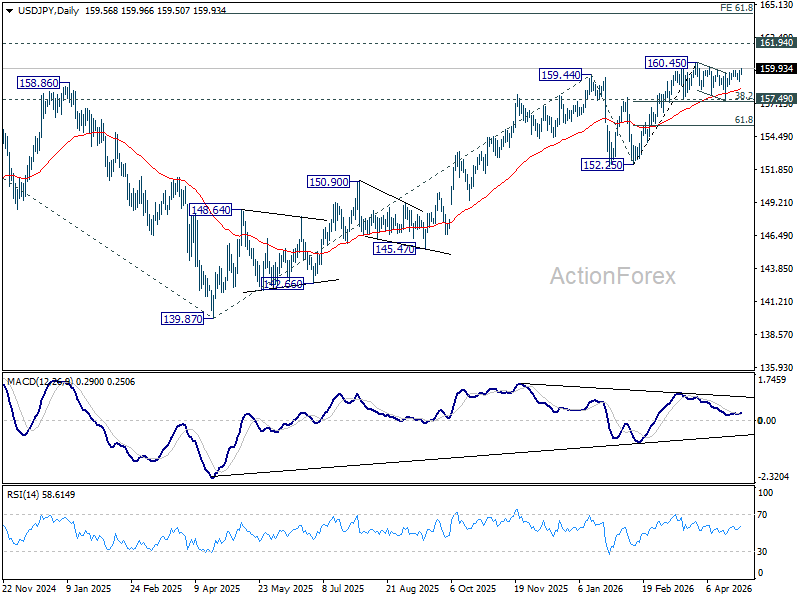
In the bigger picture, outlook is unchanged that corrective pattern from 161.94 (2024 high) should have completed with three waves at 139.87. Larger up trend from 102.58 (2021 low) could be ready to resume through 161.94. This will remain the favored case as long as 55 W EMA (now at 153.81) holds. Firm break of 161.94 will pave the way to 61.8% projection of 102.58 to 161.94 from 139.87 at 176.75.
USD/JPY Nears 160 Red Line: Will Traders or Japan Blink First?
USD/JPY is once again approaching the 160 level, putting markets on alert for potential Japanese intervention. The pair’s steady climb, driven by rising oil prices and widening rate differentials, is turning this level into a key flashpoint for global FX markets.
Yen’s weakness is not occurring in isolation. Oil prices have surged, with Brent breaking above $114 and WTI above $106, reinforcing inflation pressures globally. For Japan, a major energy importer, higher oil prices translate directly into currency weakness through deteriorating trade dynamics.
At the same time, higher energy costs are pushing yields up in major economies, widening the already significant rate gap with Japan. Even with the Bank of Japan’s recent hawkish shift, its policy rate remains far below global peers, leaving the Yen structurally disadvantaged.
This combination is driving USD/JPY higher toward the 160 threshold—a level widely seen as a "red line" for intervention. The key question now is whether markets will test that level aggressively or hesitate in anticipation of official action.
Japanese authorities have already stepped up rhetoric. Finance Minister Katayama warned again this week that the government is ready to take “bold action” against excessive currency moves. However, past experience shows that verbal intervention alone has limited impact without concrete follow-through.
The uncertainty lies in whether authorities will act decisively this time. Intervention at or near 160 could trigger a sharp reversal, particularly if markets are heavily positioned. But hesitation or delayed action could embolden traders to push the pair beyond the threshold.
Complicating the picture is the broader macro backdrop. Markets are currently in a holding pattern ahead of the FOMC decision, with traders reluctant to take strong positions. The Fed is widely expected to keep rates unchanged, and the lack of new projections suggests limited policy signals.
This has effectively delayed broader market reactions, including those to oil’s surge. Once the FOMC event risk is cleared, the focus could quickly shift back to yield differentials and oil-driven inflation pressures, reinforcing upward momentum in USD/JPY. In that scenario, the absence of intervention could accelerate gains.
For now, USD/JPY sits at a critical juncture. Whether it becomes a turning point or a launchpad for further gains will depend on a simple question—who blinks first: traders or Japan.
In the currency markets, for the week so far, Aussie is the strongest one, followed by Dollar, and then Loonie. Swiss Franc is the worst, followed by Kiwi, and then Yen. Euro and Sterling are positioning in the middle.
Fed–Market Disconnect Takes Center Stage as Powell’s Final FOMC Faces Oil-Driven Inflation Test
The Fed sees inflation as temporary—but markets are not convinced. As oil prices surge again, Powell’s final FOMC faces a critical test between sticking to the script or signaling a policy shift. Read More.
Eurozone Economic Sentiment Slumps as Confidence Drops Across Key Sectors
European sentiment is deteriorating fast. Consumer confidence is plunging, employment expectations are weakening, and growth outlook is turning softer across major economies. Read More.
Australia CPI Jumps to 4.6% as Fuel Surge Drives Headline Higher, Core Inflation Steady
Headline inflation is rising again in Australia, but stable core and easing services inflation suggest the shock remains concentrated rather than broad-based. Read More.
RBNZ's Breman: Ready to Act Decisively If Inflation Persists
RBNZ's Breman said if inflation persists, action will follow decisively. With fuel driving prices higher and core inflation still contained, policymakers are staying cautious but ready to tighten. Read More.
USD/JPY Mid-Day Outlook
Daily Pivots: (S1) 159.12; (P) 159.45; (R1) 159.95; More...
USD/JPY's rally continues today and focus is now on 160.45 resistance. Firm break there will confirm larger rally resumption for 161.94 high next. On the downside, below 158.94 minor support will indicate that consolidation pattern from 160.45 is starting another down leg. But still, overall outlook will remain bullish as long as 157.49 cluster support (38.2% retracement of 152.25 to 160.45 at 157.31) holds. Upside breakout is just delayed in this case.
In the bigger picture, outlook is unchanged that corrective pattern from 161.94 (2024 high) should have completed with three waves at 139.87. Larger up trend from 102.58 (2021 low) could be ready to resume through 161.94. This will remain the favored case as long as 55 W EMA (now at 153.81) holds. Firm break of 161.94 will pave the way to 61.8% projection of 102.58 to 161.94 from 139.87 at 176.75.
Eurozone Economic Sentiment Slumps as Confidence Drops Across Key Sectors
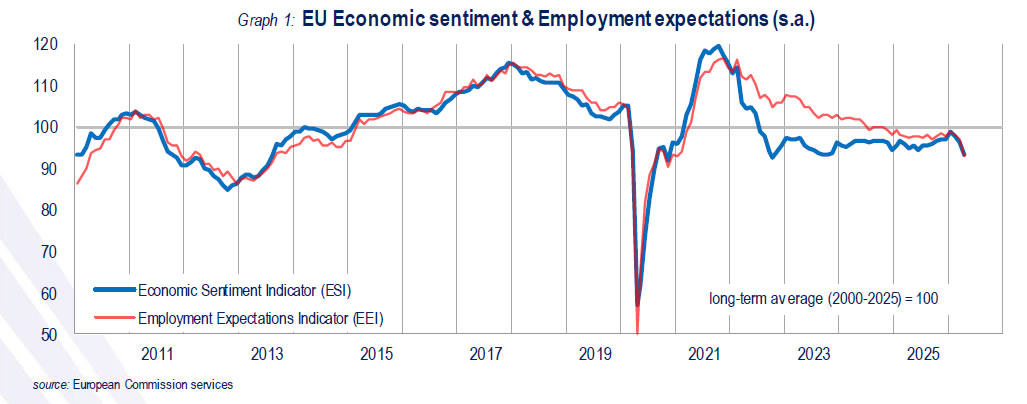
Economic sentiment in Europe weakened sharply in April, with the Economic Sentiment Indicator falling from 96.7 to 93.5 in the EU and from 96.2 to 93.0 in the Eurozone. The decline marks a clear deterioration in business and consumer confidence, pushing both readings well below the long-term average of 100.
The drop was driven primarily by a collapse in consumer confidence, alongside weaker sentiment among services and retail trade managers. In contrast, confidence in construction and industry held broadly steady, suggesting that the downturn is currently concentrated in demand-sensitive sectors rather than production.
The Employment Expectations Indicator also deteriorated significantly, falling from 97.2 to 93.2 in the EU and from 96.3 to 91.7 in the Eurozone, highlighting growing concerns over the labor market outlook.
Among major economies, the deterioration was widespread. Germany led the decline with a 3.9-point drop, followed by France (-3.0), Italy (-2.8), and the Netherlands (-2.5), while Spain and Poland saw more moderate declines.
| Indicator | Previous | Latest | Change |
|---|---|---|---|
| EU ESI | 96.4 | 93.5 | ↓ -2.9 |
| Eurozone ESI | 96.2 | 93.0 | ↓ -3.2 |
| EU EEI | 97.2 | 93.2 | ↓ -4.0 |
| Eurozone EEI | 96.3 | 91.7 | ↓ -4.6 |
| Country | Change |
|---|---|
| Germany | -3.9 |
| France | -3.0 |
| Italy | -2.8 |
| Netherlands | -2.5 |
| Spain | -0.9 |
| Poland | -0.8 |
Fed and ECB Set to Wait and See
- Markets are awaiting the Fed’s official stance.
- The ECB does not wish to repeat past mistakes.
The US dollar has entered a consolidation phase ahead of the Fed and ECB meetings and the lull in the Middle East. Central banks intend to adopt a wait-and-see stance amid geopolitical uncertainty. Right now, the US and Iran are playing a game of chicken. Tehran’s proposal to resolve the conflict did not go down well with the White House, which is preparing its own.
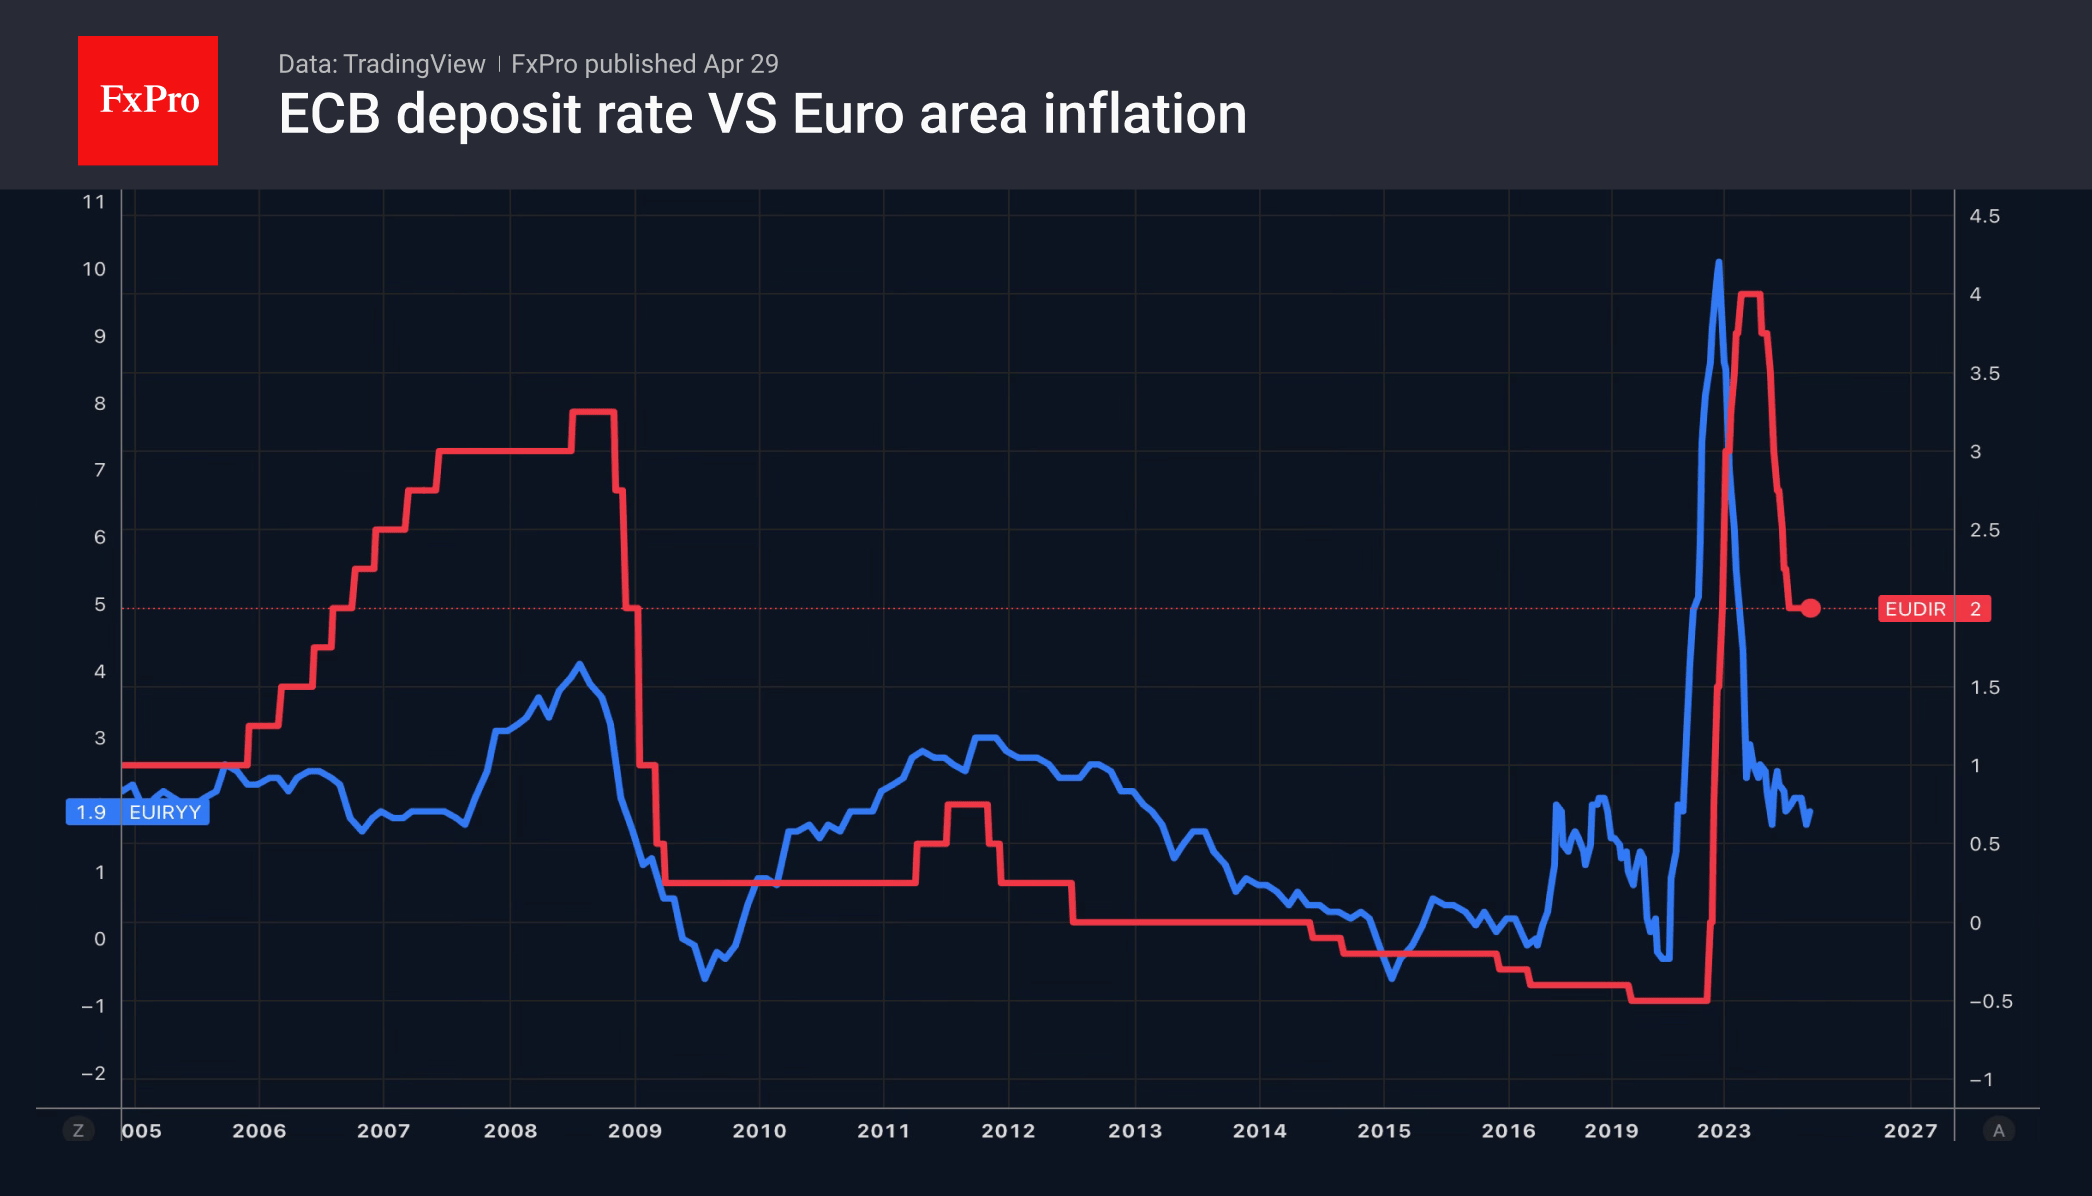
In 2008 and 2011, the ECB raised interest rates in response to rising inflation, only to slash them further a couple of months later to rescue the eurozone economy. In 2022, the Bank had already delayed tightening monetary policy for a very long time, allowing inflation to surge to double-digit levels. These are all acknowledged mistakes, and the desire not to repeat them is forcing the European Central Bank to maintain hawkish rhetoric without rushing into actual tightening.
Bloomberg experts expect Christine Lagarde to hint at a rate hike in June. If investors find these hints unconvincing, the EURUSD risks declining.
The Fed’s passivity stems from its intention to see how the conflict in the Middle East will affect the US. The post-pandemic recovery, the armed conflict in Ukraine and tariffs have had a temporary impact on the US economy and inflation.
However, the PCE has remained above the 2% target for a very long time, which risks undermining confidence in the central bank and entrenching higher inflation expectations. In such a situation, even the FOMC doves are speaking hawkishly. For instance, Christopher Waller warns that the Fed will eventually be forced to respond to a host of factors pointing to accelerating inflation.
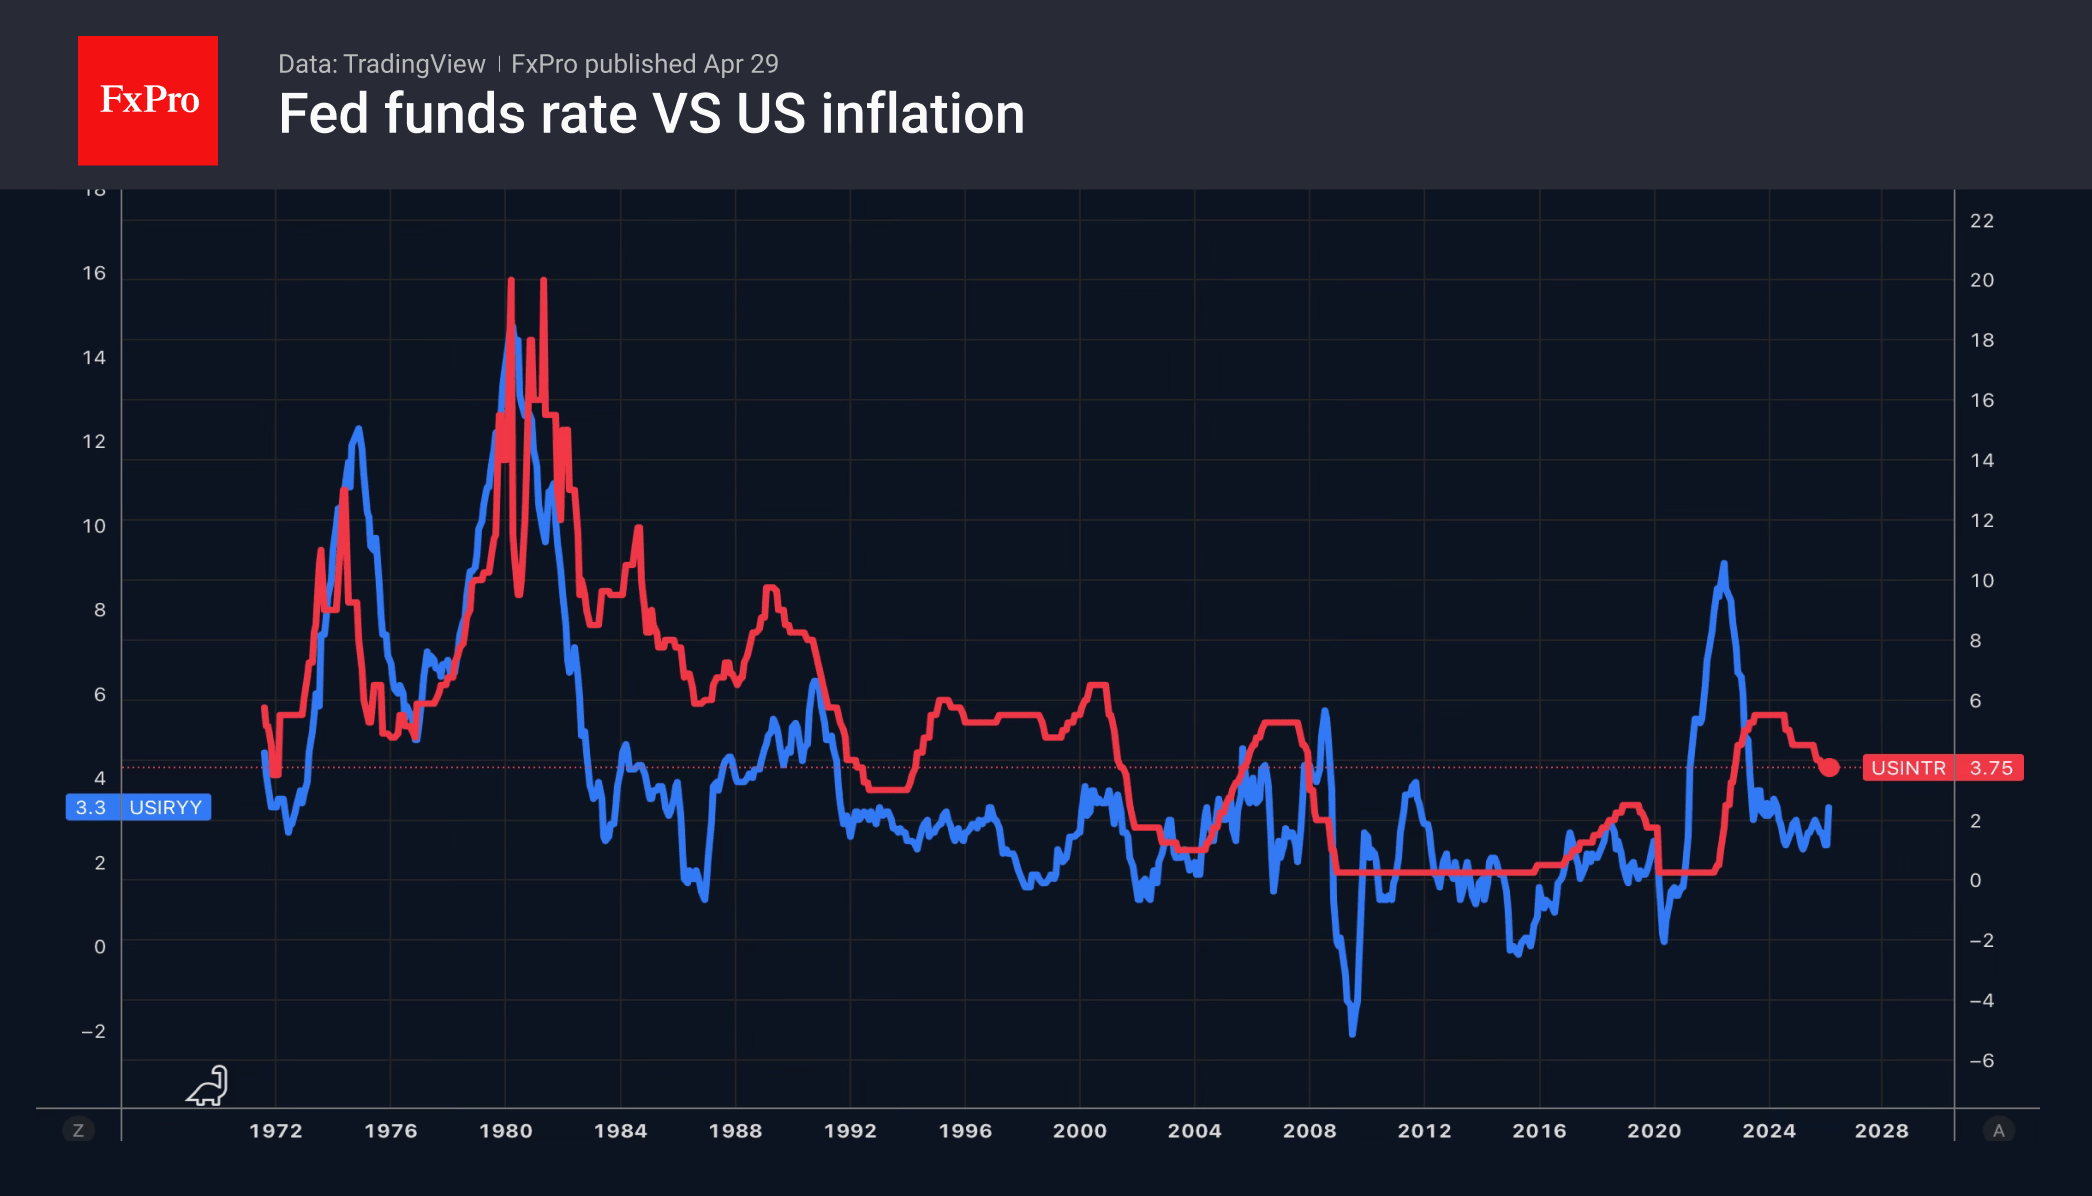
Just as much as the fate of interest rates, investors are keen to know whether Jerome Powell will remain on the FOMC until 2028 or step down once his term as Chair comes to an end. His departure would allow Donald Trump to increase the number of ‘doves’ and bring forward the timing of a rate cut. It would also make Kevin Warsh’s task of restructuring the Fed easier.
Fears over the FOMC’s ‘hawkish’ rhetoric in April, coupled with the resulting strengthening of the dollar and rise in US Treasury yields, have acted as a headwind for gold, with the precious metal plummeting to a four-week low. However, if Jerome Powell refrains from hinting at rate rises, gold could recover some of its losses.
Crypto Takes a Breather After Growth
Market Overview
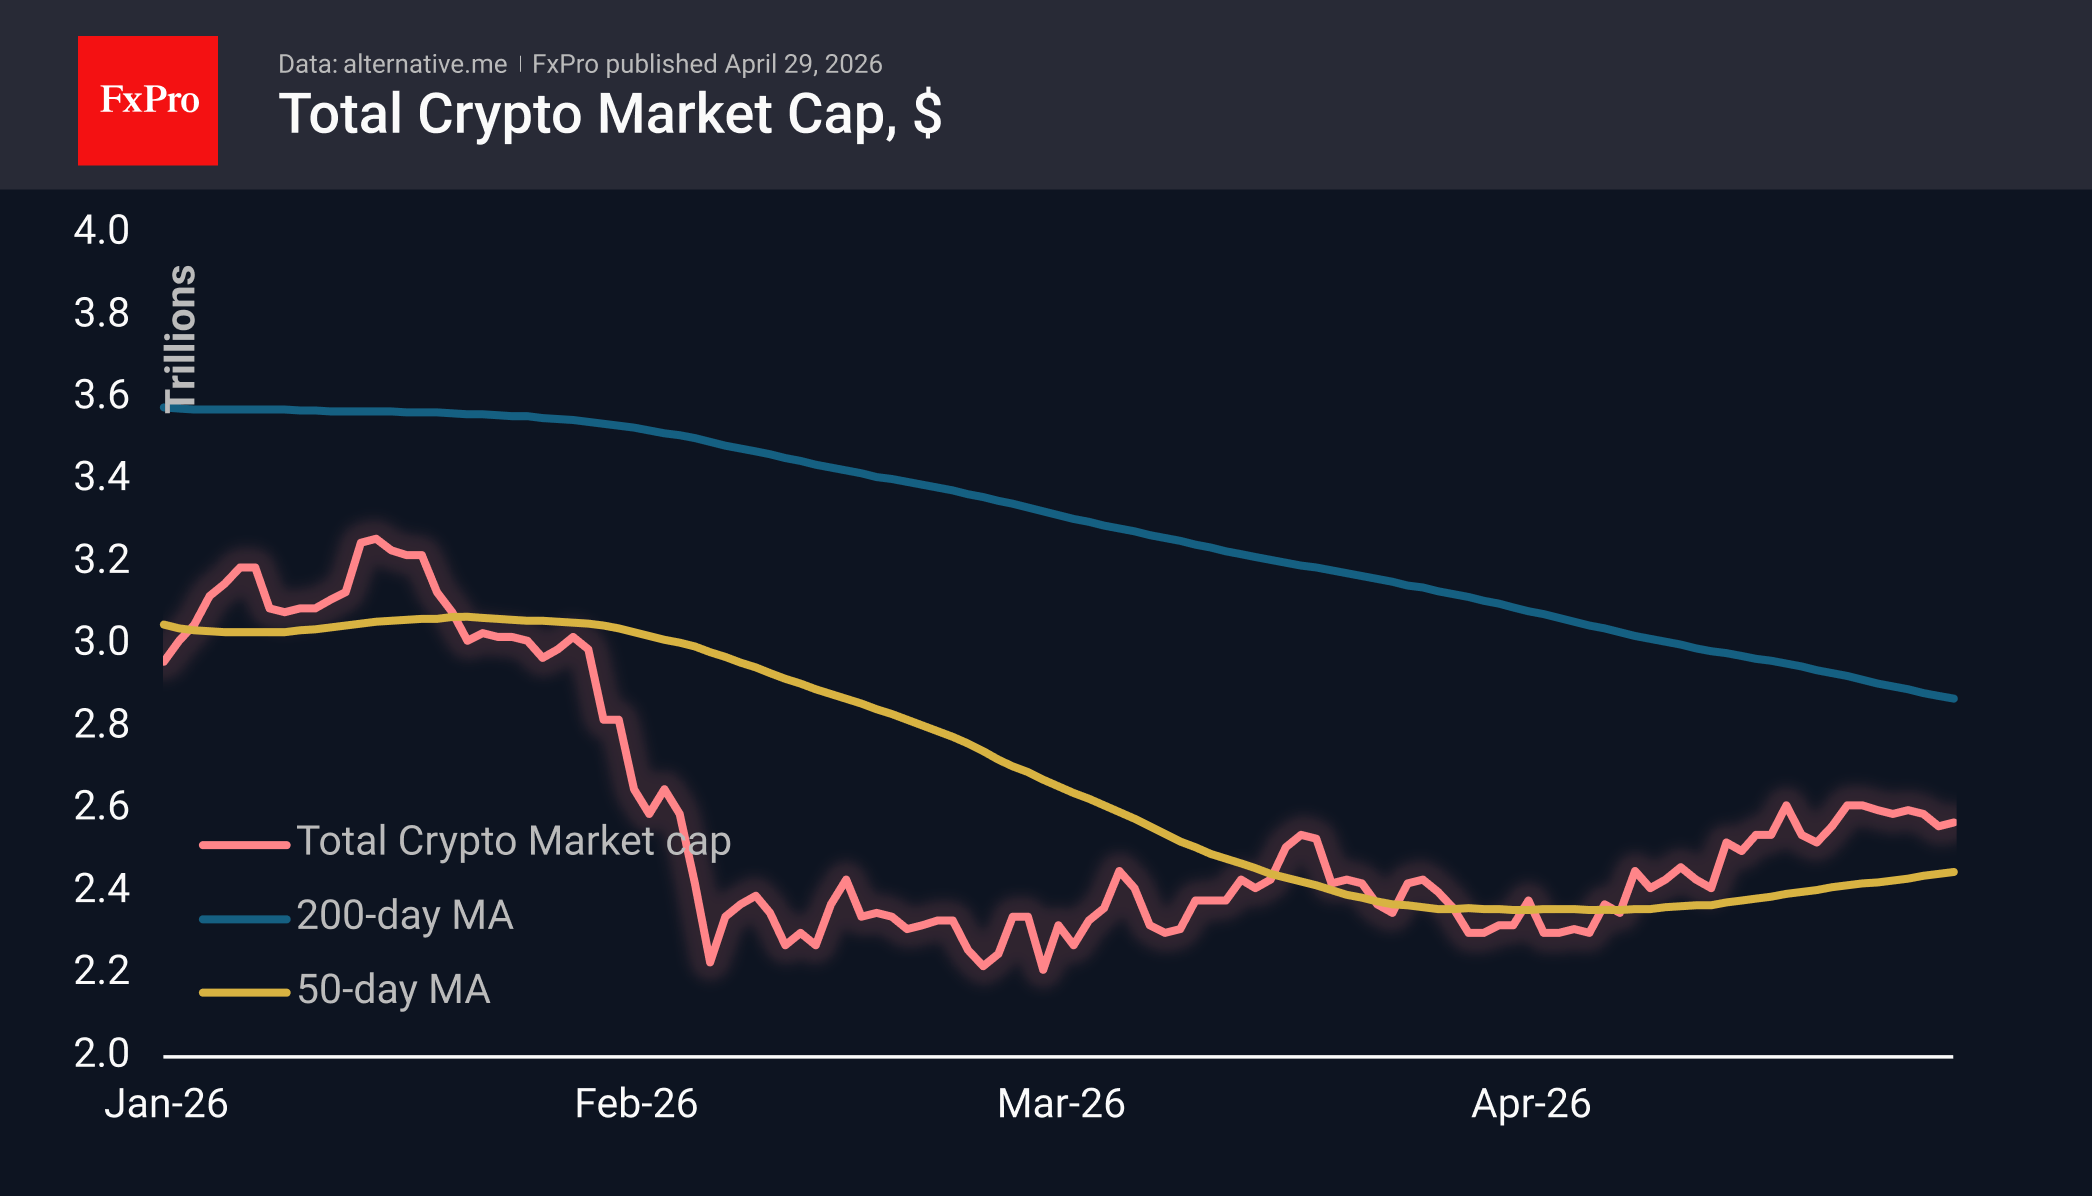
The crypto market capitalisation has changed little over the past 24 hours, hovering around $2.57 trillion, with assets moving in different directions. Markets are likely to prefer a wait-and-see approach ahead of decisions by the Bank of Canada, the Fed, the ECB and the Bank of England over the next couple of days. Officially, markets are expecting a hawkish tone, so a focus on the economy could spur active buying.
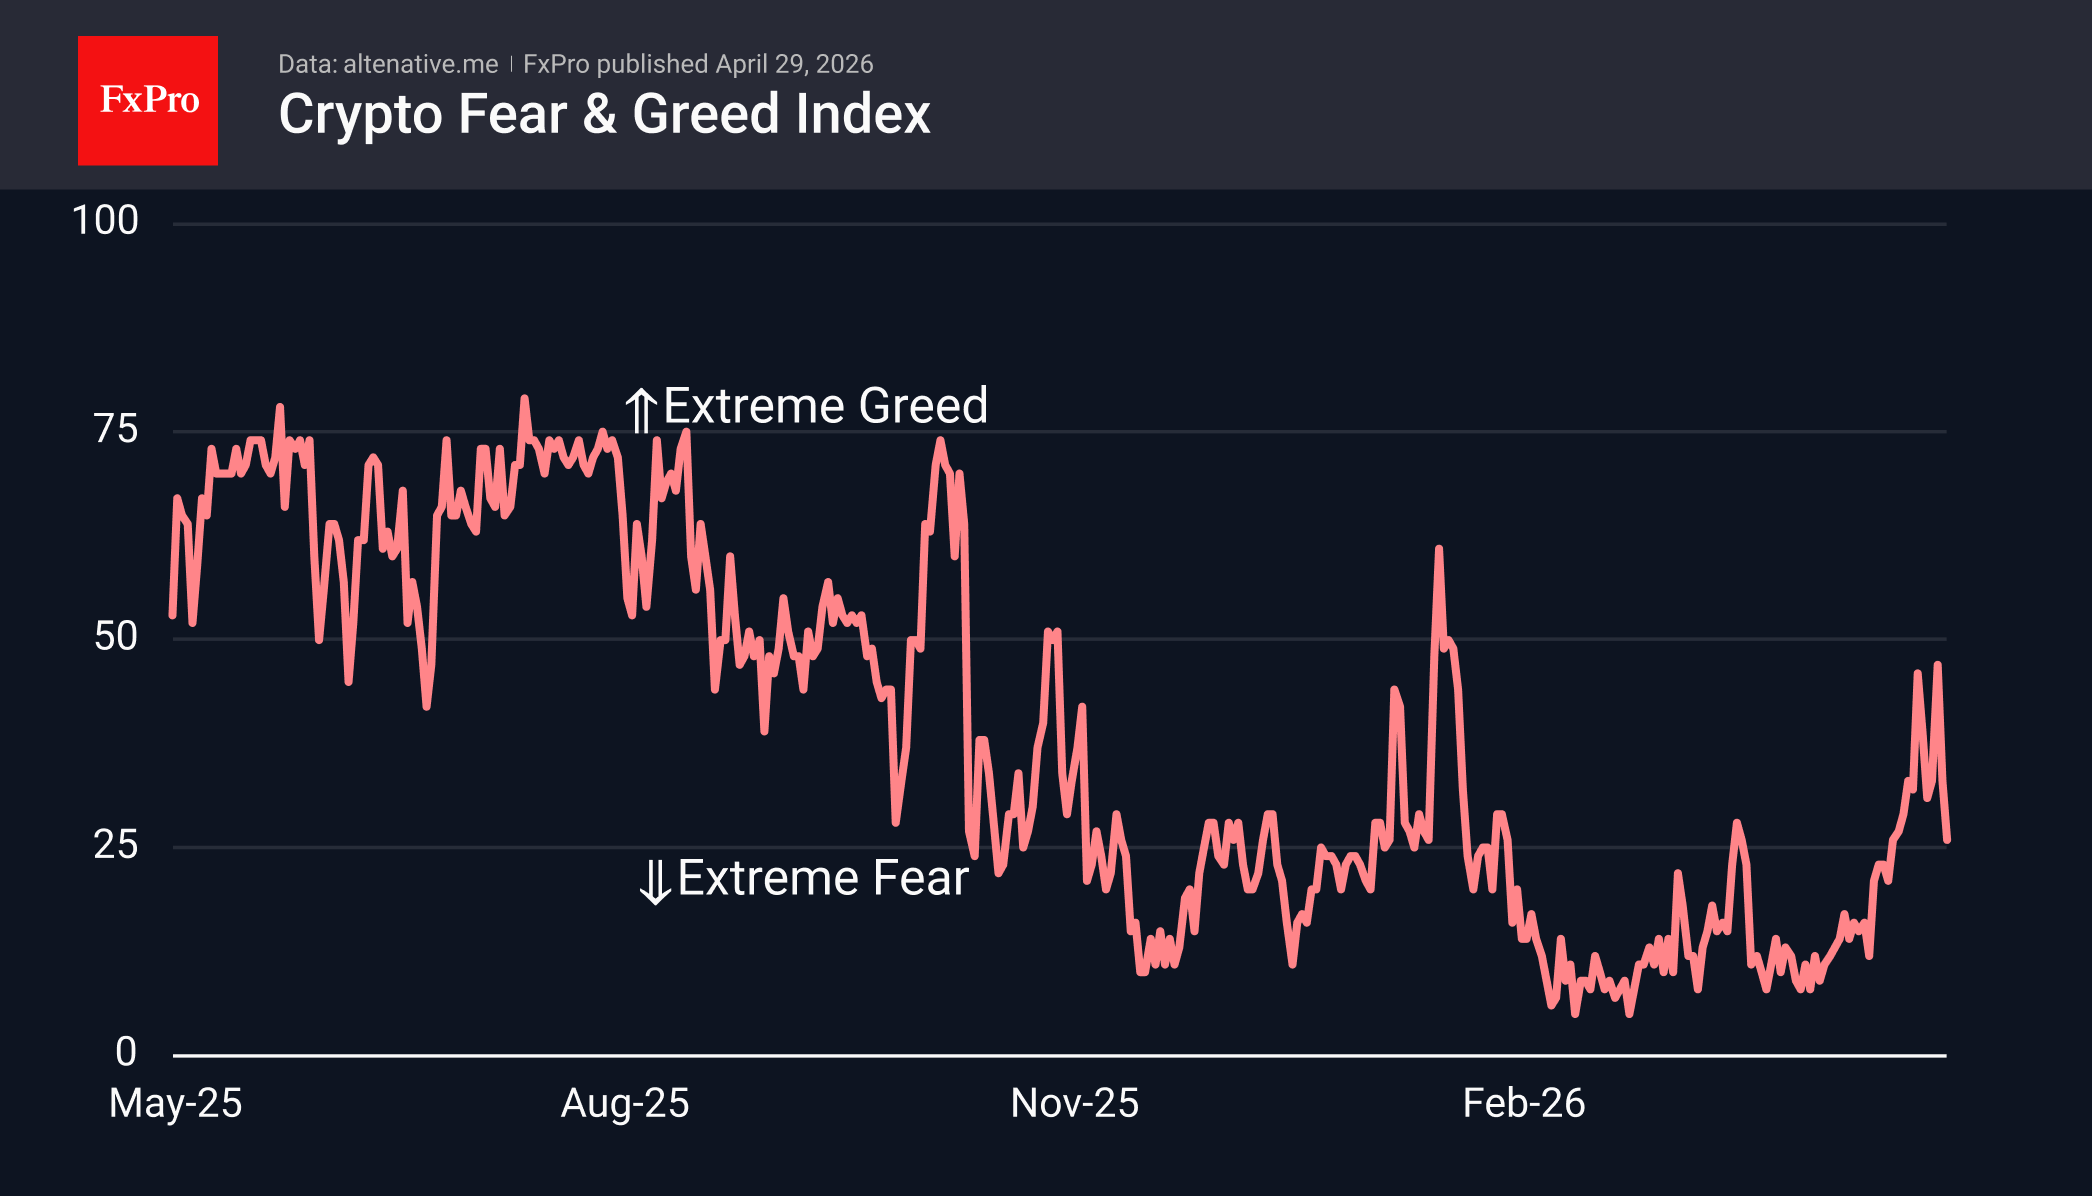
The sentiment index plummeted to 26, falling below last week’s lows, reflecting a return of fear to the markets. The inability to hold above 50 since September remains a key sign of bearish sentiment.
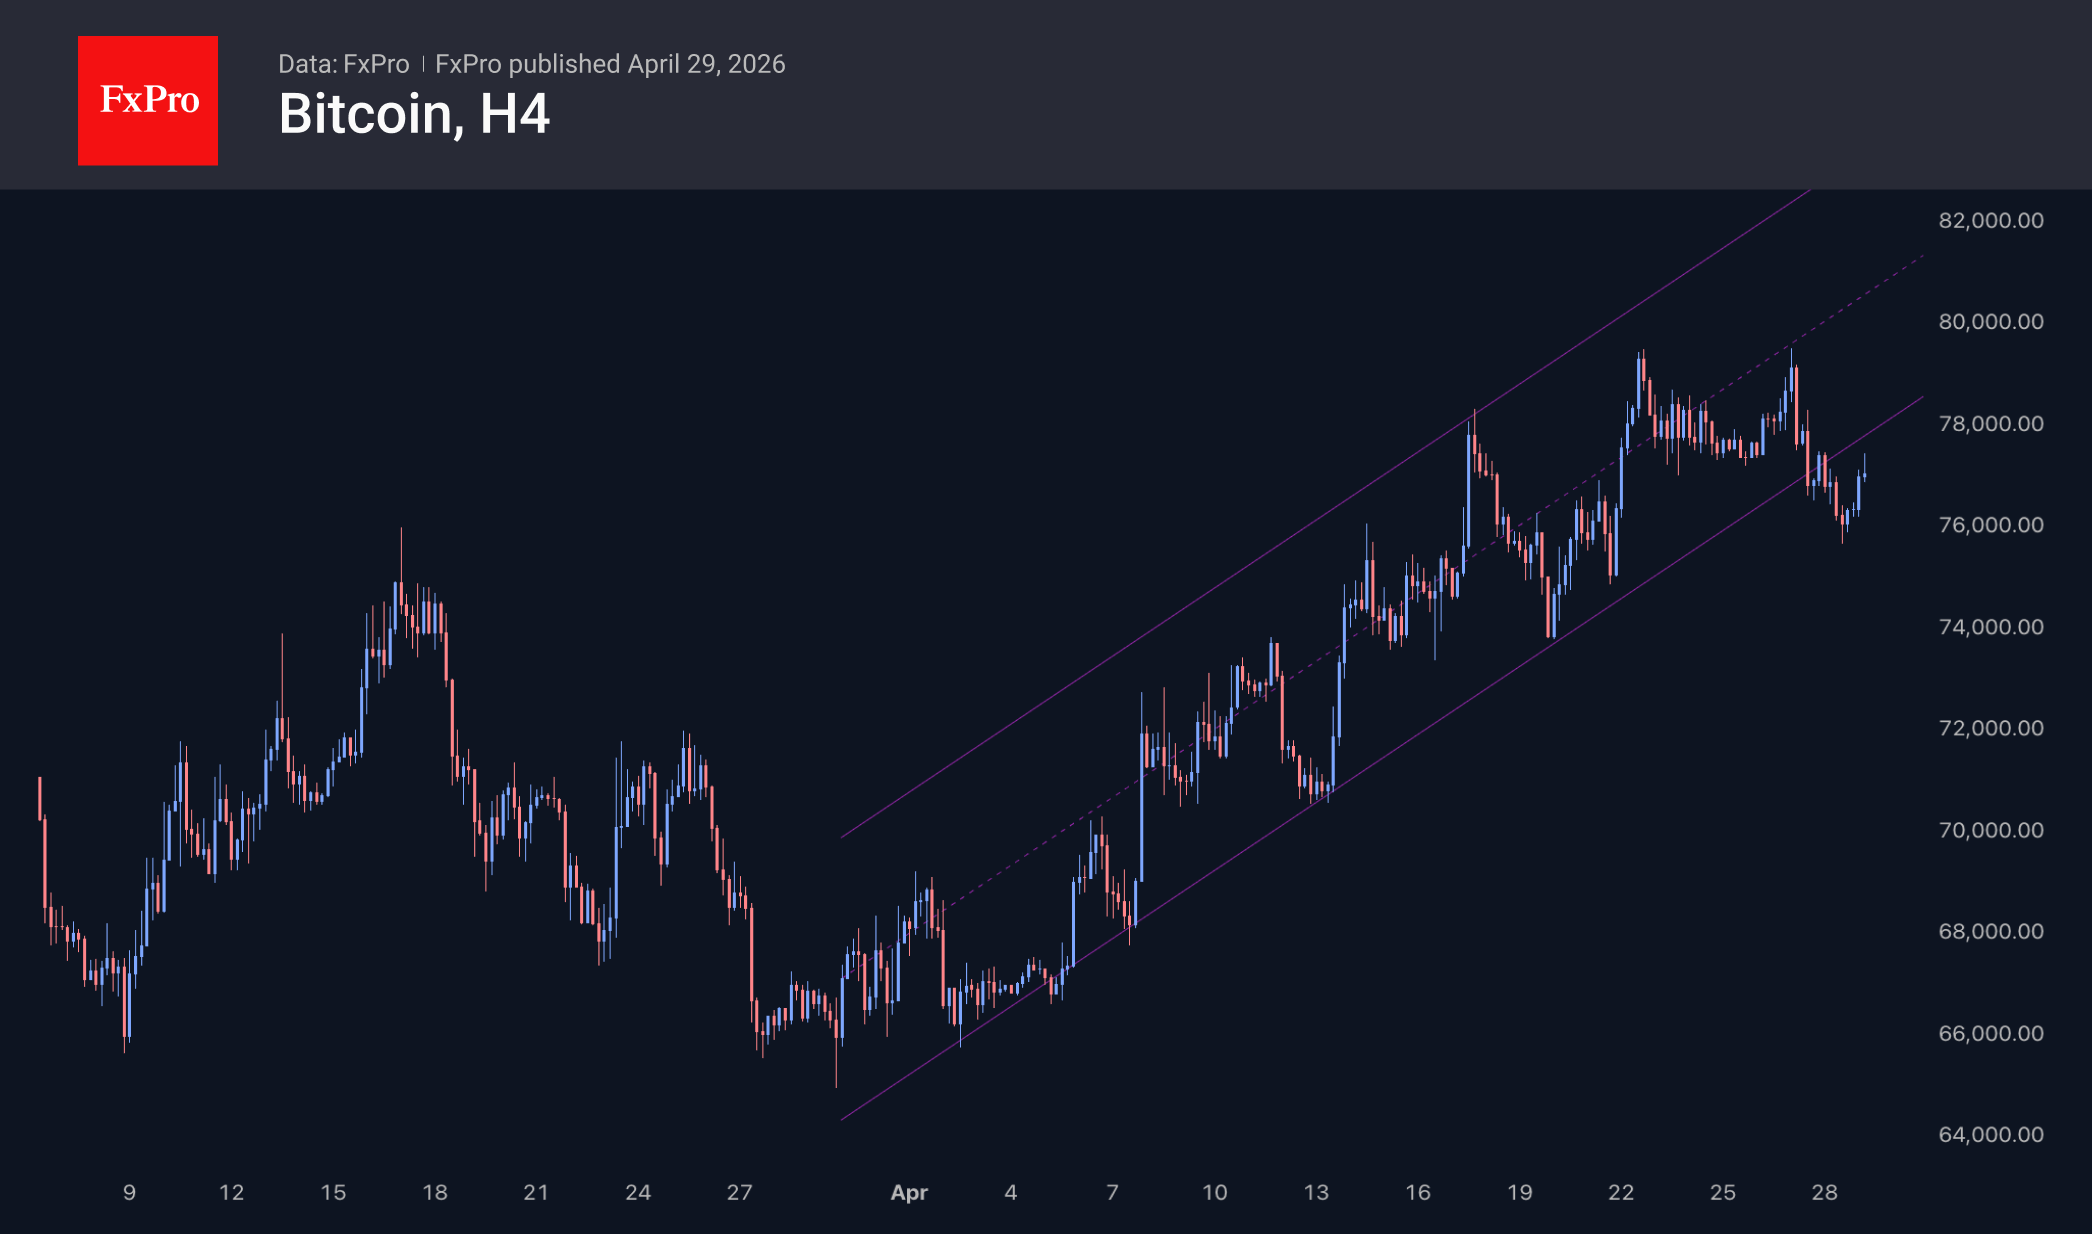
Over the past two days, Bitcoin has lost approximately $4K from peak to trough at $75.6K, but on Wednesday, it turned higher, attempting to consolidate above $77K. Thus, Bitcoin has broken out of its upward trend but has not yet confirmed a reversal; therefore, we can only note a slowdown in growth at the 50% mark of the January-February decline.
News Background
The $80K level remains an important psychological barrier, around which a large volume of options is concentrated, GSR notes. QCP Capital considers $82K to be a key resistance level.
Bernstein regards Bitcoin’s February low of $60K as a “clear bottom” and expects a “higher and structurally longer bull cycle” going forward. The main driver of optimism remains a steady inflow of capital from institutional investors.
Bitcoin is no longer merely an “interesting asset” for companies seeking to remain competitive, Tim Draper, founder of venture capital firm Draper Associates, stated. According to him, firms must hold a portion of their reserves (5–15%) in BTC to avoid being financially irresponsible towards their shareholders.
Patrick Witt, Executive Director of the US Presidential Council on Digital Assets, announced an “important statement” regarding the US strategic Bitcoin reserve, which will be made in the coming weeks.
Bitmine, the largest publicly traded corporate holder of Ethereum, announced the acquisition of over 5 million ETH over 10 months, at an average cost of $2,369 per ETH. The company’s reserves have reached nearly 5.08 million ETH, representing 4.21% of the Ethereum supply.