

Sample Category Title
EUR/USD Holds Steady Ahead of Fed Meeting, Focus on Middle East Outlook
EUR/USD is slightly lower on Wednesday, trading with minimal movement around 1.1708. The market is preparing for a Federal Reserve meeting, which could be Jerome Powell's last before his term ends in May.
The regulator is expected to keep rates unchanged. However, investors will closely monitor its assessment of how the Middle East conflict is affecting the economy.
Other major central banks, including the ECB, the Bank of England, and the Bank of Canada, will also announce policy decisions this week. The Bank of Japan has already delivered a more hawkish signal by keeping rates unchanged.
Geopolitics continues to support the US dollar. US-Iran talks have stalled, the Strait of Hormuz remains closed, and inflation risks are rising.
According to media reports, Donald Trump was dissatisfied with Iran's latest proposal and insisted that the nuclear issue must be included in negotiations from the outset.
Technical Analysis
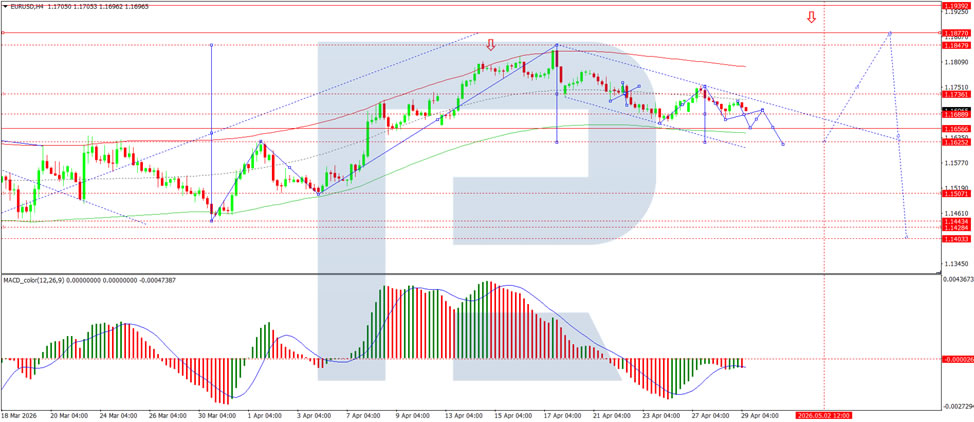
On the H4 chart of EUR/USD, the pair is trading within a consolidation range around 1.1688, currently extending down to 1.1675. A move lower below this level is likely, with potential downside towards 1.1656 and possibly 1.1616. Technically, this scenario is confirmed by the MACD indicator, with its signal line below zero and pointing firmly downwards, reflecting continued bearish momentum.
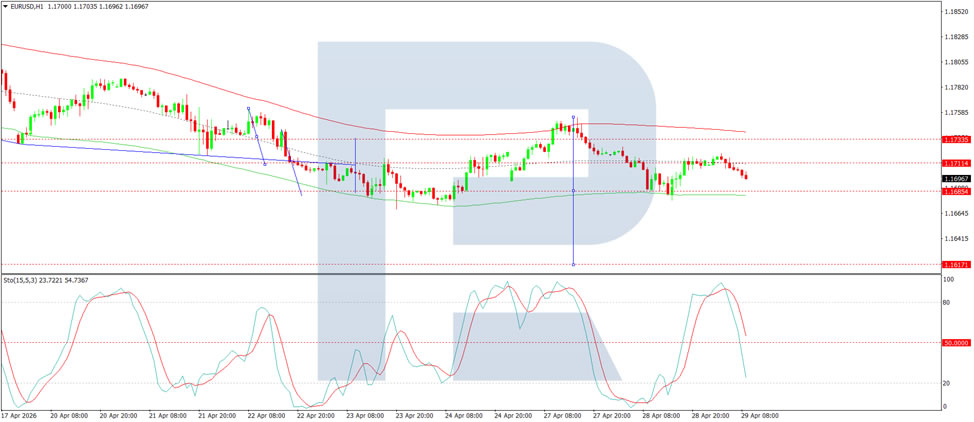
On the H1 chart, EUR/USD is developing a move lower towards 1.1685. A corrective rebound to 1.1705 may follow, before a further decline towards 1.1650 and potentially 1.1616. Technically, this scenario is confirmed by the Stochastic oscillator, with its signal line below 80 and pointing firmly downwards towards 20.
Conclusion
EUR/USD is trading sideways ahead of the Federal Reserve meeting, with markets focused on how policymakers assess the economic impact of the Middle East conflict. While the Fed is widely expected to hold rates steady, this meeting is particularly significant as it may be Jerome Powell's last before his term ends in May. Geopolitical pressures remain firmly in place: US-Iran talks have stalled, the Strait of Hormuz is closed, and inflation risks are rising, all of which continue to support the US dollar. Additional central bank decisions from the ECB, BoE, and BoC this week add to the cautious market tone. Technically, the euro appears vulnerable, with indicators pointing to further downside towards 1.1650–1.1616 in the near term. The direction will likely hinge on the Fed's tone regarding both rates and geopolitical risks.
EUR/USD and GBP/USD consolidate ahead of the Fed decision
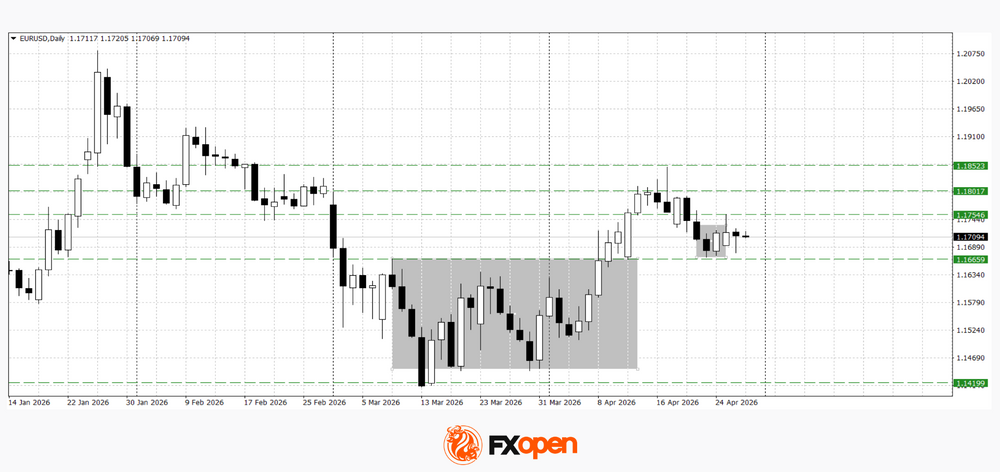
European currencies are showing subdued dynamics, entering a consolidation phase following their previous advance. Earlier, EUR/USD and GBP/USD broke out of their ranges and strengthened; however, the subsequent correction has led both pairs to retest the previously breached upper boundaries of their sideways channels. The current stabilisation near these levels reflects a balance of forces in the market and a wait-and-see stance among participants ahead of the key decision by the Federal Reserve.
The main focus is on the Federal Reserve meeting, including the interest rate decision, the accompanying statement, and the press conference. The market is assessing potential signals regarding the future trajectory of monetary policy, which is limiting activity and restraining the formation of a directional move. Additional influence may come from macroeconomic data from the US, the euro area, and the United Kingdom.
EUR/USD
The EUR/USD pair is consolidating near the previously broken range, holding above key levels. This dynamic preserves a structure favourable for further gains; however, the lack of new drivers is restraining the development of upward momentum. The reaction to the Fed decision may provide the impulse for a breakout from the current range.
Technical analysis of EUR/USD suggests the possibility of a retest of 1.1750, as a bullish engulfing pattern has formed on the daily timeframe. A firm move below 1.1650 could lead to the pair returning to the previously broken range.
Key events for EUR/USD:
- today at 09:00 (GMT+3): speech by Bundesbank’s B. Balz;
- today at 18:30 (GMT+3): speech by Bundesbank Vice President Buch;
- tomorrow at 11:00 (GMT+3): Germany’s gross domestic product.
GBP/USD
The GBP/USD pair is showing a similar structure, holding near its levels after a corrective pullback. The current consolidation reflects market uncertainty and expectations of signals from the Federal Reserve and the outlook for Bank of England policy. Depending on the regulators’ rhetoric, the pair may either resume its advance and firmly establish itself above 1.3600, or deepen the correction and fall below 1.3460.
Key events for GBP/USD:
- today at 17:00 (GMT+3): Atlanta Fed GDPNow indicator;
- today at 21:00 (GMT+3): US Federal Reserve interest rate decision;
- today at 21:30 (GMT+3): FOMC press conference.
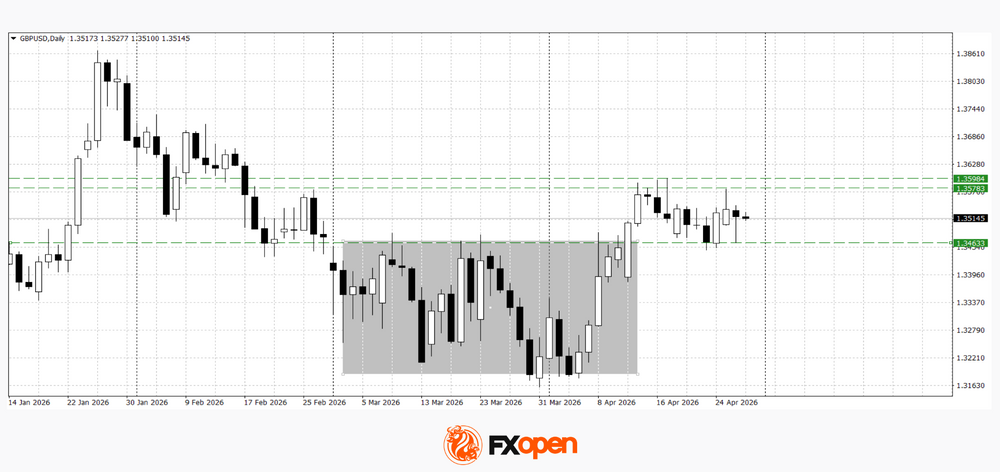
Overall, the market is at a point of equilibrium, where previously broken levels act as a key decision zone. The outcome of the Federal Reserve meeting may serve as the main driver: a more dovish tone could support a continuation of the upward momentum in European currencies, while more hawkish signals may increase pressure and lead to a deeper correction.
Trade over 50 forex markets 24 hours a day with FXOpen. Take advantage of low commissions, deep liquidity, and spreads from 0.0 pips (additional fees may apply). Open your FXOpen account now or learn more about trading forex with FXOpen.
This article represents the opinion of the Companies operating under the FXOpen brand only. It is not to be construed as an offer, solicitation, or recommendation with respect to products and services provided by the Companies operating under the FXOpen brand, nor is it to be considered financial advice.
Nasdaq 100: AI Bubble Fears Overblown, Bullish Trend Intact Above 26,760 Key Intraday Support
Key takeaways
- AI bubble fears lack confirmation as trend holds: Despite a temporary sell-off triggered by concerns around OpenAI revenue, the Nasdaq 100 stabilised, suggesting that recent “AI bubble” worries are not yet supported by technical or momentum signals.
- Semiconductors continue to lead without peak signals: The Philadelphia Semiconductor Index (SOX) remains the key market leader with strong gains, but current momentum levels are still below dot-com bubble extremes and show no bearish divergence, indicating further upside may be possible.
- Bullish structure intact above key support: The Nasdaq 100 continues to trade within an ascending channel, supported by healthy market breadth and bullish momentum signals, with 26,760 acting as the critical level to maintain near-term upside potential.
On Tuesday, 29 April 2026, the Wall Street Journal reported (before the start of the US session) that AI start-up, OpenAI (creator of ChatGPT) had fallen short of several internal revenue targets that spooked traders, leading to a sell-off on the Nasdaq 100 E-mini futures of 1.5%, and several US technology and semiconductor stocks (NVIDIA, Broadcom, AMD).
The Nasdaq 100 managed to trim its losses as US trading hours progressed on Tuesday and ended the session with a reduced loss of 1%, aided by OpenAI refuting the claims made in the Wall Street Journal report.
Bubble concerns have resurfaced around the AI-driven productivity and infrastructure capex narrative that powered the sharp rebound in US equities, erasing losses from the US–Iran conflict. Despite pushing the Nasdaq 100, S&P 500, and Russell 2000 to fresh record highs, investors are increasingly questioning whether aggressive AI spending can deliver sustainable returns, raising the risk that valuations may be running ahead of fundamentals.
My colleagues, Zain and Elior, have written reports on the upcoming earnings releases of key Nasdaq 100 component stocks, Alphabet and Microsoft (links below), due after the close of today’s US session, which can also influence the intraday movements of the Nasdaq 100.
Semiconductor stocks are leaders that led the stock market bullish cycle
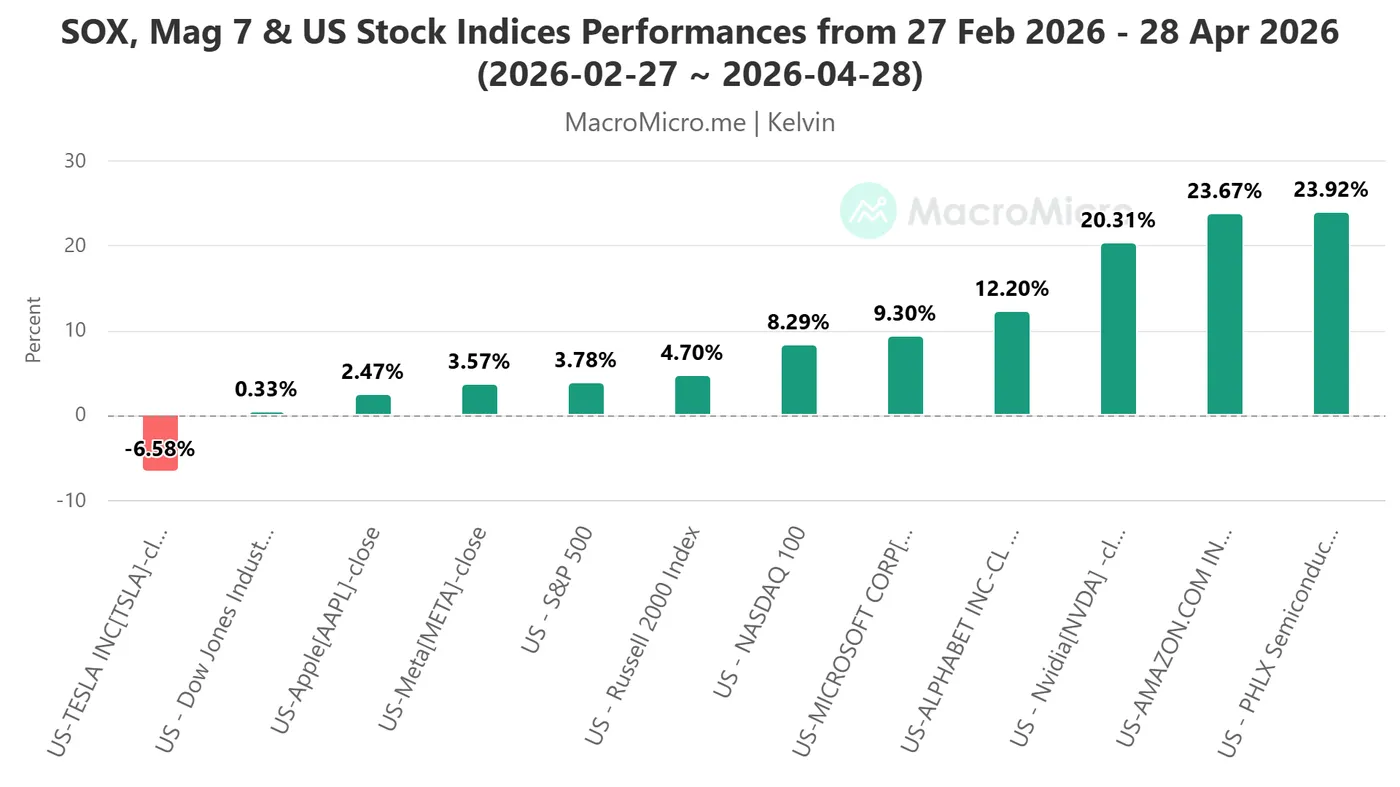
Fig. 1: SOX, Magnificent 7 & US stock indices performances from 27 Feb 2026 to 28 Apr 2026 (Source: MacroMicro).
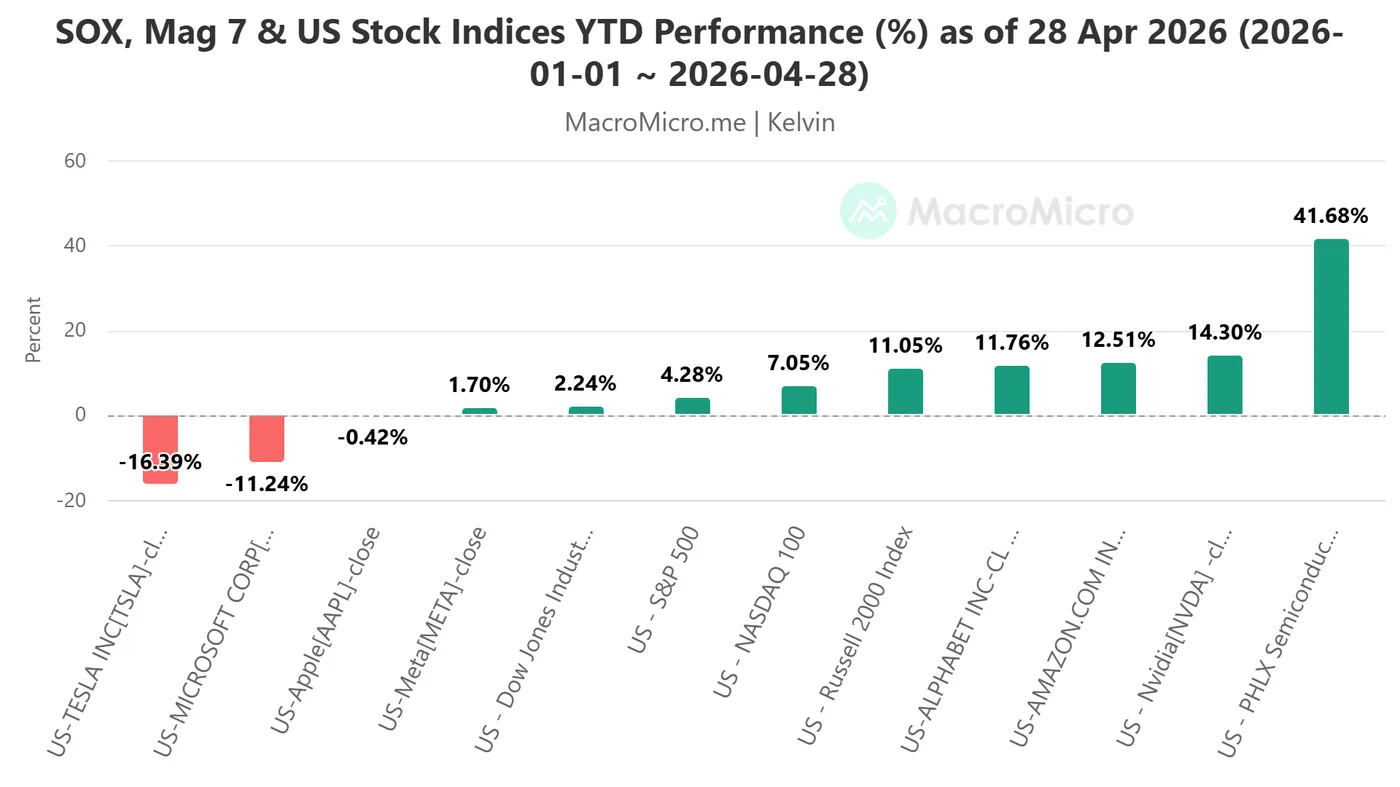
Fig. 2: SOX, Magnificent 7 & US stock indices YTD performances as of 27 Apr 2026 (Source: MacroMicro).
For US stock market traders, monitoring the health of the semiconductor stocks is paramount, even though they do not have any semiconductor names on their watchlists, because they are the market leaders that led the recovery stages of a broader market bull cycle.
Also, towards the end of the bull cycle, these market leaders will tend to be the first or second sectors that flash out signs of bullish exhaustion, a warning that the broader stock market trend is about to stage a bearish reversal.
So far, the barometer for the US semiconductor stocks, the Philadelphia Semiconductor Index (SOX), which consists of 30 stocks, is the leader of the ongoing recovery since the US-Iran war started on 28 February 2026. Using the pre-war baseline of 27 February 2026 to Tuesday, 28 April 2026, the SOX recorded a gain of 24% (see Fig. 1), surpassing the returns of the “Magnificent 7” except for Amazon, and the four US benchmark stock indices.
On a year-to-date performance basis as of 28 April 2026, the SOX led the pack significantly with a whopping return of 42% (see Fig. 2).
Read now, I shall uncover several key momentum and market breadth factors that suggest the medium-term bullish trend of the Nasdaq 100 since the 30 March 2026 low remains intact.
140% year-on-year gain on SOX is not extreme and overbought yet
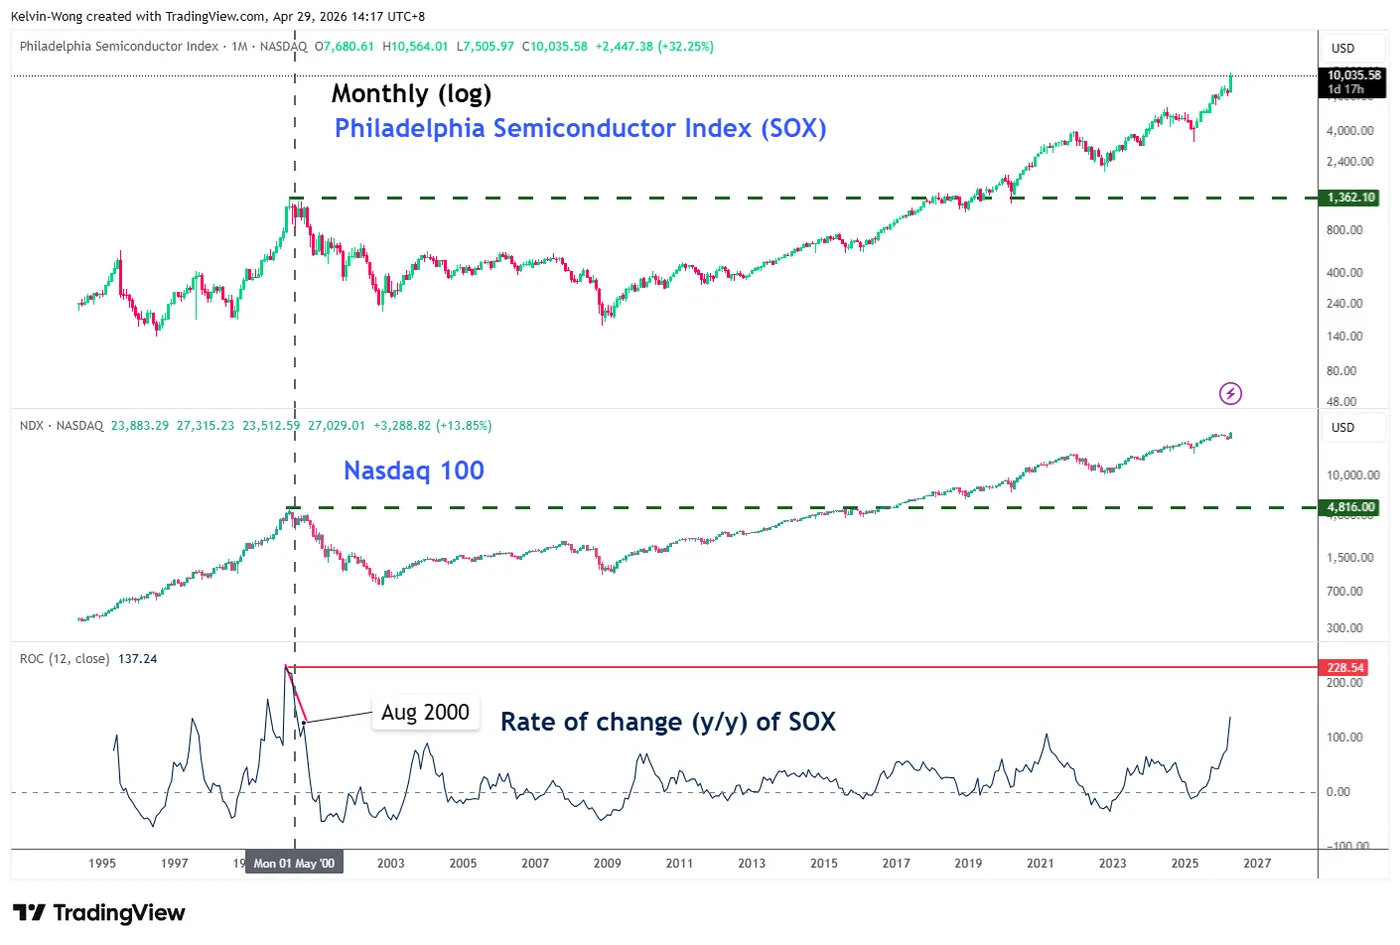
Fig. 3: Philadelphia Semiconductor Index (SOX) long-term secular trend with 12-month ROC (Source: TradingView).
The recent rally in the US semiconductor stocks (Philadelphia Semiconductor Index), in the past four weeks, has been historic, by some measures, the most frenzied since the dot-com bubble days since 2000.
Until Friday, 24 April 2026, the SOX was up nearly 40% in April and up over 160% from a year earlier, both the most since 2000, driving up fears of a bubble bursting that may lead to devastating wealth destruction in terms of magnitude and time. The Nasdaq 100 took 15 years, and the SOX almost 18 years, to revisit their 2000 peaks after the dotcom bubble burst.
Based on data as of Tuesday, 28 April 2026, the year-on-year increase of the SOX is at 137% (see Fig. 3), which is still way below the 228% y/y gain seen on SOX that coincided with the major top of the SOX and Nasdaq 100 in March 2000, before the dotcom bubble burst.
Also, before the SOX and Nasdaq 100 tumbled drastically from September 2000 to October 2002, the 12-month Rate of Change (y/y) of the SOX flashed out a bearish divergence condition in August 2000, before the start of the September 2000-October 2002 major downtrend phase (see Fig 3).
Right now, there is no bearish divergence condition on the 12-month Rate of Change (y/y) of the SOX.
Market breadth of Nasdaq 100 remains healthy
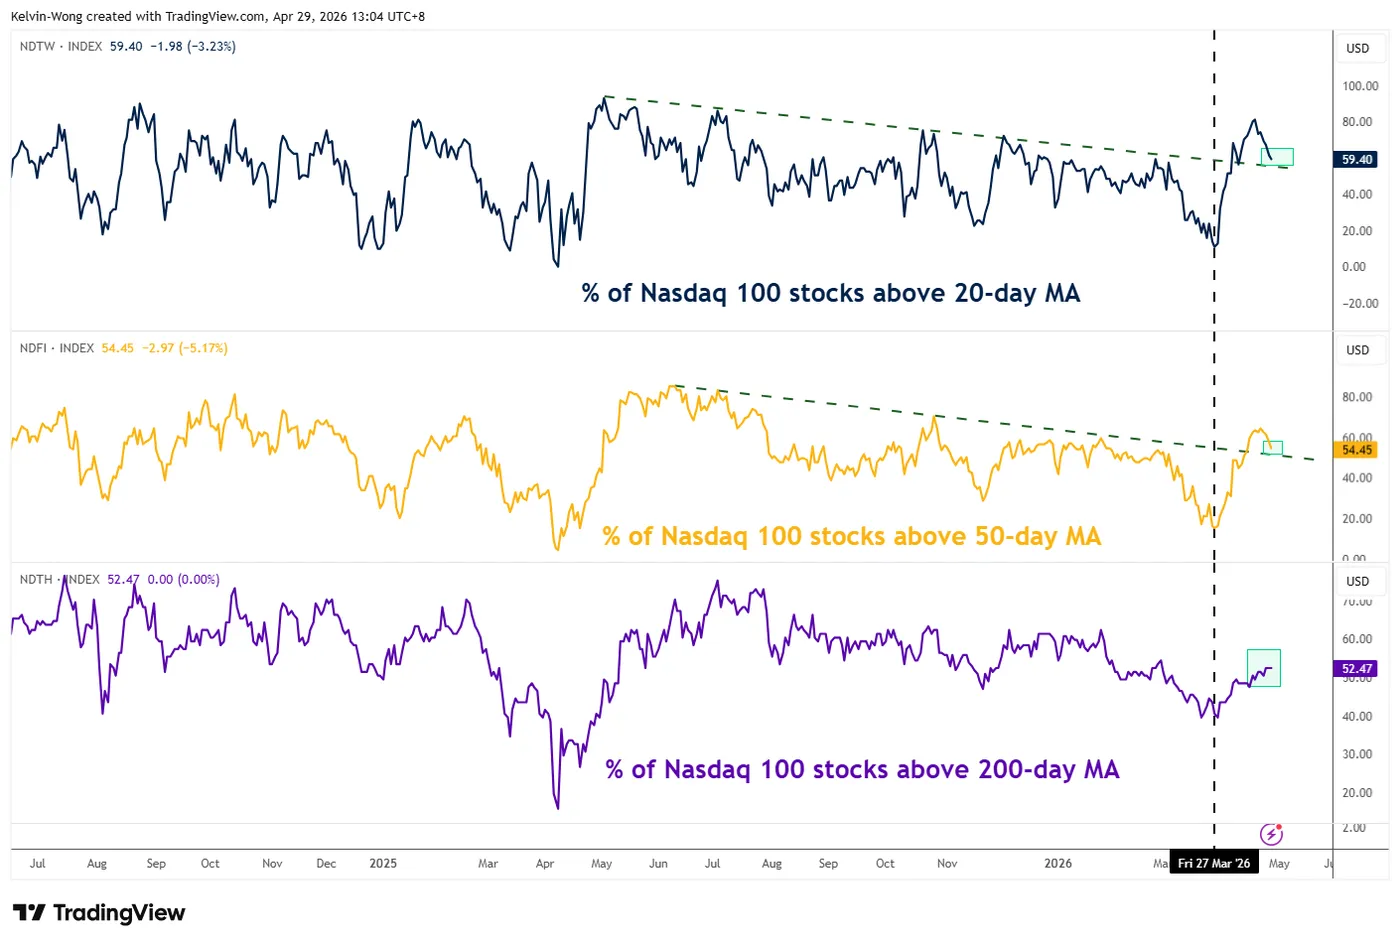
Fig. 4: Percentage of Nasdaq 100 stocks trading above 20-day, 50-day & 200-day moving averages as of 17 Apr 2026 (Source: TradingView).
The share of Nasdaq 100 component stocks trading above their 20-day and 50-day moving averages is still holding above the 50% level; 59% and 54%, respectively, as of Tuesday, 28 April 2026.
Also, the percentage of Nasdaq 100 component stocks above the longer-term 200-day moving average has improved slightly to 52% (above 50%) from 48% printed earlier on 15 April 2026 (see Fig. 4).
Let's now focus on the short-term trajectory (1 to 3 days) of the US Nasdaq 100 CFD index and its supporting elements from a technical analysis perspective.
Nasdaq 100 – Oscillating within a bullish ascending channel
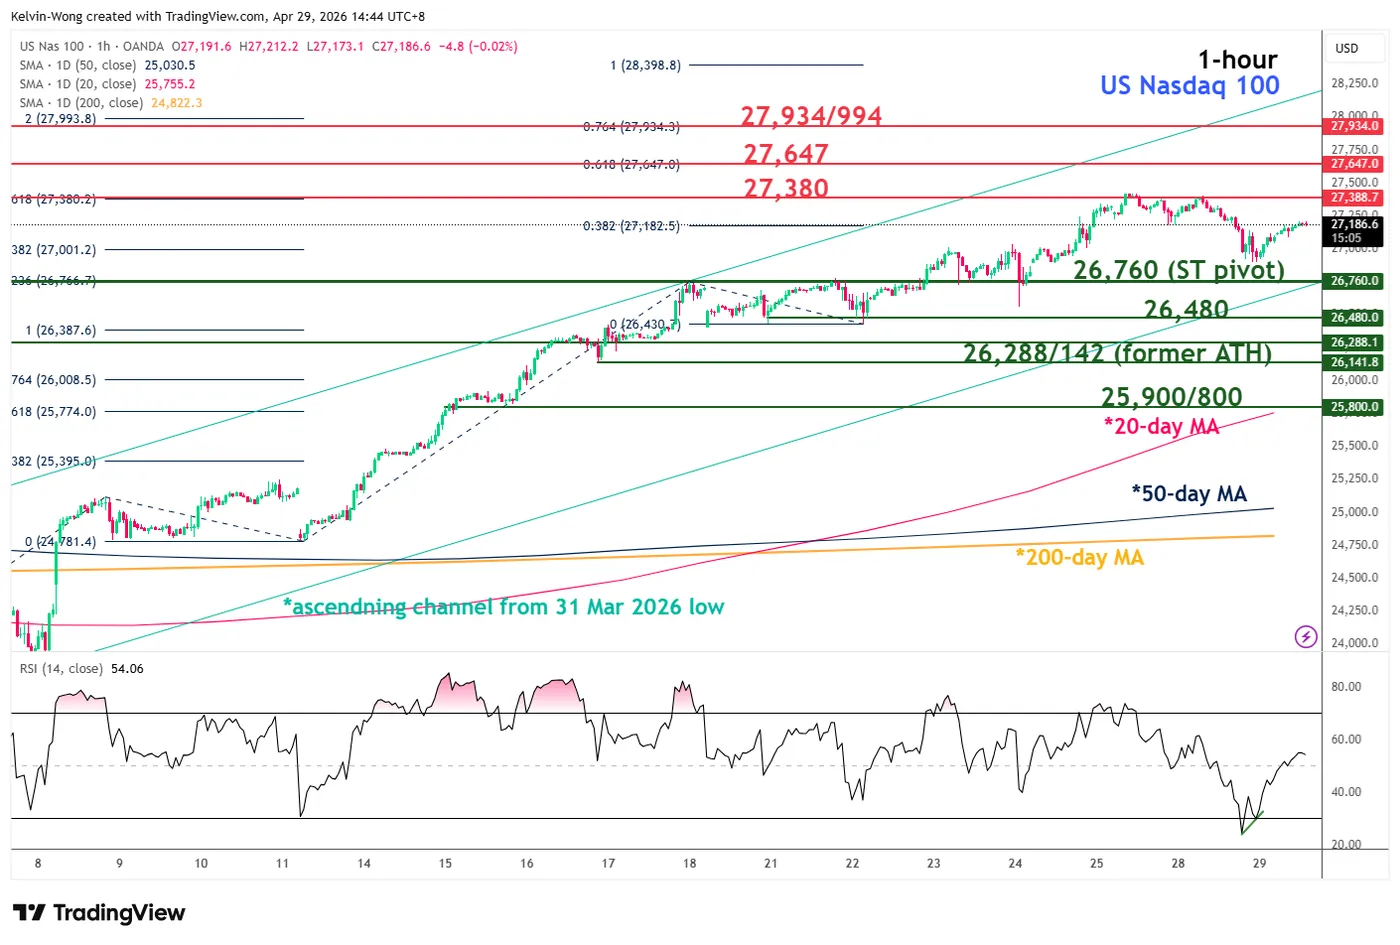
Fig. 5: US Nasdaq 100 CFD index minor trend as of 29 Apr 2026 (Source: TradingView).
Watch the 26,760 key short-term pivotal support on the US Nasdaq 100 CFD index (a proxy of the Nasdaq 100 E-mini futures), and a clearance above 27,380 opens scope for the next intermediate resistances to come in at 27,647 and 27,934/27,994 (Fibonacci extension cluster) in the first step (see Fig. 5).
However, a violation and an hourly close below 26,760 invalidates the intraday bullish scenario for a minor corrective decline to expose the next intermediate supports at 26,480 and 26,288/26,142.
Key elements to support the near-term bullish bias on the Nasdaq 100
- The hourly RSI momentum indicator flashed out a bullish divergence condition on Tuesday, 28 April 2026, after it reached its oversold region (below the 30 level).
- Elliot Wave Theory suggests the minor bullish impulsive wave three structure from the 2 April 2026 low of 23,511 remains intact.
- The 26,760 key short-term pivotal support confluences with the lower boundary of the ascending channel from the 31 March 2026 low.
S&P 500 Futures (ES) Elliott Wave Outlook: Cycle from March 31 Low Nearing End
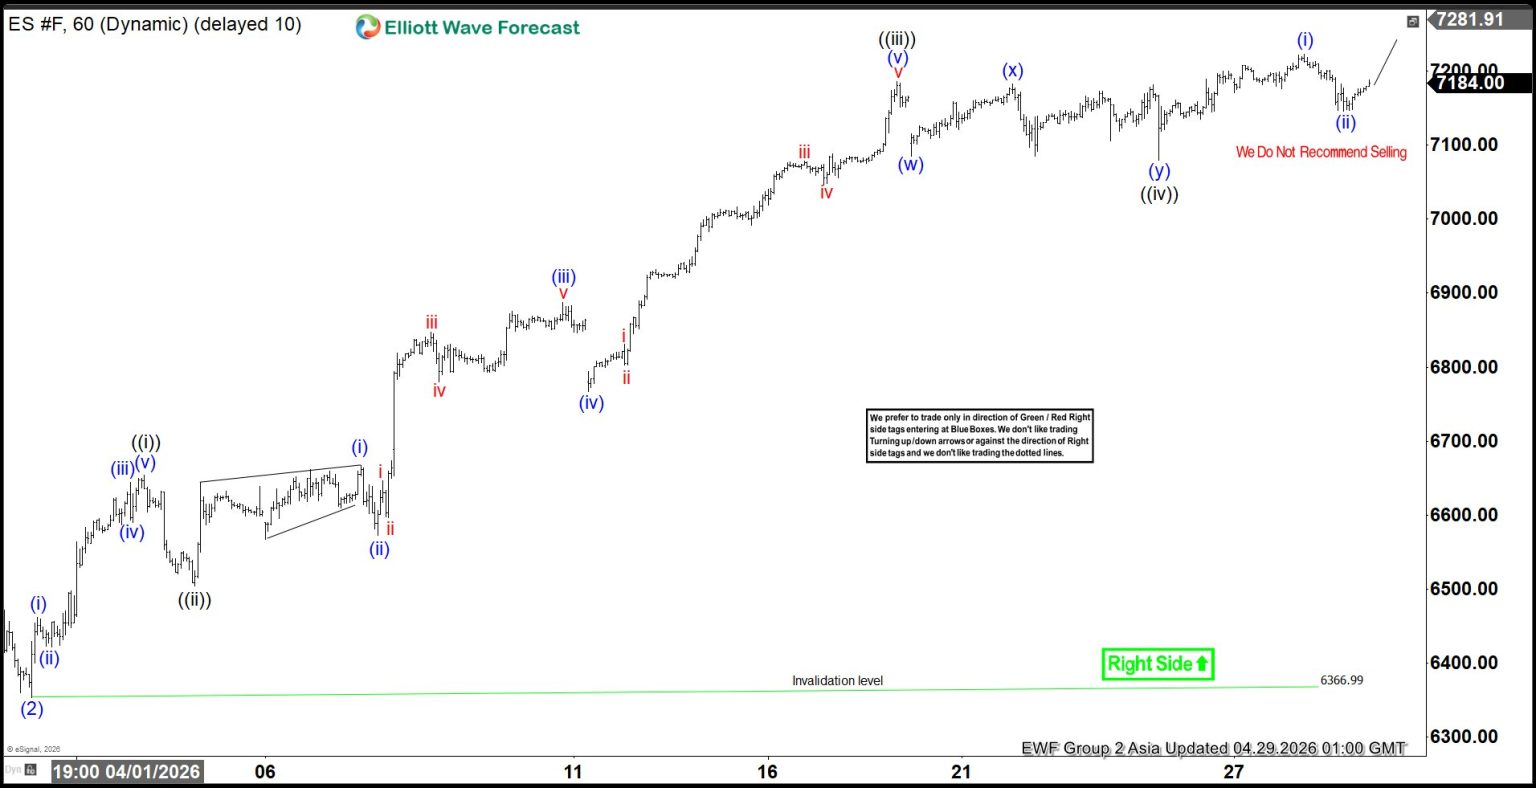
The S&P 500 E-Mini Futures (ES) have concluded a corrective phase against the cycle from the April 2025 low at 6367. This decline has been identified as wave (2). Following the completion of this pullback, the market resumed its upward trajectory in wave (3), breaking decisively above the prior peak of wave (1) at 7036.25. This breakout has established a bullish sequence and confirmed that the next leg higher has commenced.
From the termination of wave (2), the advance unfolded with wave ((i)) ending at 6653.75. A subsequent retracement in wave ((ii)) found support at 6503.75. The index then accelerated higher in wave ((iii)), reaching 7185.75. Afterward, a modest pullback in wave ((iv)) concluded at 7079.25. The structure now points toward further extension in wave ((v)), which should complete wave 1 of a higher degree.
Once wave 1 finishes, the market is expected to undergo a corrective phase in wave 2. This retracement will adjust the cycle from the March 31, 2026 low before the broader uptrend resumes. In the near term, as long as the pivot at 6367 remains intact, pullbacks are likely to attract buyers. These corrections should unfold in either three or seven swings, offering opportunities for continuation to the upside.
S&P 500 E-Mini Futures (ES) 60-Minute Elliott Wave Chart
ES Elliott Wave Video:
https://www.youtube.com/watch?v=fREC8-nOIvI
GBP/JPY Daily Outlook
Daily Pivots: (S1) 215.16; (P) 215.54; (R1) 216.15; More...
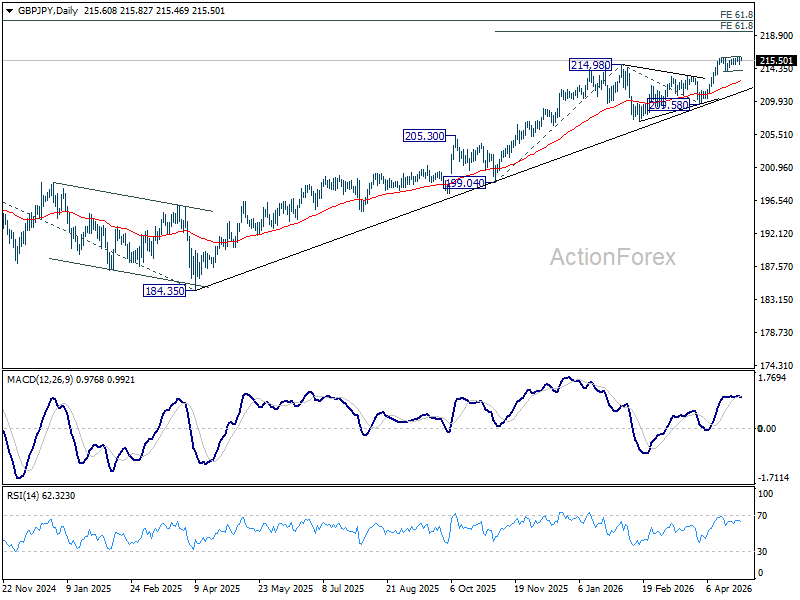
Intraday bias in GBP/JPY stays neutral and more consolidations could be seen. Further rise is expected as long as 213.94 r support holds. On the upside, firm break of 216.04 will resume larger up trend to 61.8% projection of 199.04 to 214.98 from 209.58 at 219.43.
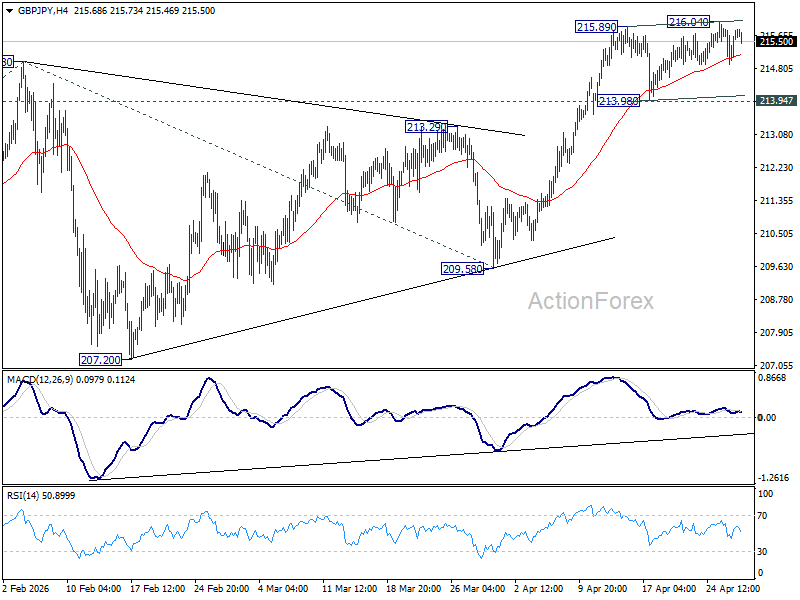
In the bigger picture, up trend from 123.94 (2020 low) is still in progress. Firm break of 214.98 will target 61.8% projection of 148.93 (2022 low) to 208.09 (2024 high) from 184.35 at 220.90. This will remain the favored case as long as 55 W EMA (now at 205.25) holds, even in case of another deep pullback.
EUR/JPY Daily Outlook
Daily Pivots: (S1) 186.33; (P) 186.70; (R1) 187.33; More...
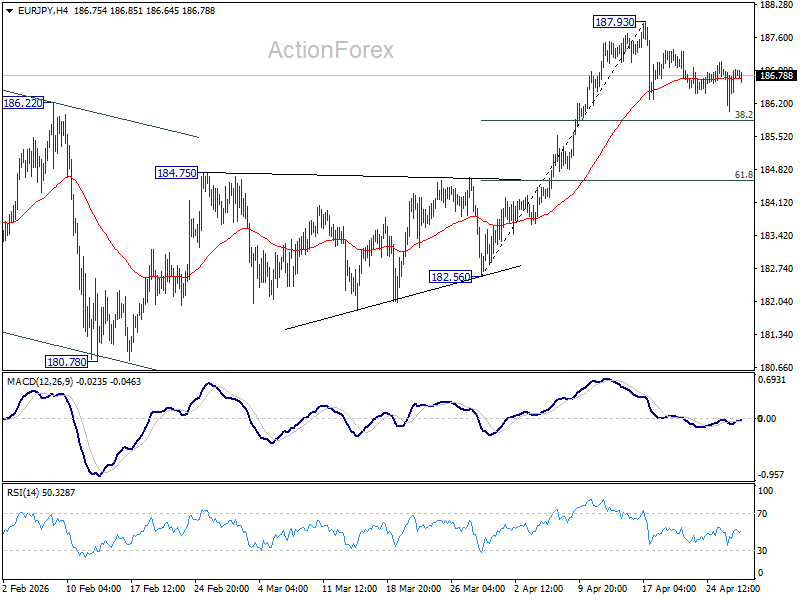
No change in EUR/JPY's outlook as consolidation from 187.93 is extending. Intraday bias stays neutral. Strong support is expected from 38.2% retracement of 182.56 to 187.93 at 185.87 to bring rebound. On the upside, firm break of 187.93 will resume larger up trend. However, further break of 185.87 will bring deeper fall to 184.75 resistance turned support instead.
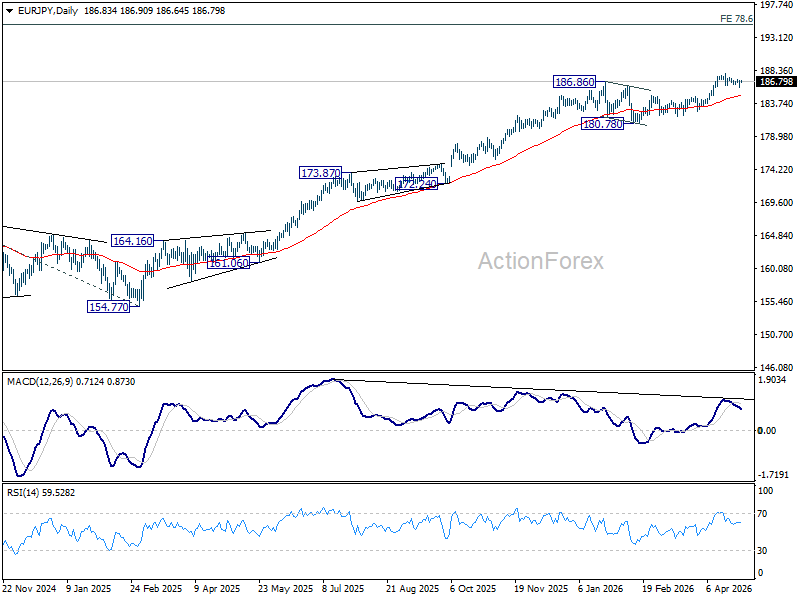
In the bigger picture, up trend from 114.42 (2020 low) is in progress. Next target is 78.6% projection of 124.37 (2022 low) to 175.41 (2025 high) from 154.77 at 194.88 next. For now, medium term outlook will stay bullish as long as 180.78 support holds, even in case of deeper pullback.
EUR/GBP Daily Outlook
Daily Pivots: (S1) 0.8652; (P) 0.8667; (R1) 0.8679; More…
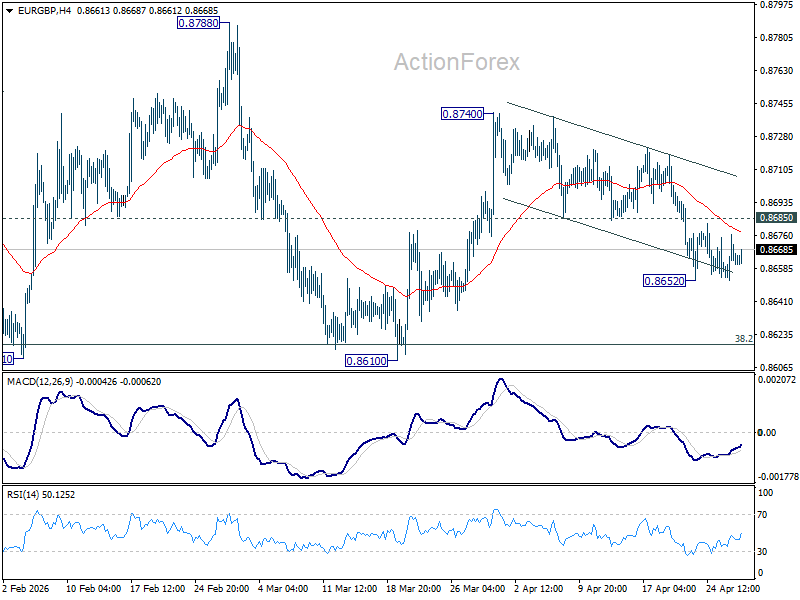
Range trading continues in EUR/GBP and intraday bias stays neutral. Further fall is expected with 0.8685 support turned resistance intact. On the downside, below 0.8652 will resume the fall from 0.8740 to retest 0.8610 support next. Nevertheless, firm break of 0.8685 will dampen the bearish view and turn bias back to the upside for 0.8740 again.
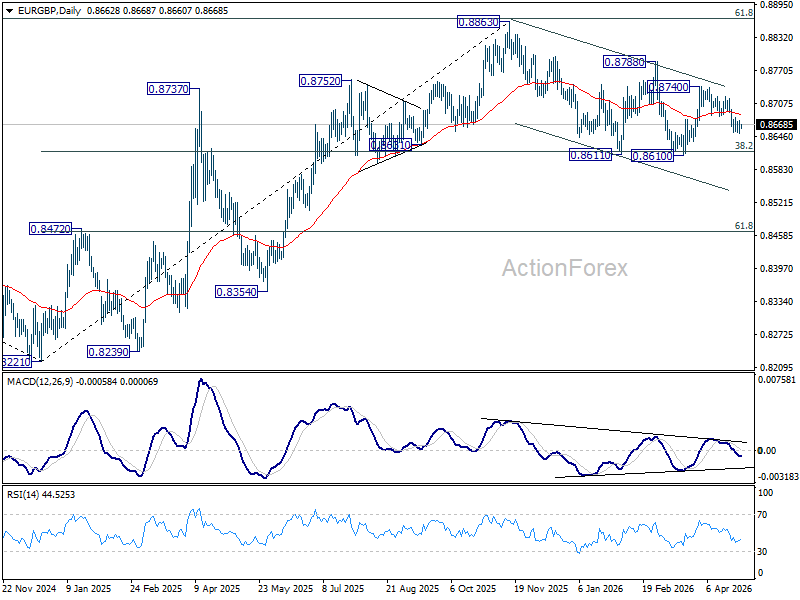
In the bigger picture, strong support was seen again from 38.2% retracement of 0.8821 to 0.8863 at 0.8618. Break of 0.8788 resistance will argue that larger rise from 0.8221 might be ready to resume through 0.8863 (2025 high). Nevertheless, sustained trading below 0.8618 should confirm bearish reversal, and bring deeper fall to 61.8% retracement at 0.8466 at least.
EUR/AUD Daily Outlook
Daily Pivots: (S1) 1.6284; (P) 1.6314; (R1) 1.6340; More...
Despite loss of downside momentum as seen in 4H MACD, further fall is expected in EUR/AUD with 1.6418 resistance intact. Retest of 1.6126 low should be seen next. Firm break there will resume larger down trend from 1.8554. However, firm break of 1.6418 will indicate short term bottoming, and turn bias back to the upside for stronger rebound instead.
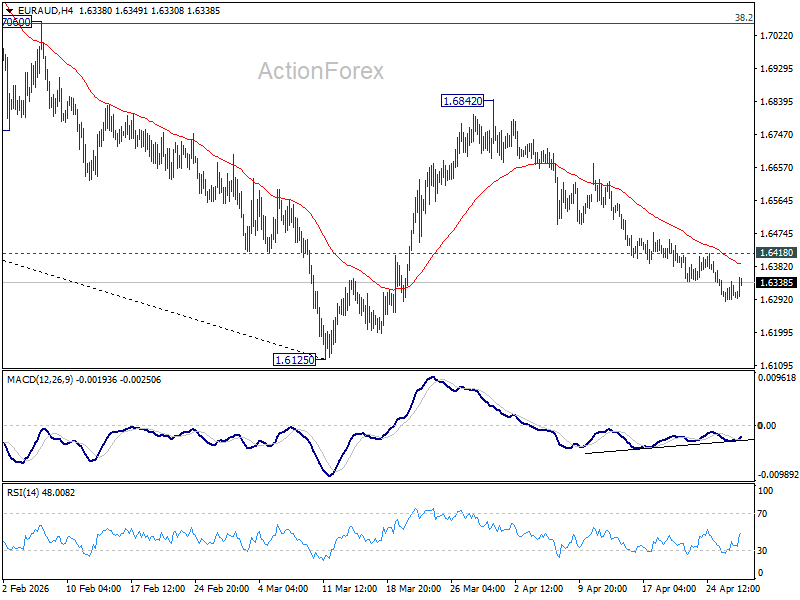
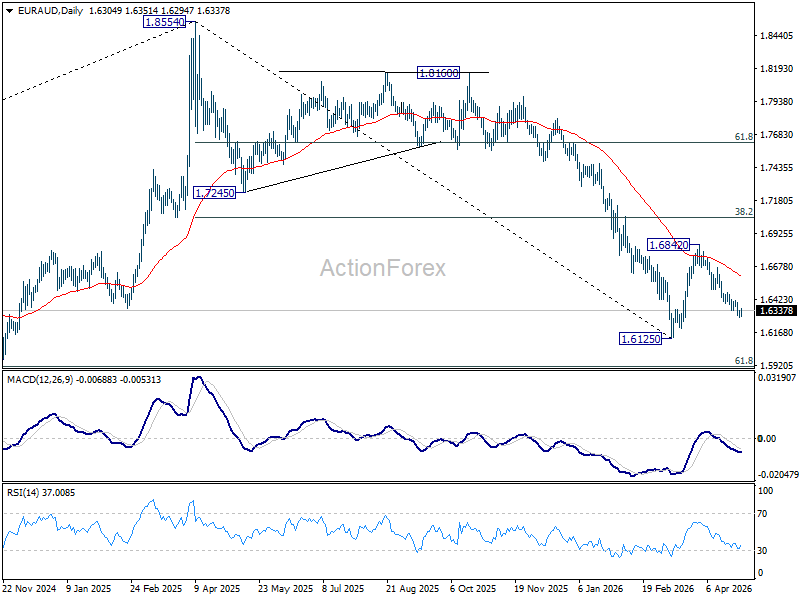
In the bigger picture, fall from 1.8554 (2025 high) is in progress and deeper decline should be seen to 61.8% retracement of 1.4281 to 1.8554 at 1.5913, which is slightly below 1.5963 structural support. Decisive break there will pave the way back to 1.4281 (2022 low). For now, risk will stay on the downside as long as 55 W EMA (now at 1.7129) holds, even in case of strong rebound.
EUR/CHF Daily Outlook
Daily Pivots: (S1) 0.9211; (P) 0.9231; (R1) 0.9266; More....
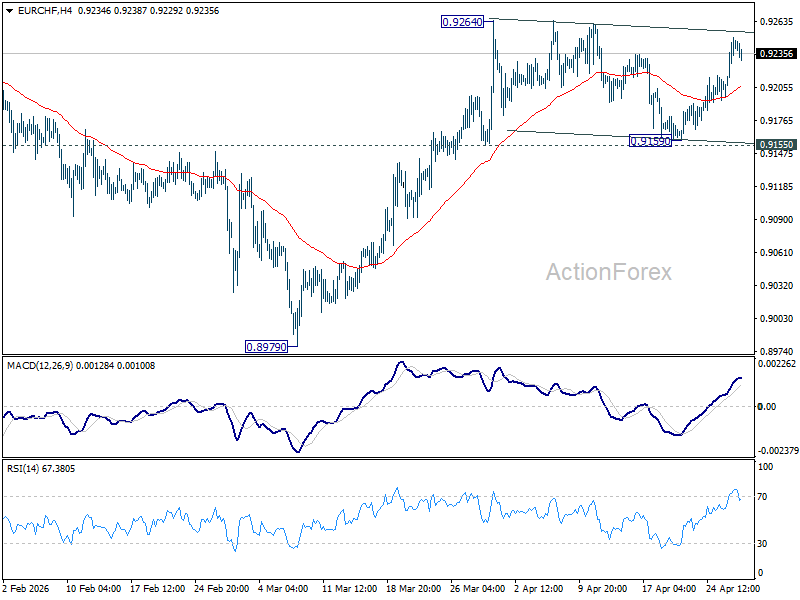
While EUR/CHF's rebound was strong, it's still capped below 0.9264 resistance. Intraday bias remains neutral and more consolidations could be seen. But still, further rise is expected with 0.9155 support intact. On the upside, firm break of 0.9264 will resume the rise from 0.8979 to 0.9394 resistance next. However, break of 0.9155 will turn bias back to the downside for deeper pullback.
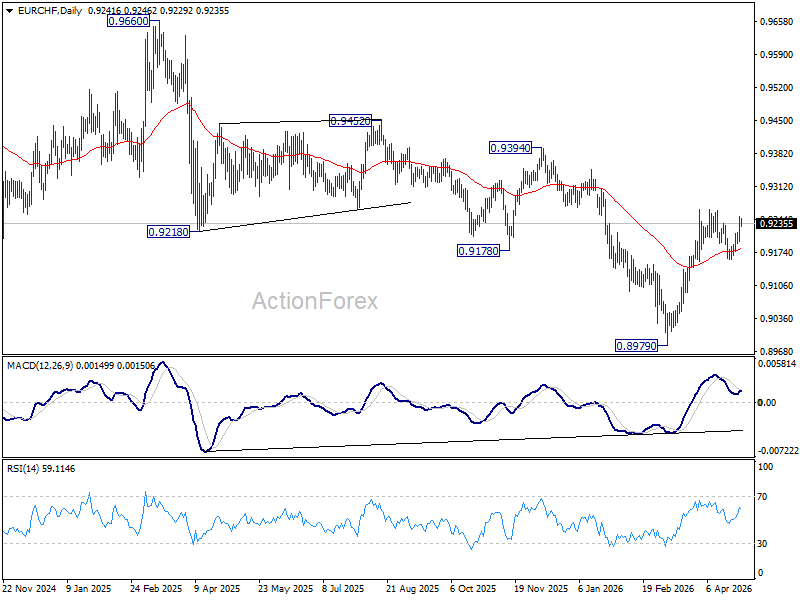
In the bigger picture, considering bullish convergence condition in W MACD, a medium term bottom should be in place at 0.8979. Sustained trading above 55 W EMA (now at 0.9277) will add more credence to this case. Further break of 0.9394 resistance will pave the way to 0.9660 resistance next. However rejection by the 55 W EMA will set up another fall through 0.8979 low at a later stage.
Fed Widely Expected to Stick to a (Modestly Hawkish) Hold
Markets
Core bond yields yesterday staged a further (forceful) bear steepening heading into the Fed, BoC, BoE and ECB policy meetings scheduled today and tomorrow. Markets are growing ever more convinced that a prolonged stalemate in the US-Iran conflict, including blockage of the Strait of Hormuz, will inevitably have lasting consequences for multiple supply chains. Most recent communication from the parties involved suggests that both of them consider themselves to be in a position not to be forced into concessions. In this respect, the WSJ reported that US President Trump told aides to prepare for an extended blockade of Hormuz. Brent oil ‘settles’ north of $110/b. The UAE announcing to leave the OPEC cartel didn’t help much. Turning to Europe, the ECB’s consumer expectations survey (March) showed citizens preparing/fearing a new, sharp and extended rise in global price levels. Inflation expectations for the next 12 months jumped from 2.5% to 4%. Three year ahead expectations also rose way more than expected to 3%. Combined with a strong stagflation message from last week’s PMI’s, this for sure won’t pass unnoticed at the ECB as it prepares the communication on its reaction function at tomorrow’s policy meeting. German yields added between 7.8 bps (2-y) and 1.2 bps (30-y). Consecutive steps in June (100%) and July (75%) are now seen as highly likely as is a third one by year-end. The ‘extreme’ positioning of end March/early April is again within reach. US pricing again was more modest with the 2-y adding 3.9 bps and the 30-y ceding 1.2 bps. The BoE is also under pressure to give a clear anti-inflationary commitment with the 10-y gilt yield surpassing 5%. The direct spill-over to other markets again was modest/orderly. Equities in the US lost up to 0.9% (Nasdaq). The Eurostoxx 50 ceded 0.41%.The dollar also profited only modestly from the oil ascent (DXY 98.64; EUR/USD 1.171). The yen underperformed as the BoJ failed to give a hard commitment on further policy normalization (USD/JPY 159.6).
Despite the turbulent global context, the Fed is widely expected to stick to a (modestly hawkish) hold today. Labour market and other US activity data over the previous six weeks were strong enough for the Fed to reconfirm that they can hold the policy rate at a tentatively restrictive level for some time to come. The main focus at the press conference probably will go to whether Powell will stay in the FOMC after his term as Fed chair ends mid-May. In Europe, the focus will stay on the next batch of (April) national inflation data (Spain, Germany, Belgium) as the impact of the conflict in the Middle East is filtering through to end prices. Even if this pass-through to official CPI data might be a bit different/delayed across individual countries, the trend probably won’t provide much comfort for ECB policymakers. We assume little market correction on the recent rebound in (European) yields as long as the stalemate in the Middle East persists and oil holds near current (or higher) levels. For (US) equities, Q1 earnings from bellwethers (Alphabet, Microsoft, Meta Platforms and Amazon) should ‘justify’ the recent tech rally.
News & Views
Australian CPI in Q1 accelerated to a consensus-matching 1.4% Q/Q and 4.1% Y/Y well above the RBA 2-3% target band. Core measures came in close to expectations, varying between 3.3% and 3.5%. The monthly March print showed a material quickening to 1.1% m/m (flat in Febr) reflecting the initial energy impact of the Iran war. The quarterly print, however, was only slightly higher than the RBA’s February projection, prior to the Middle East conflict. While much of the impact is probably yet to come, markets were bracing for a bigger inflationary shock already. It’s causing a bull steepening move in the Australian swap yield curve with changes amounting to up to -11 bps at the front end. The market implied probability for a third consecutive rate hike in May fell from around 80% to less than 70%. AUD/USD is trading around 0.716 compared to the multiyear highs of 0.72 in the days before.
Hungary’s incoming prime minister Magyar and the European Commission are negotiating to salvage some €10bn in pandemic funding that would otherwise be lost beyond an August deadline. The money is part of a total of more than €20bn in frozen resources over rule of law concerns during the Orban administration. Hungary would need to implement a slew of anti-corruption measures and judicial independence in order to regain access. That can happen fairly quickly because of Tisza’s supermajority. But for the €10bn in focus, the country also needs to present shovel-ready projects in a rewritten Recovery and Resilience Plan to claim the money. The remaining three months to do so is very tight. Some of the options being discussed include bringing forward projects currently allocated to other European programs with more distant expiry dates, Bloomberg reported citing an official, or use some of the available funds to increase the capital of its state investment bank, similar to what for example Spain has done. Those steps would salvage the funding while letting it be spent over a longer period of time.