Sample Category Title
Euro Falls to Four-Week Low: Politicians to Blame
EUR/USD plummeted below 1.0800 and is currently hovering around 1.0796 on Monday morning. This development came amid heightened political tensions in France. President Emmanuel Macron called for early elections on Sunday in the wake of his party's crushing defeat and Marine Le Pen's party's resounding victory in the European Parliament elections. The far-right, which secured twice as many votes as its closest competitors, has won and now has significant influence in France. The defeat of the country's pro-presidential forces has profoundly impacted the euro's position.
Furthermore, the euro was also under pressure from the US dollar ahead of this week's Federal Reserve meeting. Robust employment statistics in the US for May had already led the market to lower its expectations of a Fed interest rate cut.
Last week, the European Central Bank lowered its interest rate for the first time in five years. However, it is adopting an overly cautious stance on further rate cuts. In its comments, the ECB acknowledged the continued price pressures and projected that inflation will exceed targets this year and next. The regulator is refraining from making any specific commitments on a clear rate trajectory, indicating that all future ECB actions will have to be based on incoming statistics one way or another.
Technical analysis of EUR/USD
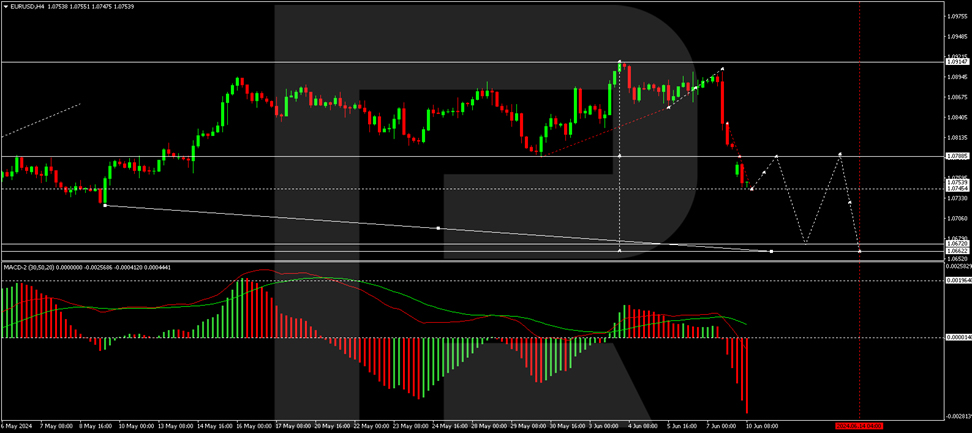
On the H4 chart of EUR/USD, the market completed the correction at 1.0901 and started the development of a new wave of decline. The downward impulse to the level of 1.0835 is fulfilled at the moment. A consolidation range around this level was formed, and the structure of the wave to 1.0747 was worked out with a downward exit. Today, we will consider the probability of a decline to 1.0735. After working off this level, the growth link to 1.0785 (test from below) is possible, with a further decline to 1.0672, representing the local target. Technically, this scenario is confirmed by the MACD indicator, whose signal line is below zero and is directed strictly downwards.
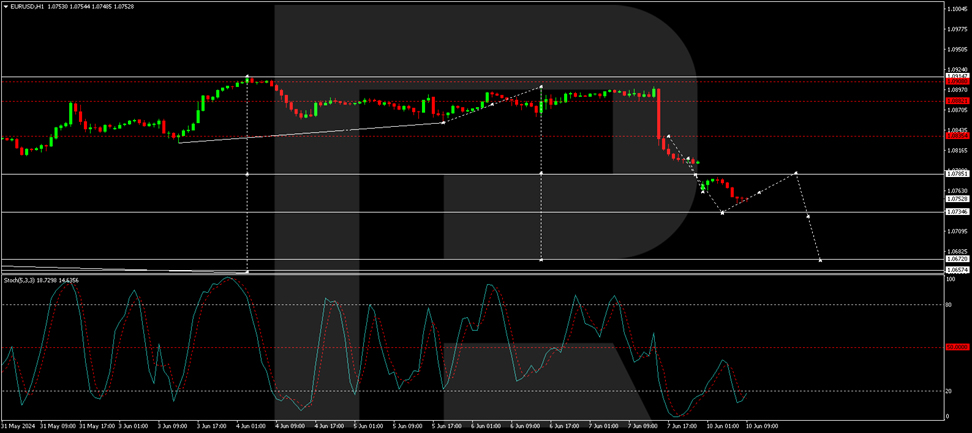
On the H1 EUR/USD chart, the market continues to develop a structure of decline to 1.0734. After working off this level, a correction to 1.0785 is possible. Further, we will consider the probability of a decline to 1.0672, the first target of the downward trend. Technically, this scenario is confirmed by the Stochastic oscillator, whose signal line is under the level of 20. We expect the beginning of growth to the level of 50.
US Dollar Index: Continues to Fly on Growing Expectations
Dollar continues to fly on growing expectations that the Fed will stay in higher for longer rate mode
The dollar index extends strong rally on Monday, after advancing 0.8% on Friday and started the week with gap higher opening.
Upbeat May NFP numbers on Friday added to hawkish stance and signal that the Fed may keep its higher for longer rate policy, which revived bulls and lifted the greenback sharply.
Markets focus on Wednesday’s release of US May CPI (y/y figure expected to remain unchanged at 3.4%) and subsequent policy decision at the end of FOMC two-day meeting, with the most interesting part to be Fed’s ‘dot plots’ projections of the path of interest rates.
Fed’s latest projection, released in March, showed expectations for three 25-basis points rate cuts until the end of the year and the main question will be how much the Fed will revise down its previous projection.
More hawkish tone from US policymakers on Wednesday will mean more support for the greenback.
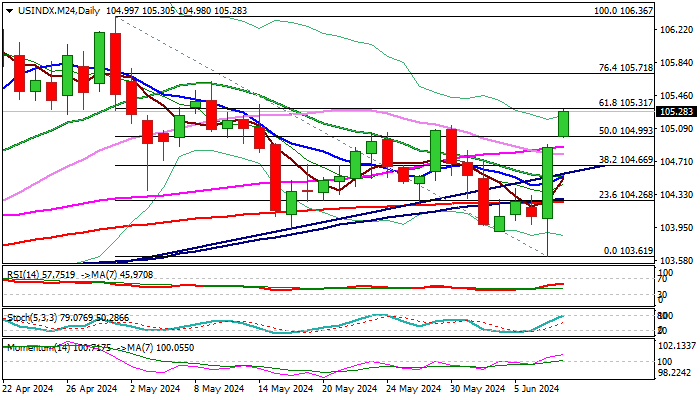
Fresh bullish acceleration from Friday’s multi-week low (103.61) has already retraced almost 61.8% of larger 106.36/103.61 downtrend, turning technical picture on daily chart into bullish mode and shifting near-term focus to the upside.
Break above the top of thick daily Ichimoku cloud (105.18) generated bullish signal (which requires confirmation od daily close above the cloud) and adds to improved technical picture (14-d momentum broke into positive territory and MA’s turned to bullish setup).
Also, bear-trap on weekly chart (bull-trendline / 20WMA) underpins near-term action.
Violation of Fibo 61.8% pivot (105.31) to further strengthen bullish structure and open way towards targets at 105.71/106.00 (Fibo 76.4% / round-figure).
Corrective dips are likely to be limited (ideally to be contained by broken 55DMA at 104.88 and not to exceed trendline support at 104.61) to keep bulls in play.
Res: 105.31; 105.62; 105.71; 106.00.
Sup: 105.18; 104.98; 104.61; 104.46.
Gold Could Be Poised for a Continuation Lower
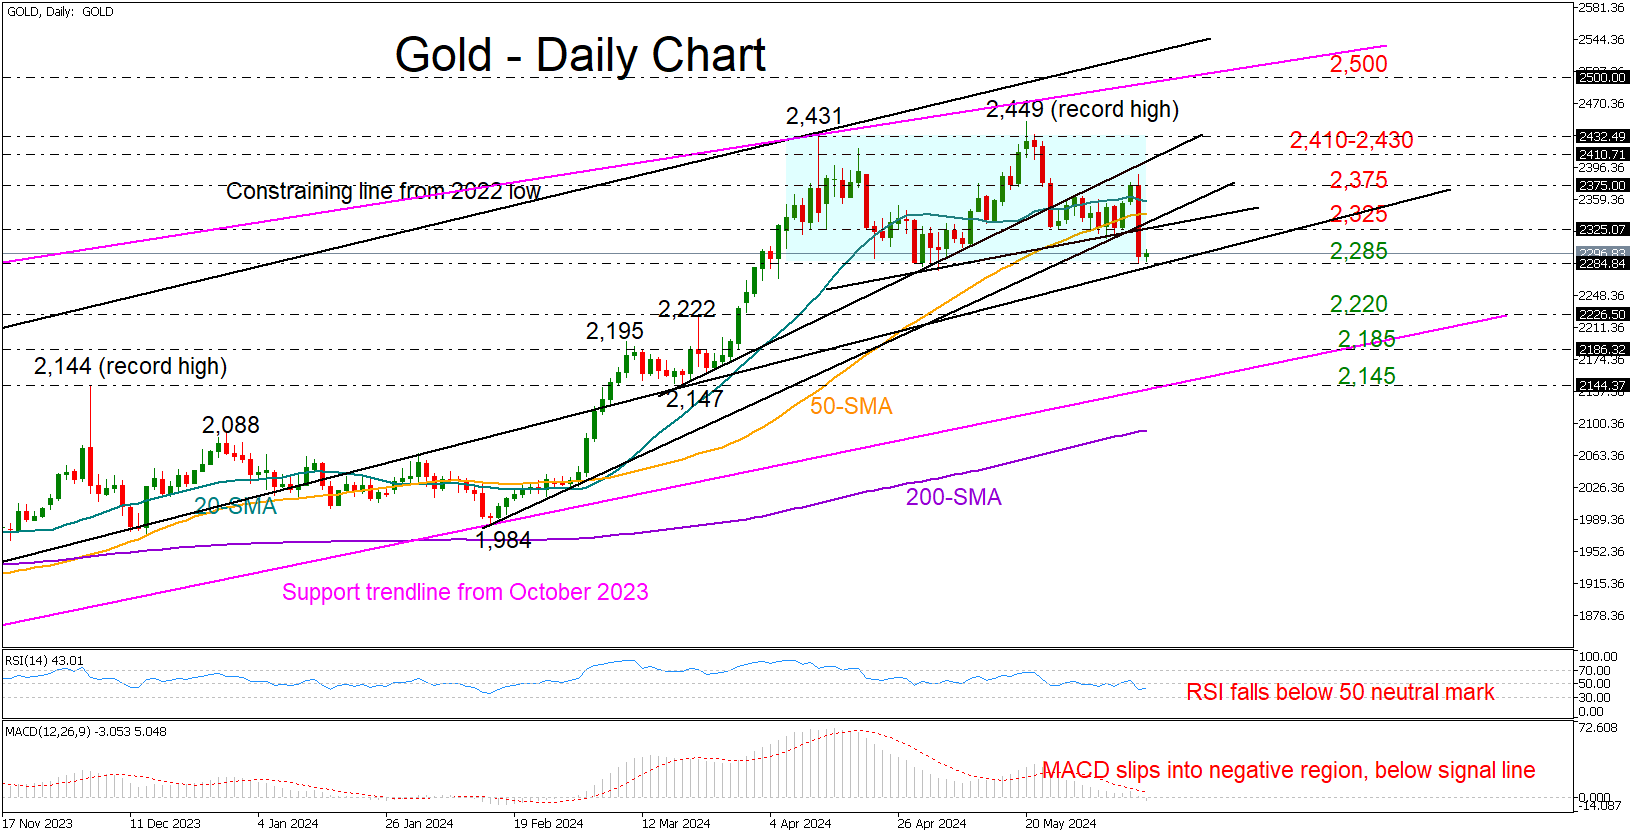
- Gold violates bullish structure; prints a head and shoulders pattern
- Short-term risk is negative; confirmation signal awaited below 2,285
Gold has stabilized near May’s floor of 2,285 after losing more than 3.0% on Friday to mark its biggest daily loss in two years.
The price’s current lackluster performance indicates a probable bearish continuation, given its drop below the 20- and 50-day SMAs and beneath the significant trendline zone at 2,325. The technical indicators align with this narrative, as the RSI has dipped below its 50 neutral mark and the MACD has slipped below its zero line.
In the event that the 2,285 base crumbles, validating a bearish head and shoulders formation, selling momentum could escalate towards the 2,220 level. Falling lower, the price might retest the former constraining zone of 2,185 before plunging towards the ascending trendline, which connects the 2023 and 2024 lows at 2,145.
If the bulls resurface, they might encounter a new challenge in the caution zone between 2,325 and 2,375. A decisive close above this bar could be a prerequisite for a rally back to the 2,410-2,430 zone. A victory there could lift the price as high as 2,500.
Summing up, the bears seem to be taking the lead in the gold market, with support expected to come next around the 2,220 number.
Headwinds Knocked Down Bitcoin & Ethereum
Market picture
The crypto market is losing about 4.5% from its peak on Friday, having reversed to the downside after news positive for the dollar. Another batch of labour market figures well above expectations has raised doubts that the Fed will soon follow the ECB and Bank of Canada in cutting rates. This shift in sentiment has reduced risk appetite, hurting cryptos.
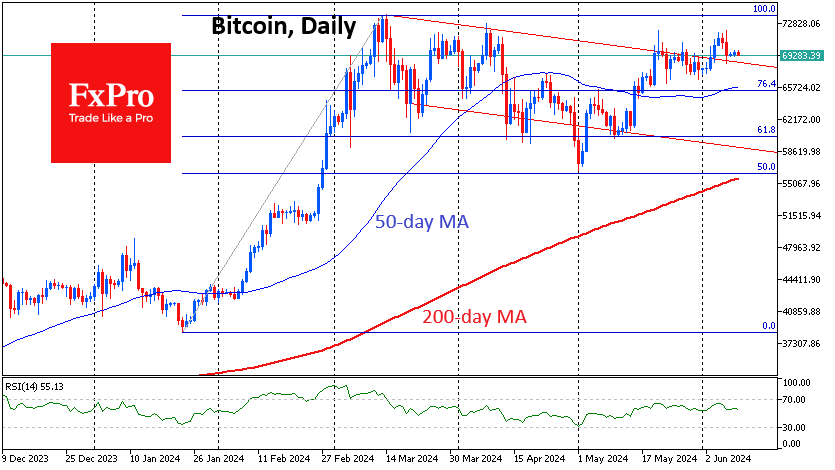
Bitcoin failed its attempt to climb above $72K on Friday, pulling back below $70K. We haven’t yet seen an acceleration of the first cryptocurrency’s rise after breaking downward resistance. On the other hand, selling is also not gaining momentum. Clearly, the cryptocurrency market remains in a state of buying on downturns. Meanwhile, headwinds such as a rising dollar and tighter monetary policy are prolonging the consolidation.
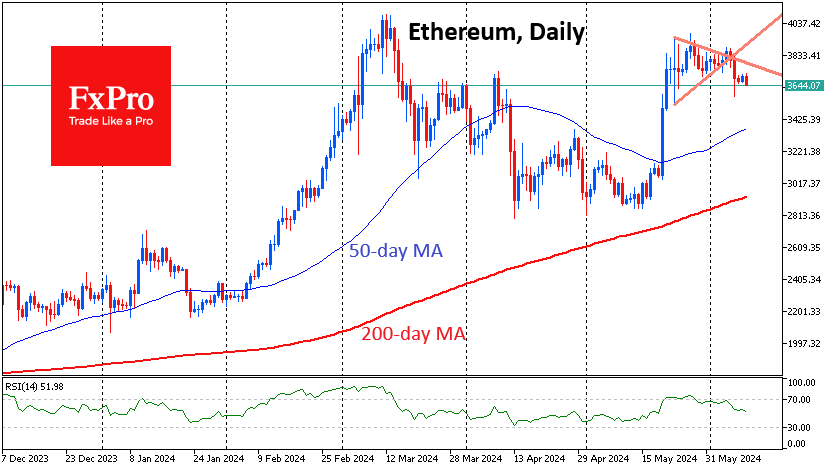
At the same time, Ethereum is sending a very worrying technical signal. Timid attempts to move up from consolidation around $3800 were replaced by a very impressive sell-off. The second-largest cryptocurrency fell below the previous local lows to $3650. The next potentially important support area could be $3300, an important pivot area from March.
News background
The number of bitcoins in IBIT, a spot ETF from BlackRock, has surpassed 300,000. The fund’s capitalisation reached $21 billion, making IBIT the leader among spot ETFs in terms of capitalisation.
The volume of open short positions on MicroStrategy shares has tripled in the last six months to $6.9 billion. Shorts are counting on a correction after the company’s capitalisation jumped 5.5 times in the last year. MicroStrategy owns 214,400 BTC worth approximately $15.25bn.
Ex-CEO of BitMEX Arthur Hayes called for buying bitcoin (and later altcoins) because the rate cut cycle is starting. Last week, the ECB and Bank of Canada lowered their key rates by 25 bps. According to him, “Crypto bulls are waking up and are about to start tearing the skins off profligate central bankers.”
According to PeckShield, hackers stole at least $575 million in May, with damage from hacking attempts in the first quarter up 42 per cent compared to the first quarter of 2023. Attackers are giving up on finding vulnerabilities in smart contracts and are focusing on phishing attacks and stealing users’ private keys.
Ripple CTO David Schwartz warned of a new wave of scams using phishing links to steal XRP holders’ personal data.
Donald Trump declared his intention to become a cryptocurrency president and criticised Democrats’ attempts to regulate the industry.
Eurozone Sentix rises to 0.3, recovery continues but lacks momentum
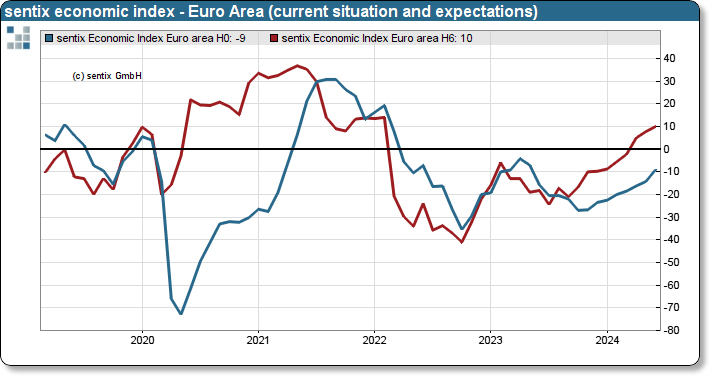
In June, Eurozone Sentix Investor Confidence improved to 0.3 from -3.6, exceeding the expected -1.9. This marks the eighth consecutive monthly increase and the highest reading since February 2022. Current Situation Index also rose for the eighth month in a row, reaching -9.0 from -14.3, its highest level since May 2023. Similarly, Expectations Index increased to 10.0 from 7.8, the ninth consecutive rise and the highest since February 2022.
Sentix commented that while the recovery is ongoing, the "upswing lacks momentum". The increase in expectations offers some optimism that this positive trend could continue in the coming weeks. However, a stronger signal from Germany's economy is needed to boost this momentum, which has yet to emerge.
The slow pace of improvement in the current situation supports the case for ECB to consider further interest rate cuts. Nonetheless, the opportunity for such cuts appears limited. Sentix inflation barometer indicates an unfavorable inflation environment, putting additional pressure on ECB.
EUR/CHF Daily Outlook
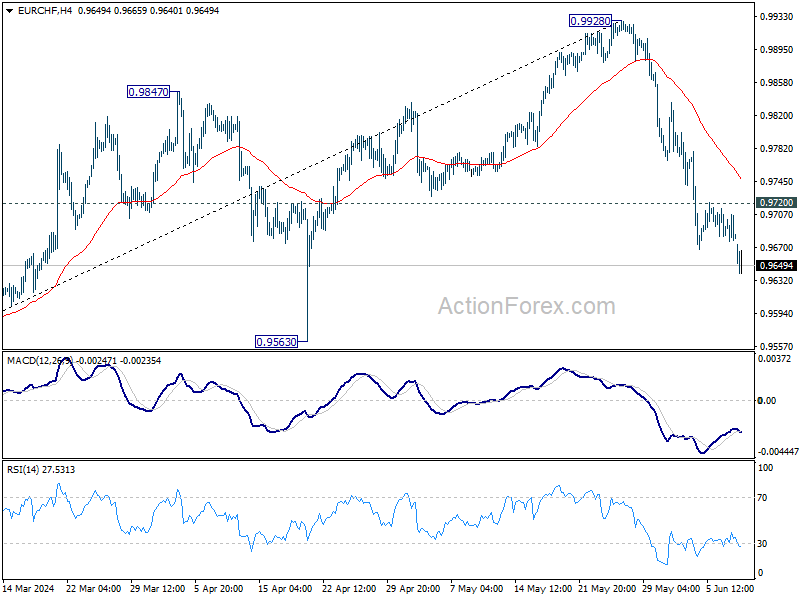
Daily Pivots: (S1) 0.9670; (P) 0.9693; (R1) 0.9708; More....
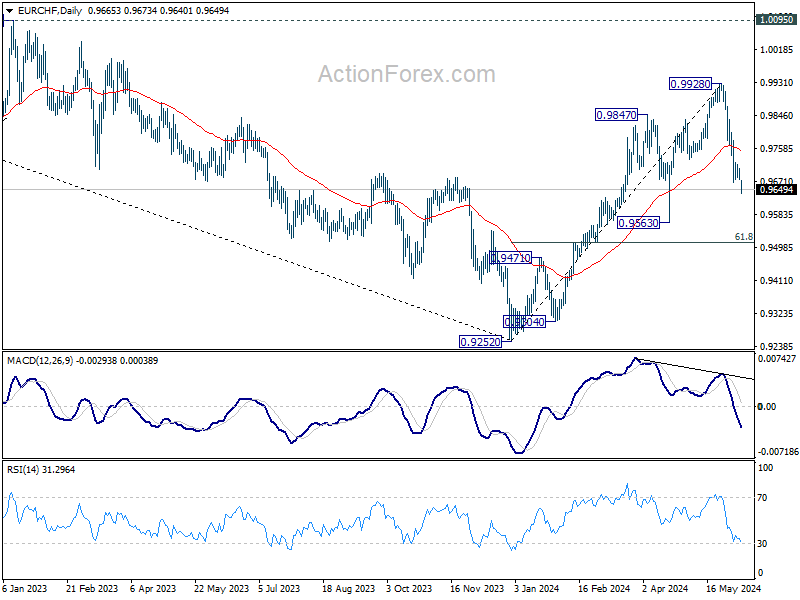
EUR/CHF's fall from 0.9928 resumed today and intraday bias is back on the downside for 0.9563 support. Decisive break there will argue that whole rise from 0.9252 has completed, and bring deeper fall to 61.8% retracement of 0.9252 to 0.9928 at 0.9510. On the upside, above 0.9720 minor resistance will turn intraday bias neutral again first.
In the bigger picture, as long as 0.9563 support holds, rise from 0.9252 medium term bottom is still in favor to continue. Next target is 38.2% retracement of 1.2004 (2018 high) to 0.9252 (2023 low) at 1.0303, even just as a correction to the down trend from 1.2004. However, firm break of 0.9563 will suggest that the rally has completed and retain medium term bearishness.
EUR/GBP Daily Outlook
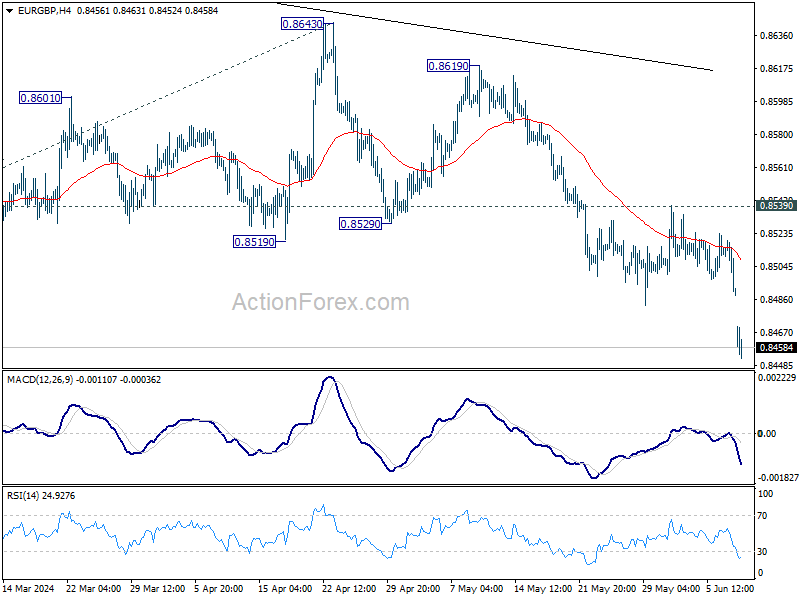
Daily Pivots: (S1) 0.8481; (P) 0.8501; (R1) 0.8512; More...
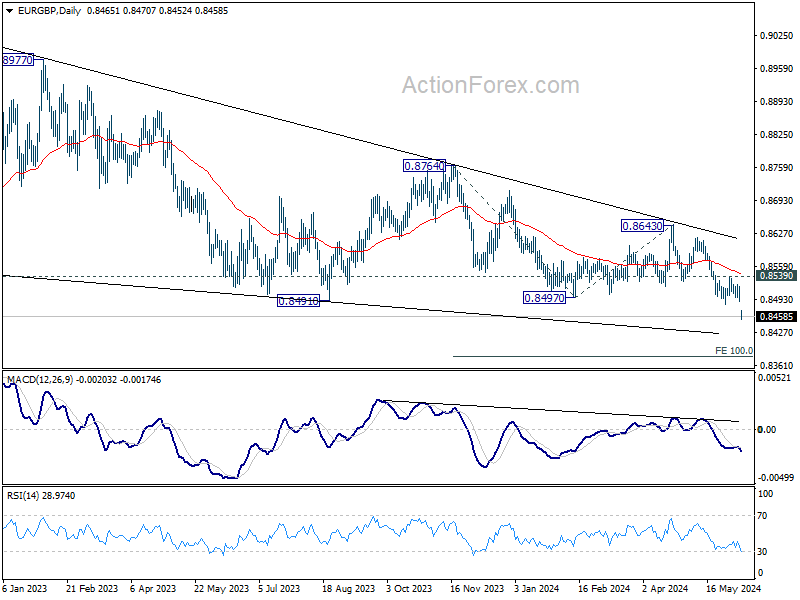
EUR/GBP's strong break of 0.8491 support confirms resumption of larger down trend. Intraday bias is back on the downside for 0.8376 projection level next. On the upside, break of 0.8539 resistance is needed to indicate short term bottoming. Otherwise, outlook will stay bearish in case of recovery.
In the bigger picture, down trend from 0.9267 (2022 high is in progress). Next target is 100% projection of 0.8764 to 0.8497 from 0.8643 at 0.8376. Sustained break there will target 161.8% projection at 0.8211 next. For now, outlook will remain bearish as long as 0.8643 resistance holds, even in case of stronger rebound.
EUR/AUD Daily Outlook
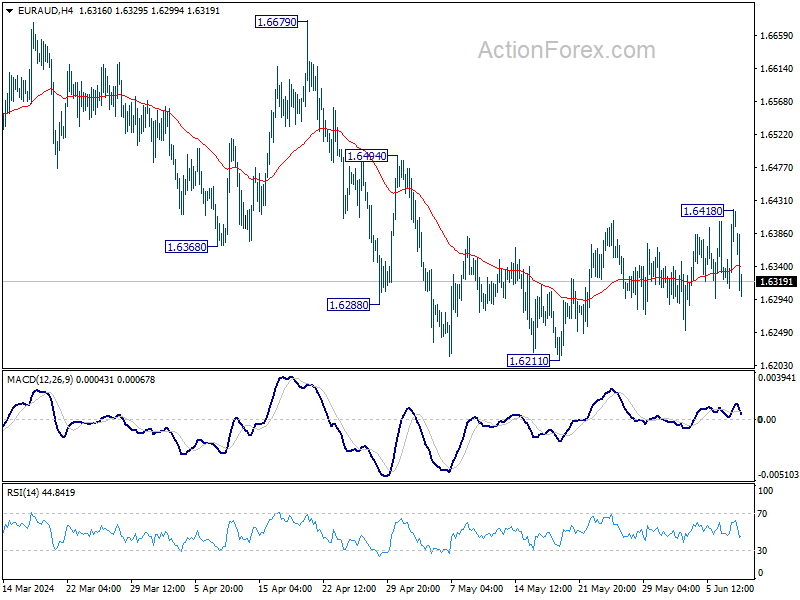
Daily Pivots: (S1) 1.6348; (P) 1.6384; (R1) 1.6458; More...
EUR/AUD retreated sharply after edging higher to 1.6418 ans intraday bias remains neutral. . On the downside, firm break of 1.6211 support will resume the whole decline from 1.6742, as the third leg of the correction from 1.7062. On the upside, sustained break of 55 D EMA (now at 1.6386) will resume the rebound from 1.6211 instead.
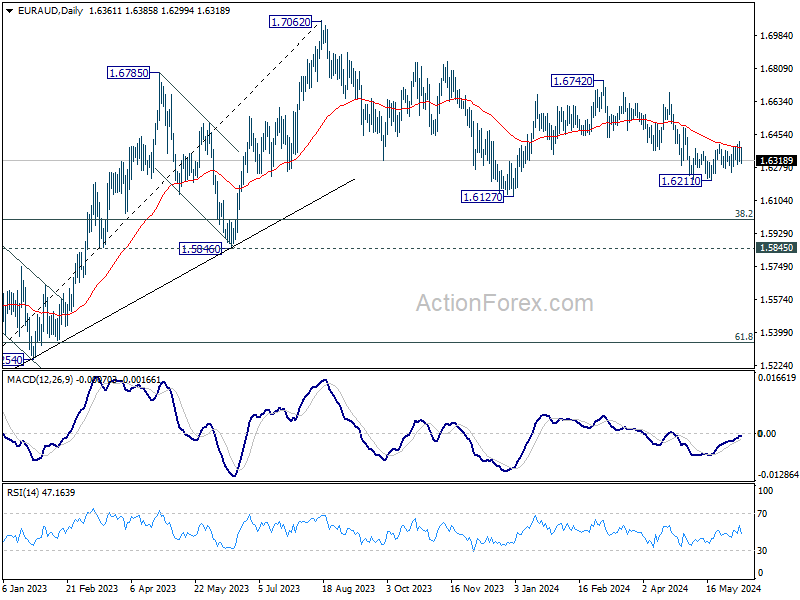
In the bigger picture, fall from 1.7062 medium term top is seen as a correction to the up trend from 1.4281 (2022 low). In case of deeper fall, strong support is expected around 1.5846 and 38.2% retracement of 1.4281 to 1.7062 at 1.6000 to bring rebound. Break of 1.7062 is in favor as a later stage.
EUR/JPY Daily Outlook
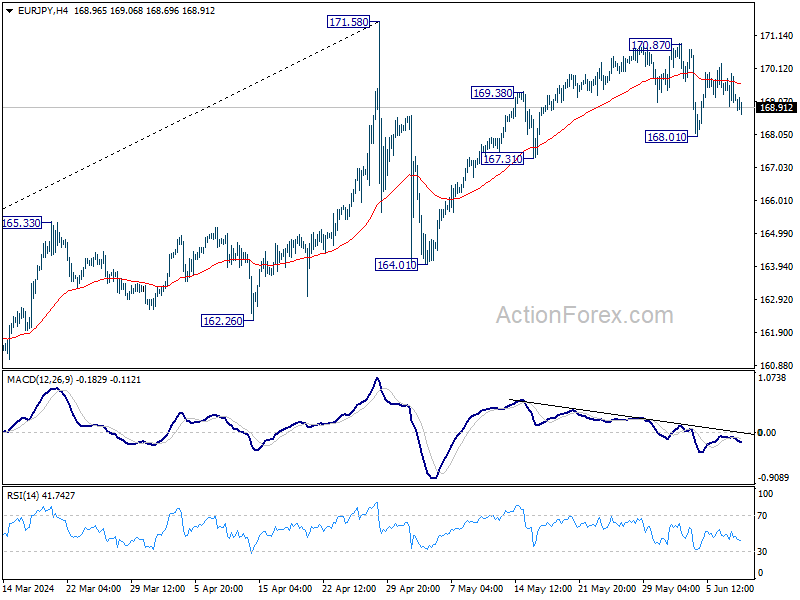
Daily Pivots: (S1) 169.14; (P) 169.79; (R1) 170.52; More...
Intraday bias in EUR/JPY remains neutral first. On the downside, break of 168.01 support will strengthen the case that rise from 164.31 has completed at 170.78 already. Intraday bias will be back on the downside for 167.31 support, and then 164.01. Nevertheless, break of 170.87 will resume the rally to retest 171.58 high instead.
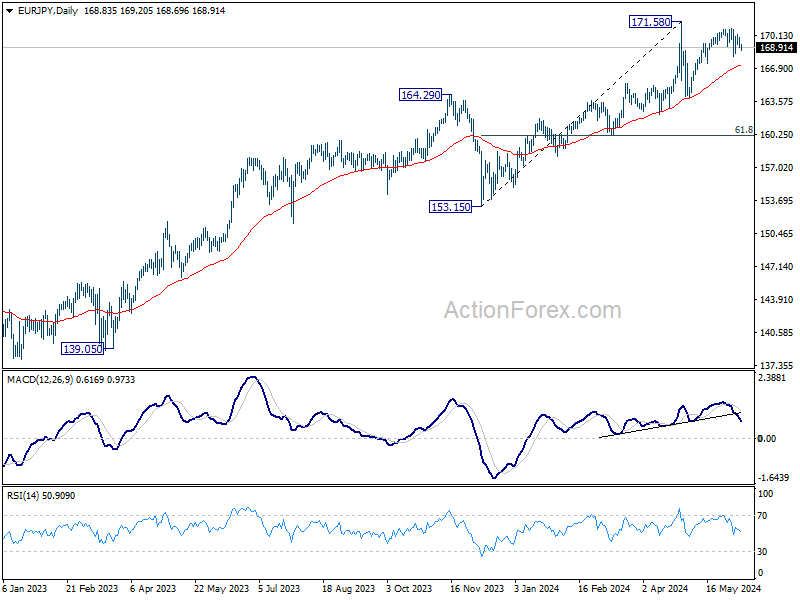
In the bigger picture, a medium top was formed at 171.58 after brief breach of 169.96 (2008 high). But as long as 55 W EMA (now at 159.51) holds, price actions from there is seen as correcting the rise from 153.15 only. That is, larger up trend remains in favor to continue. However, sustained break of 55 W EMA will argue that larger scale correction is underway and target 153.15 support.
GBP/JPY Daily Outlook
Daily Pivots: (S1) 198.59; (P) 199.20; (R1) 200.01; More...
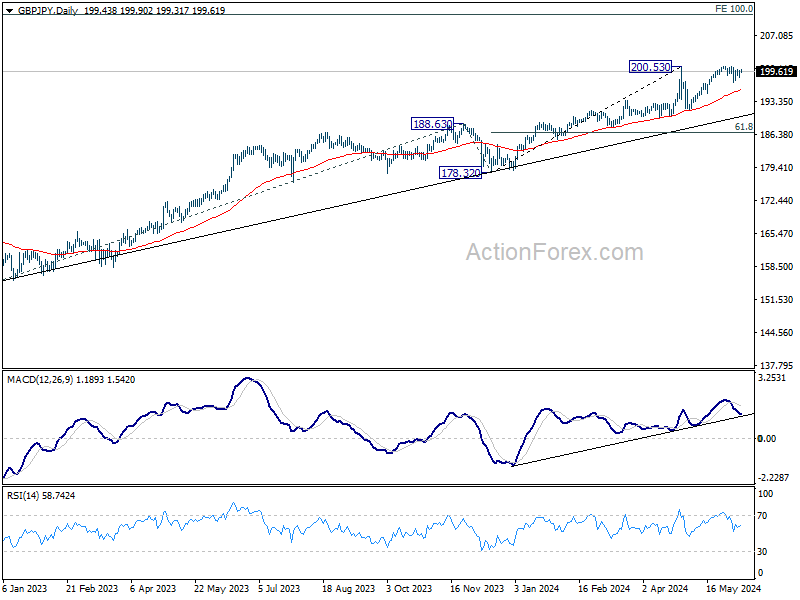
Intraday bias in GBP/JPY remains neutral for the moment. On the downside, break of 197.28 will strengthen the case that rise from 191.34 has completed. Intraday bias will be back on the downside for 195.02 support first. However, decisive break of 200.72 will resume larger uptrend instead.
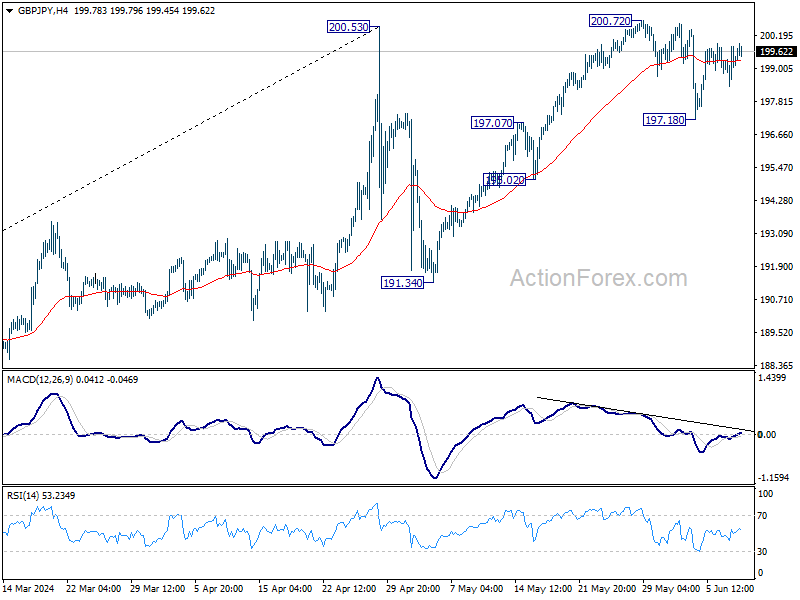
In the bigger picture, as long as 188.63 resistance turned support holds, long term up trend is expected to continue. Sustained trading above 200.53 will pave the way to 100% projection of 155.33 to 188.63 from 178.32 at 211.62.