Sample Category Title
GBP/JPY Daily Outlook
Daily Pivots: (S1) 198.59; (P) 199.20; (R1) 200.01; More...
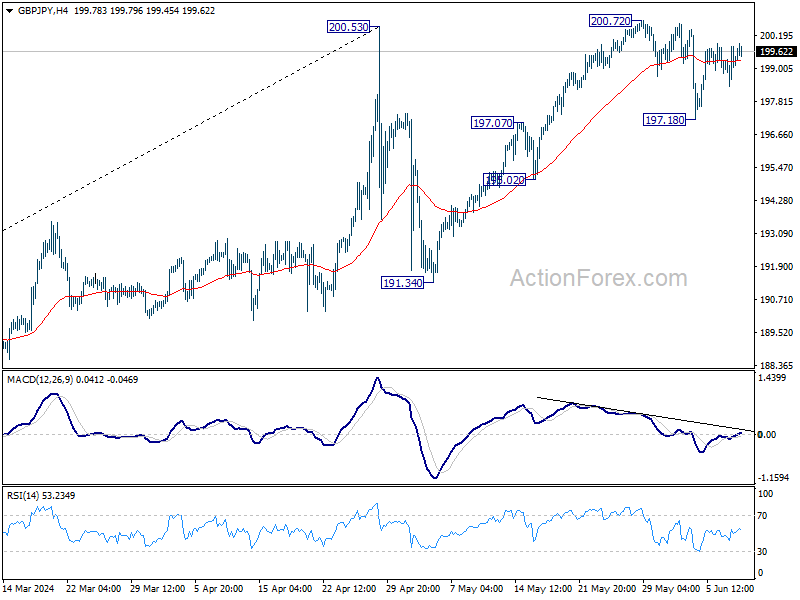
Intraday bias in GBP/JPY remains neutral for the moment. On the downside, break of 197.28 will strengthen the case that rise from 191.34 has completed. Intraday bias will be back on the downside for 195.02 support first. However, decisive break of 200.72 will resume larger uptrend instead.
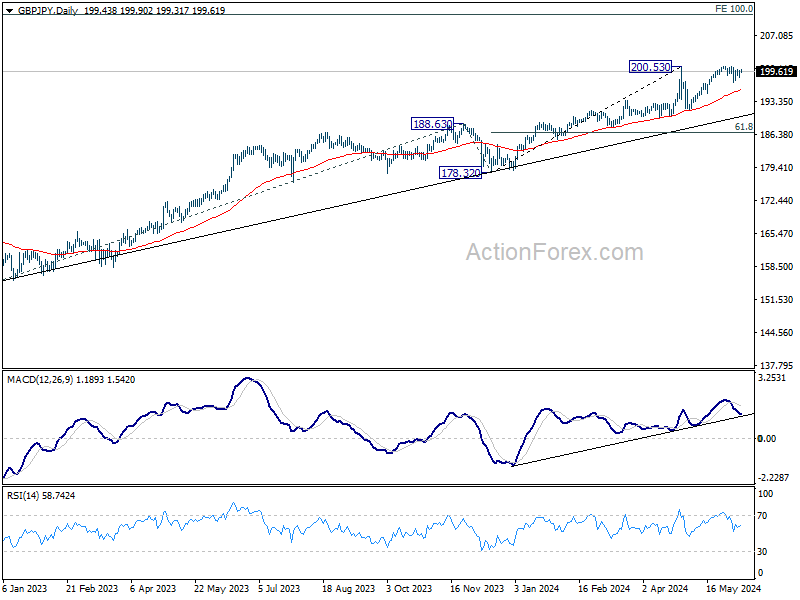
In the bigger picture, as long as 188.63 resistance turned support holds, long term up trend is expected to continue. Sustained trading above 200.53 will pave the way to 100% projection of 155.33 to 188.63 from 178.32 at 211.62.
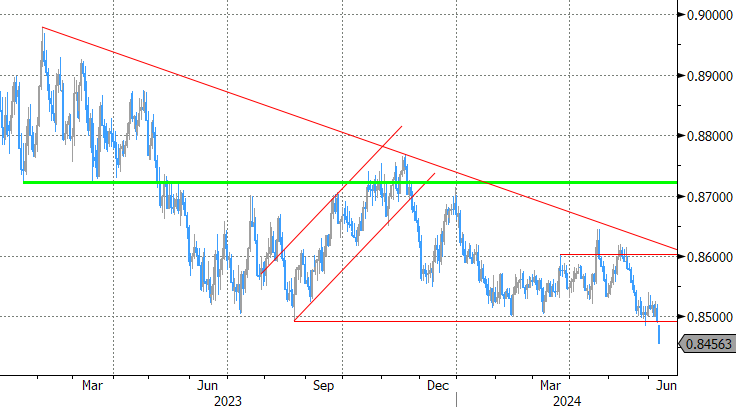
EUR/GBP Rate at 21-Month Low Post-European Parliament Elections
Investors will begin the week in a state of uncertainty regarding the outlook of Europe's political landscape.
The four-day European Parliament elections concluded on Sunday. According to Reuters, the results showed a significant gain for eurosceptic-nationalists, who have displaced liberals and greens.
Additionally, President Emmanuel Macron dissolved the French Parliament, calling for early legislative elections later this month after losing to Marine Le Pen's far-right party in the European Union elections.
All this puts pressure on the structure of the European Union, weakening the euro's value.
As shown by the EUR/GBP chart, trading on the currency markets opened on Monday around the 0.8465 level—a price not seen since August 2022.
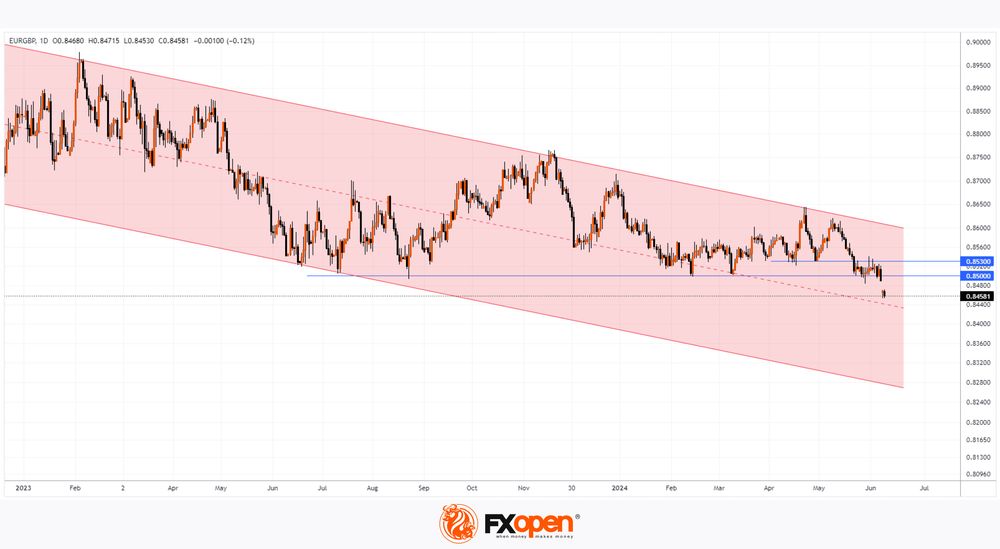
According to the technical analysis of EUR/GBP today:
→ The price broke below the critical support level of 0.85, which had been in place since 2023;
→ In terms of price dynamics since autumn 2022, the market is in a downward trend (as indicated by the red channel). The bearish break of 0.85 reinforces this trend;
→ The median line of the channel could serve as a consolidation zone below 0.85, confirming the relevance of the channel;
→ The 0.85-0.853 zone may provide significant resistance in the future if bulls attempt to rectify the situation.
In a negative scenario for the market (e.g., a political crisis within Europe), the EUR/GBP price could potentially reach the lower boundary of the indicated channel.
Trade over 50 forex markets 24 hours a day with FXOpen. Take advantage of low commissions, deep liquidity, and spreads from 0.0 pips. Open your FXOpen account now or learn more about trading forex with FXOpen.
This article represents the opinion of the Companies operating under the FXOpen brand only. It is not to be construed as an offer, solicitation, or recommendation with respect to products and services provided by the Companies operating under the FXOpen brand, nor is it to be considered financial advice.
Gold Technical: On the Brink of a Potential Multi-Week Corrective Decline
- Gold (XAU/USD) plummeted below its 20-day & 50-day moving averages, and recorded a daily loss of 3.45% last Friday, 7 June; its worst daily performance since November 2020.
- The main negative catalyst has been a halt in China’s gold purchases in May after 18 consecutive months of buying through its official reserves.
- A further rebound in the US 10-year Treasury yield coupled with a steady increase in large speculators’ net bullish positioning in gold futures towards a 3-year high may add further downside pressure.
- Watch the US$2,380 key medium-term pivotal resistance on Gold (XAU/USD).
After a minor recovery of +3% from its US$2,320 support seen on 3 June to a recent US$2,388 intraday high printed last Friday, 7 June, price actions do not have a positive follow-through as it sliced below both its 20-day and 50-day moving averages within three hours on last Friday, 7 June and slumped to record a daily loss of 3.45%, the most since November 2020.
China halted its official gold purchases in May
The main catalyst that triggered last Friday’s horrendous decline was a halt in China’s upward trend of gold purchases after 18 consecutive months of gold buying as seen from its latest official reserves data; the amount of gold in China’s reserves stood at 72.8 million ounces for May, unchanged from April.
The opportunity cost of holding gold has ticked higher
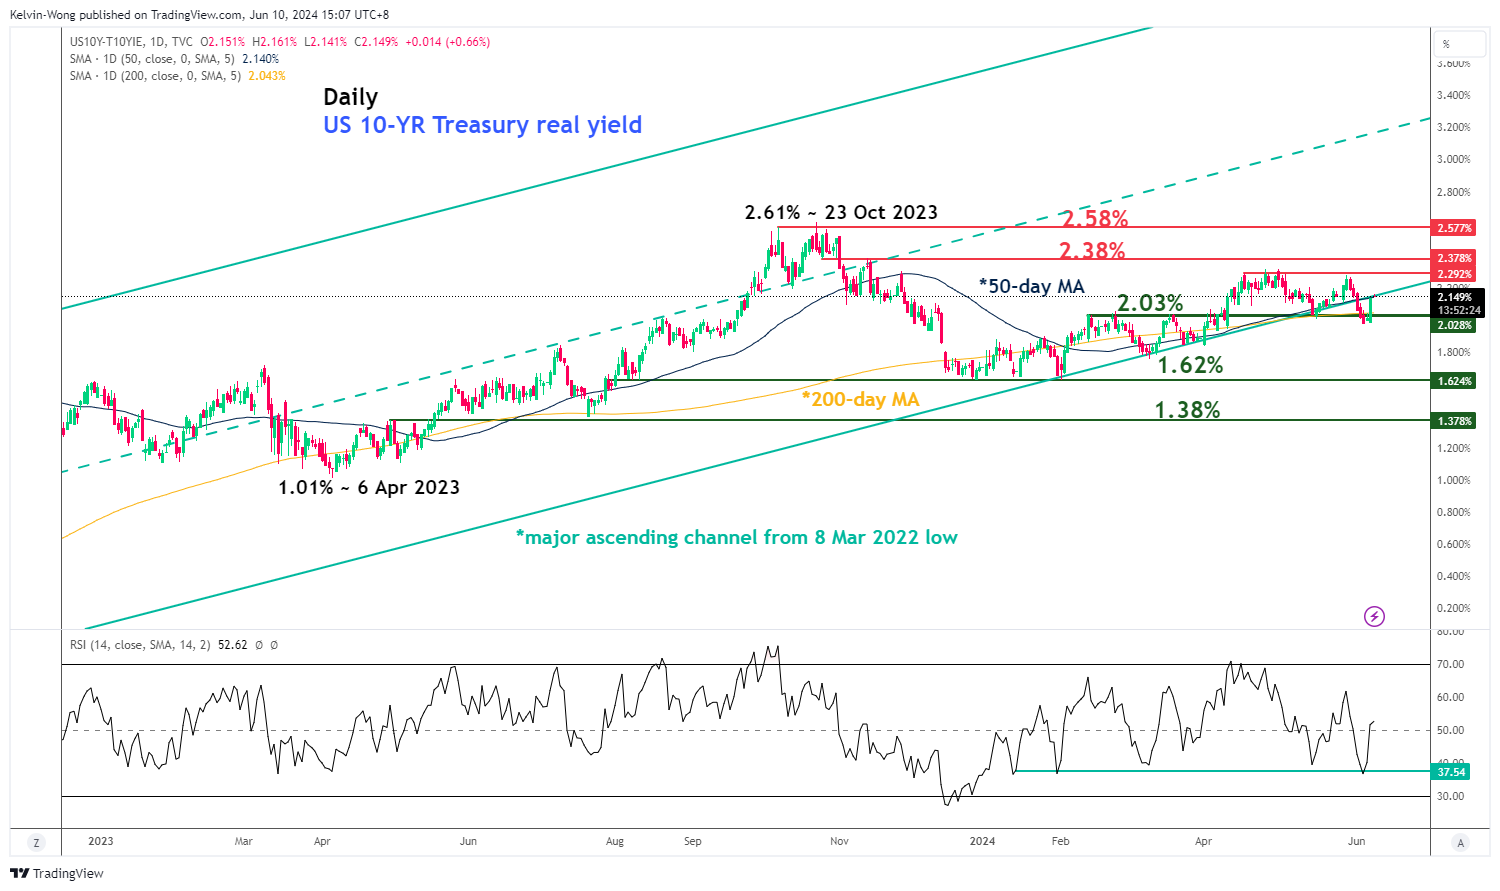
Fig 1: US 10-YR Treasury real yield major & medium-term trends as of May 2024 (Source: TradingView, click to enlarge chart)
Despite a mixed US labour data release for May last Friday where the unemployment rate increased higher to 4%, the first time since January 2022, most market participants seem to get fixated on the headline non-farm payrolls numbers that rose more than expected to +182K jobs, above the consensus estimates of +185K, and April’s downward revised figure of +165K.
The rosy headline non-farm payrolls data have pushed up the US Treasury yields as odds of a potential second Fed funds rate in the December FOMC meeting get priced out with only a 41% chance according to the CME FedWatch Tool as of 7 June 2024.
In addition, the US 10-year Treasury real yield has managed to stage a bounce after a test at a key support of 2.03% that confluences with the 200-day moving average, keeping its major uptrend phase in place since 8 March 2022 low intact (see Fig 1).
A further potential upmove in the US 10-year Treasury yield increases the opportunity costs of holding Gold (XAU/USD) as it does not yield any recurring fixed income, in turn may put further downside pressure on its prices.
Large speculator players’ net bullish positioning in gold futures heading toward a 3-year high
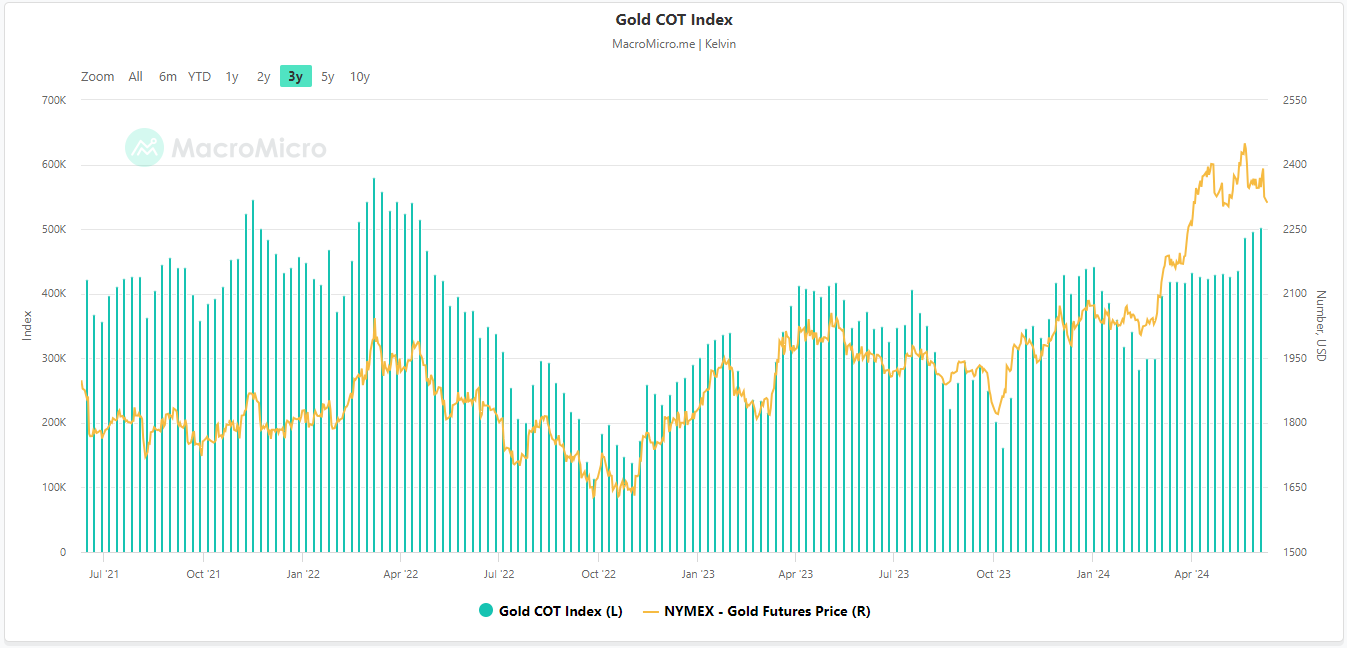
Fig 2: Commitments of Trader large speculators’ net positioning in Gold futures as of 3 June 2024 (Source: Macro Micro, click to enlarge chart)
Based on the latest data Commitments of Traders data as of 3 June 2024 (compiled by Macro Micro), the aggregate net bullish open positions of large speculators in the gold futures market of NYMEX (after offsetting the aggregate positions of large commercial hedgers) have risen to +503,233 contracts (net long), a steady of increase in the past three weeks, and coming close to its highest level in three years with +581,344 contracts recorded on 7 May 2022 (see Fig 2).
Given that net open large speculative positioning flows (primarily from hedge funds) are contrarian in nature which suggests that a relatively high level of net positioning may see an opposite reaction in price actions if related data or news flows disappoint.
In the current context of Gold (XAU/USD) movements, the risk of further profit-taking activities cannot be ruled out as large leveraged speculators have committed a relatively high amount of net bullish open positioning.
Thus, if there is a lack of fresh supportive catalysts coming out from this Wednesday, 12 June key risk events; the US CPI data release for May, and the US Federal Reserve monetary policy decision together its latest update on the “dot plot” projections for US inflationary trend, Fed funds rate may eventually see late buyers rushing to exit their positions which increases the risk of a liquidity cascading downward effect on Gold (XAU/USD) prices in the short-term to medium-term.
Medium-term momentum has weakened for gold
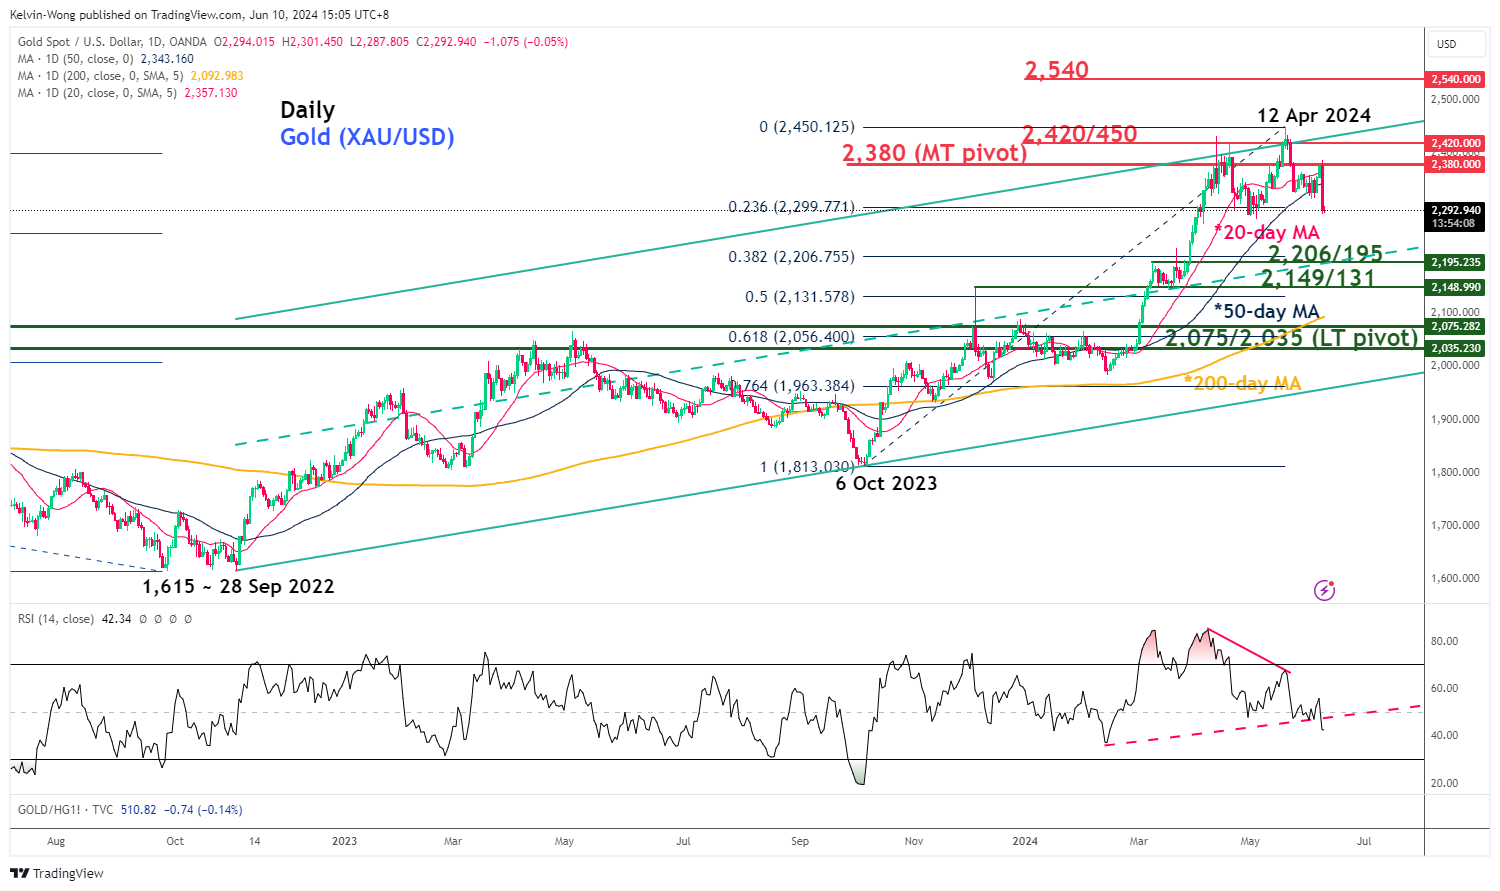
Fig 3: Gold (XAU/USD) major & medium-term trends as of May 2024 (Source: TradingView, click to enlarge chart)
In the lens of technical analysis, the Gold (XAU/USD) medium-term uptrend phase from the 6 October 2023 low has been damaged as price actions have decisively broken below its 50-day moving average with a daily and weekly close below it last Friday, 7 June (see Fig 3).
In addition, the daily RSI momentum indicator has broken below a key parallel ascending trendline support at the 48 level with a prior bearish divergence condition.
These observations suggest a bearish medium-term momentum condition has arisen that increased the odds that the price actions of Gold (XAU/USD) may unfold another leg of a multi-week corrective decline sequence within its major uptrend phase (as illustrated by green major ascending channel from 28 September 2022 low).
Watch the US$2,380 medium-term pivotal resistance with the next medium-term supports at US$2,206/2,195, and US$2,149/2,131 that confluences with the median line of the major ascending channel, and 38.2%/50% Fibonacci retracement of the prior rally from the 6 October 2023 low to the 12 April 2024 all-time high.
However, a clearance above US$2,380 sees the revival of the bullish impulsive sequence to retest the all-time high area of US$2,420/2,450 before exposing the next medium-term resistance of US$2,540.
USD/CAD Daily Outlook
Daily Pivots: (S1) 1.3696; (P) 1.3732; (R1) 1.3801; More...
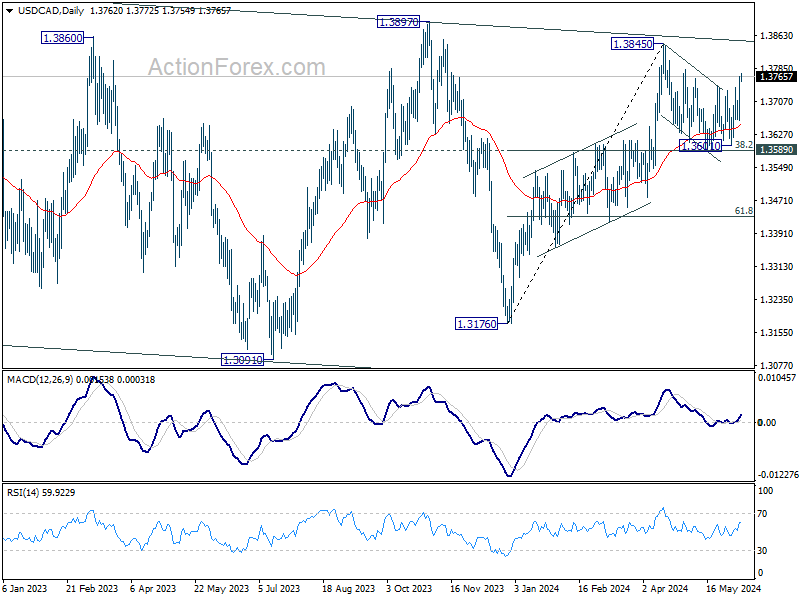
USD/CAD's break of 1.3742 resistance revive the case that correction from 1.3845 has completed at 1.3589. Intraday bias is back on the upside for retesting 1.3845 high next. On the downside, break of 1.3662 support will extend the corrective pattern from 1.3845 with another falling leg instead.
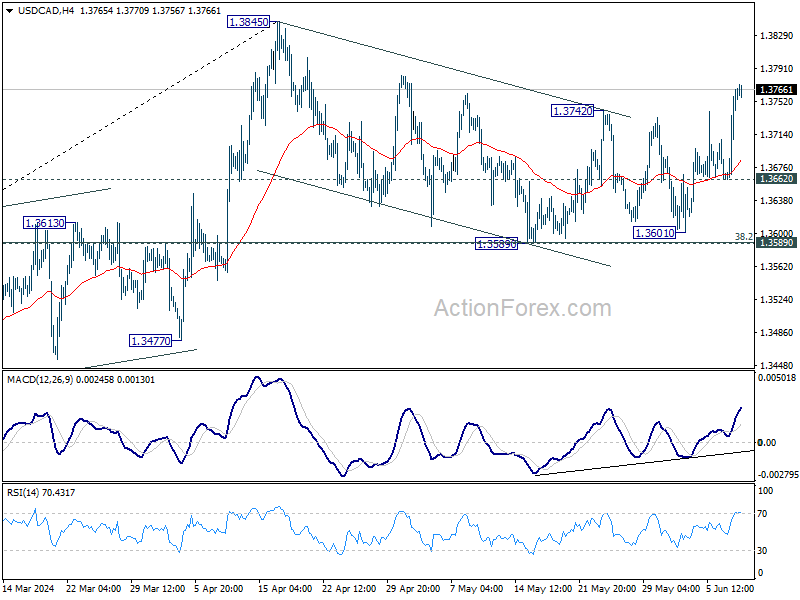
In the bigger picture, price actions from 1.3976 (2022 high) are viewed as a corrective pattern. In case of another fall, strong support should emerge above 1.2947 resistance turned support to bring rebound. Firm break of 1.3976 will confirm up resumption of whole up trend from 1.2005 (2021 low). Next target is 61.8% projection of 1.2401 to 1.3976 from 1.3176 at 1.4149.
AUD/USD Daily Report
Daily Pivots: (S1) 0.6546; (P) 0.6613; (R1) 0.6648; More...
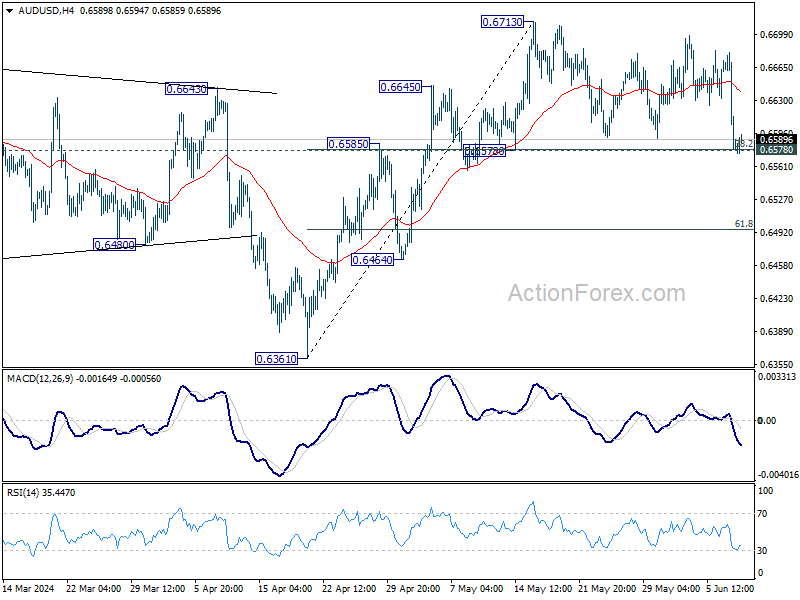
AUD/USD is still holding on to 0.6578 cluster support (38.2% retracement of 0.6361 to 0.6713 at 0.6579) despite current deep pull back. Intraday bias remains neutral for the moment. On the upside, firm break of 0.6713 will resume whole rise from 0.6361 to 0.6870 resistance next. However, sustained break of 0.6578 will dampen this bullish view, and bring deeper fall to 61.8% retracement at 0.6495.
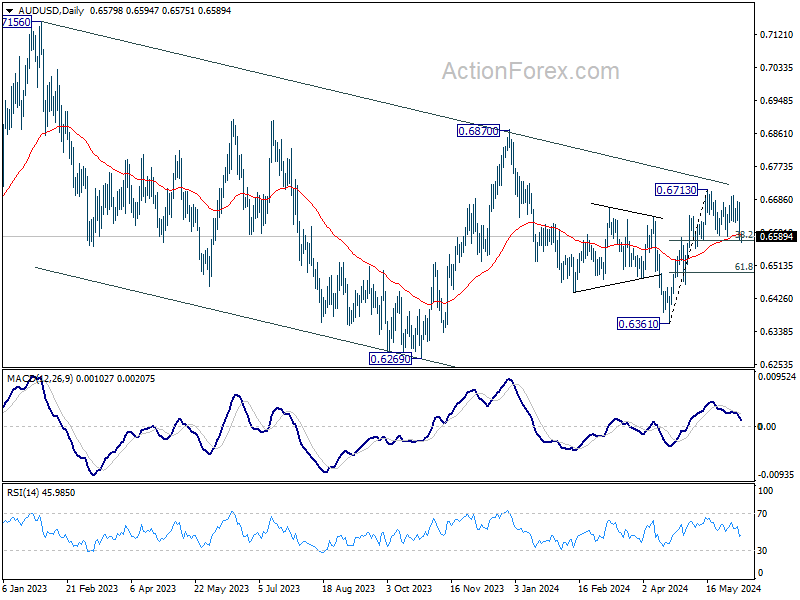
In the bigger picture, price actions from 0.6169 (2022 low) are seen as a medium term corrective pattern to the down trend from 0.8006 (2021 high). Fall from 0.7156 (2023 high) is seen as the second leg, which could have completed at 0.6269 already. Rise from there is seen as the third leg which is now trying to resume through 0.6870 resistance.
USD/JPY Daily Outlook
Daily Pivots: (S1) 155.57; (P) 156.33; (R1) 157.52; More...
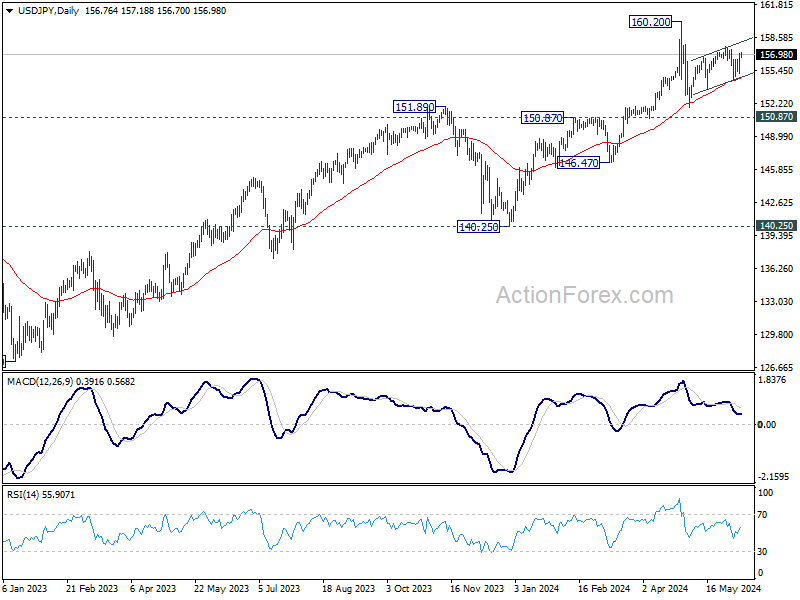
Intraday bias in USD/JPY remains neutral for the moment. On the upside, break of 157.70 will resume the whole rise from 151.86 and target 160.20 high. Nevertheless, break of 154.53 will turn bias to the downside for 151.86 support and possibly below, as the third leg of the corrective pattern from 160.20.
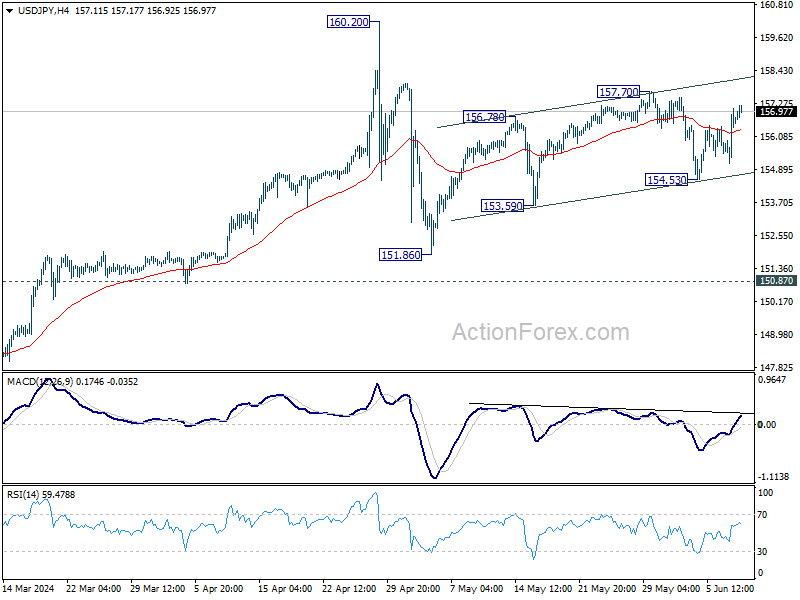
In the bigger picture, a medium term top might be formed at 160.20. As long as 55 W EMA (now at 147.77) holds, fall from 160.20 is seen as correcting the rise from 140.25 only. However, sustained break of 55 W EMA will argue that larger correction is possibly underway, and target 146.47 support next.
USD/CHF Daily Outlook
Daily Pivots: (S1) 0.8906; (P) 0.8940; (R1) 0.8998; More....
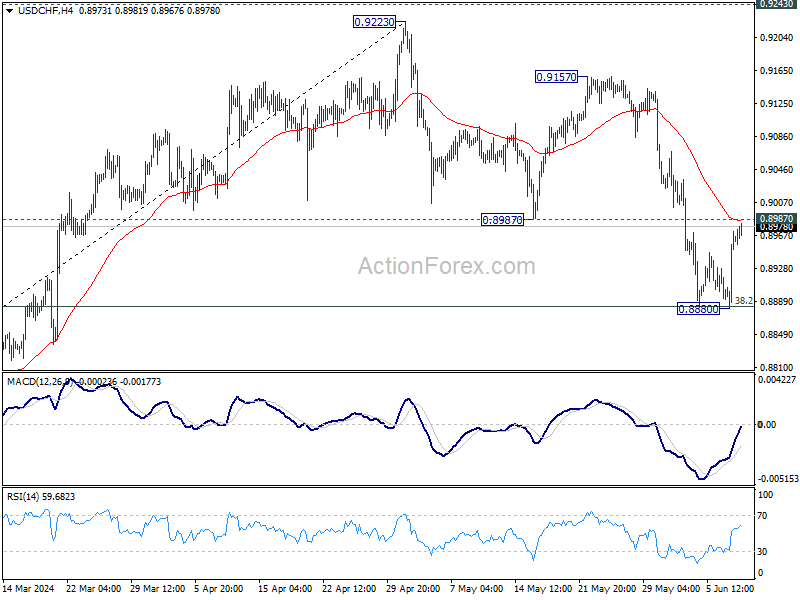
Intraday bias in USD/CHF stays neutral at tis point. On the upside, firm break of 0.8987 support turned resistance will argue that correction from 0.9223 has completed, after drawing support from 0.8883 fibonacci level. Intraday bias will be back on the upside for 0.9157/9223 resistance zone. Nevertheless, sustained break of 0.8883 fibonacci level will carry larger bearish implications and bring deeper decline.
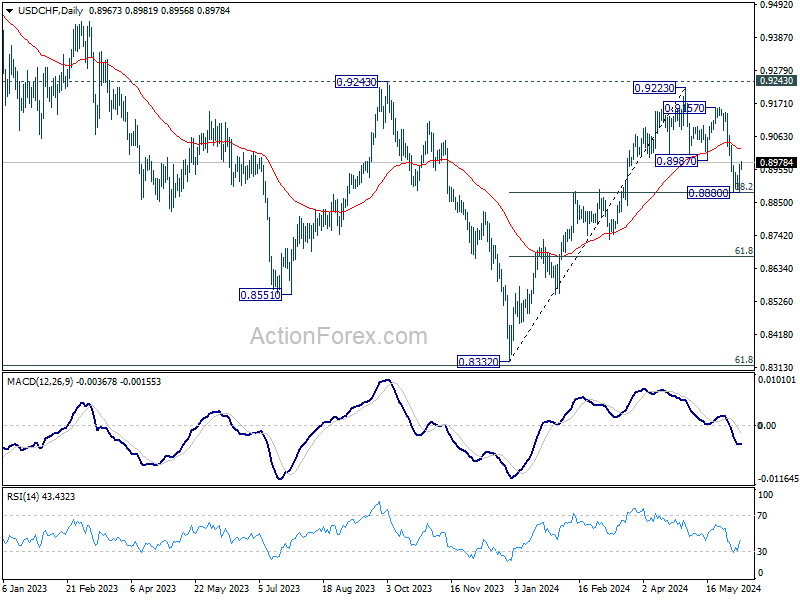
In the bigger picture, price actions from 0.8332 medium term bottom are tentatively seen as developing into a corrective pattern to the down trend from 1.0146 (2022 high). Rejection by 0.9243 resistance, followed by sustained break of 38.2% retracement of 0.8332 to 0.9223 at 0.8883 will strengthen this case, and maintain medium term bearishness. However, decisive break of 0.9243 will argue that the trend has already reversed and turn medium term outlook bullish for 1.0146.
GBP/USD Daily Outlook
Daily Pivots: (S1) 1.2688; (P) 1.2750; (R1) 1.2784; More...
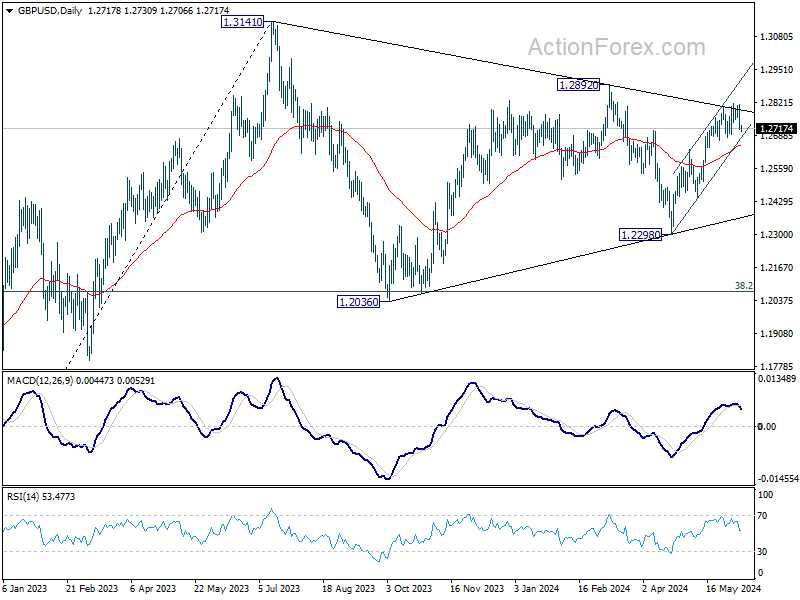
Intraday bias in GBP/USD remains neutral for the moment. Considering bearish divergence condition in 4H MACD, firm break of 1.2680 support will turn bias back to the downside for 55 D EMA (now at 1.2651) and possibly below. Nevertheless, break of 1.2816 will resume the rise from 1.2298 to 1.2892 resistance.
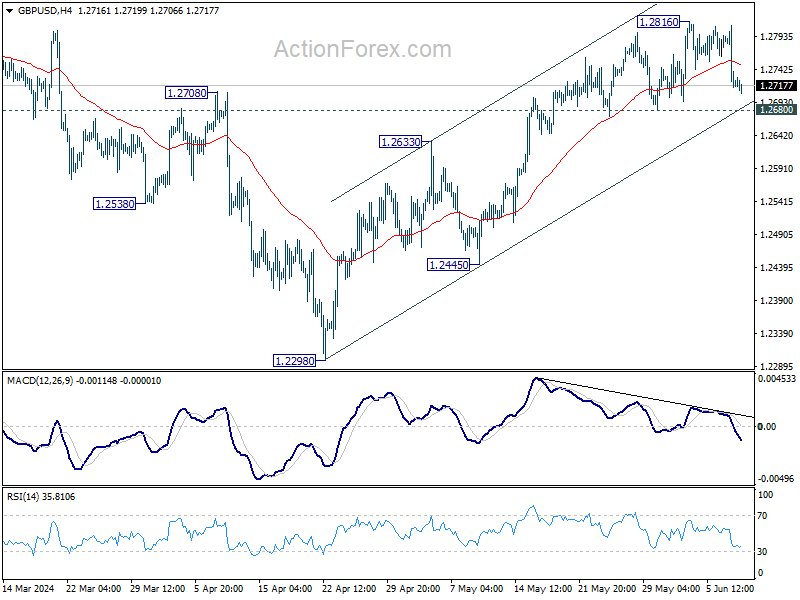
In the bigger picture, price actions from 1.3141 medium term top are seen as a corrective pattern. Fall from 1.2892 is seen as the third leg which might have completed already. Break of 1.2892 resistance will argue that larger up trend from 1.0351(2022 low) is ready to resume through 1.3141. Meanwhile, break of 1.2445 support will extend the corrective pattern with another decline instead.
Elliott Wave Analysis: USD/CHF Bounces from the sSupport
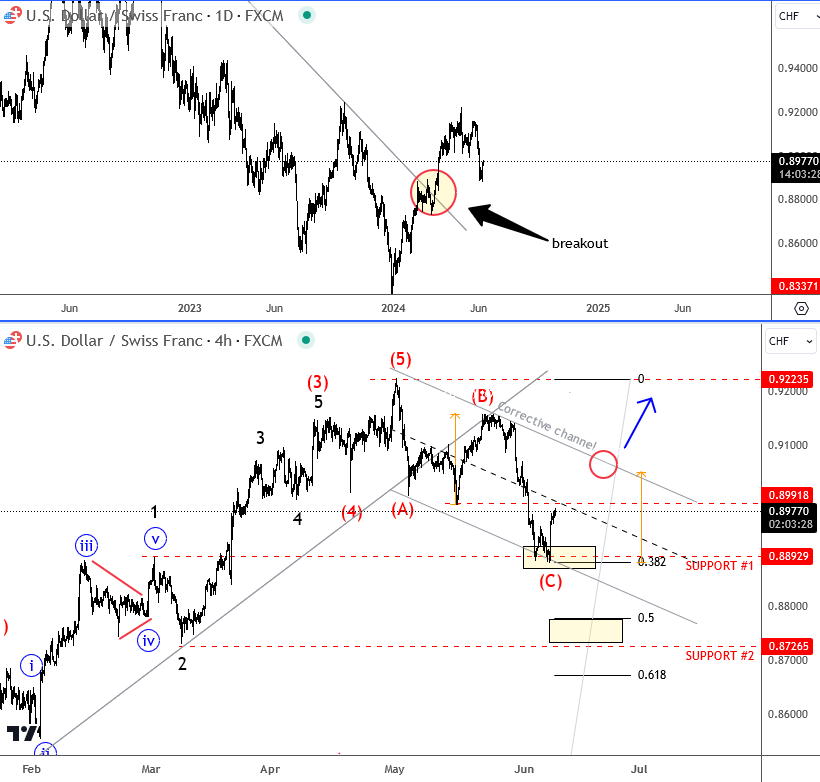
USDCHF is coming higher this year, after breaking some important trendline connected from 2022 highs on a daily chart, where a breakout would lead to higher prices within big triangle range.
Looking at the 4-hour chart, it looks like pair is in a higher degree corrective setback after a completed five-wave rally and broken trendline. We are tracking an A-B-C corrective decline, where wave C is already testing first 0.8900 support zone so there can be some price stabilization in the near-term. But for bullish resumption, we need sharp turn back above 0.9 level, and move out of a channel. In case of deeper and more extended C wave, the next support would be around 0.87 - 0.86 area. In either case, we think that CHF weakness will still show up this year, maybe not only vs USD, but also vs some other currencies.
French Election Risk Likely to Keep Euro Under Pressure in the Build-up
Markets
The US market needle again points in the direction of a December rather than a September (50% probability from 85%) Fed policy rate cut after Friday’s consensus-beating payrolls. 272k net job growth and accelerating wage growth (0.4% M/M & 4.1% Y/Y) triggered a massive sell-off in US Treasuries. Daily changes on the US yield curve ranged between +12 bps (30-yr) and +16 bps (2-yr). The US 10-yr yield that way managed to get away from the 4.3% support area. We don’t expect another US Treasury rebound in the run-up to Wednesday’s May CPI inflation figures and Fed meeting. The consensus bar for headline inflation (0.1% M/M) seems rather low suggesting upside risks for Y/Y inflation (3.4%) also given last year’s equally low comparison base (0.1%). The pace of core inflation is expected stable compared to April (0.3% M/M) with base effects (0.4% last year) more in favour of a disinflation narrative (3.5% Y/Y expected). The Fed will keep policy rates unchanged but both the statement and the updated summary of economic projections risk showing a further hawkish shift. The updated dot plot will be a very close between a more market-friendly consensus of two rate cuts this year and sell-off triggering one rate cut. The path for 2025 risks being slower as well (current end of year median of 3.75%-4%) The neutral rate is equally vulnerable to a new upward (median) revision from 2.56% in March (2.5% in December). US yields can revisit this year’s highs is this scenario materializes.
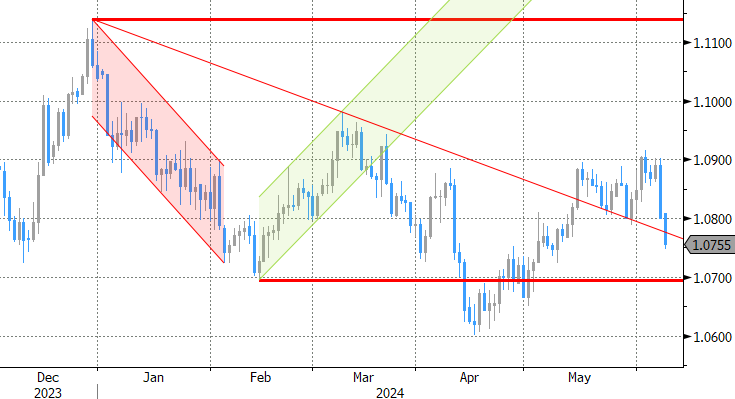
The dollar rallied following US payrolls to a weekly close of EUR/USD 1.08 and ending the topside test of the 1.09 sideways range. The pair this morning sinks to the 1.0750 area after French president Macron conceded defeat in EU elections by calling snap elections at the end of this month. This election risk (strong showing of far right RN) is likely to keep the euro under pressure in the build-up. We expect to see some widening in sovereign spreads as well this week. EUR/GBP fell below the 0.85 support zone to currently change hands around 0.8450. Those are the weakest levels since August 2022. If the Bank of England turns out more hawkish than the ECB next this week, it could add to EUR/GBP selling pressure.
News & Views
French President Macron will dissolve parliament after Marine Le Pen’s Rassemblement National secured almost 1/3rd of the votes in EU elections compared to less than 15% for Macron’s centrist alliance. Snap elections will be held on June 30 and July 07. Macron sees a need for clarification and a clear majority to act in serenity and harmony. The overall outcome of European elections showed a strong outcome for the center-right EPP, securing 184 seats in the 720 seat EU parliament. Current coalition partners Socialists and Democrats and the pro-European Renew managed 139 and 80 seats respectively. Together, they again have a majority but it’s unsure whether this will be enough for outgoing President of the EC (von der Leyen) to secure a second term as several members of parliament of the three groups might not support her candidacy. The EC President also needs a qualified majority of 15 of the 27 EU leaders of countries that together represent 65% of the EU population. The far-right and Euro-sceptic group Identity and Democracy raised its number of seats from 49 to 58 with the German AfD gaining another 15 seats.
At the same time of the elections for the EU parliament, Belgium held elections for the national and its regional parliaments. On a federal level (150 seats), the center-right Flemish NVA secured 24 seats (-1) and remains the biggest party, staying ahead of the far-right Vlaams Belang (20 seats; +2). Among the families that are represented with parties in both the French and Flemish speaking part of the country, the liberal family obtained 27 seats (thanks to a strong showing of MR (20 seats) in Wallonia; +1 combined), the social democrats won 29 seats (stable) and Christian democrats 25 seats (+8). The Green group is decimated from a combined 21 seats to only 9 while the far-left group PTB-PVBA collected 15 seats (+3). Even as political fragmentation might complicate the formation of a new government, the leader of the NVA party is expected to take the lead to form a new center-right government.
Graphs
GE 10y yield
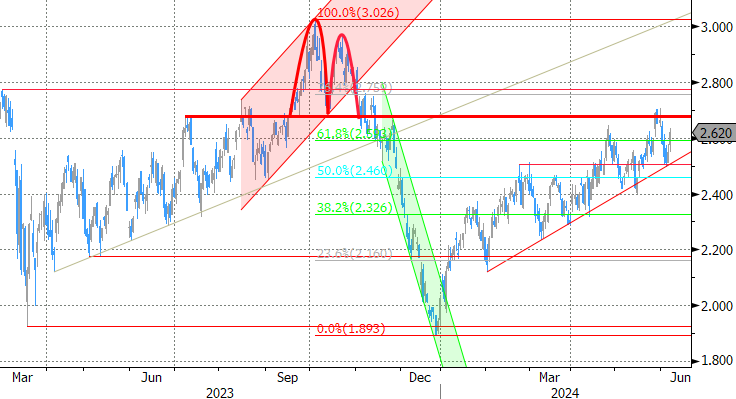
The ECB cut its key policy rates by 25 bps at the June policy meeting. A more bumpy inflation path in H2 2024, the EMU economy gradually regaining traction and the Fed’s higher for longer US strategy make follow-up moves difficult. Markets are coming to terms with that. The German 10y yield set a new YtD top at 2.7%.
US 10y yield
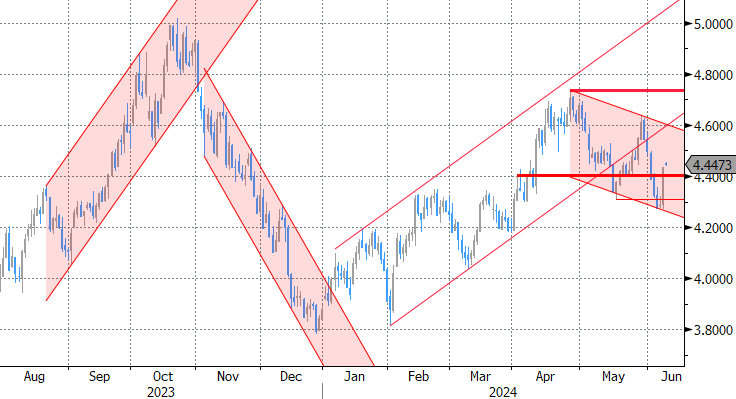
The Fed in May acknowledged the lack of progress towards the 2% inflation objective, but Fed Chair Powell indicated that further tightening was unlikely. However, the FOMC Minutes still showed internal debate on whether policy is restrictive enough. Sticky inflation suggests any rate cut will be a tough balancing act while several policy makers hint at a higher neutral rate. The US 10-y yield is stuck in the 4.3/4.7% trading range.
EUR/USD
EUR/USD is stuck in the 1.06-1.09 range. The desynchronized rate cut cycle with the ECB exceptionally taking the lead, strong US May payrolls and a swing to the right in European elections pulled the pair away from 1.09 resistance. Focus turns to the US side of the story with May CPI inflation numbers and a more hawkish Fed looming on the horizon.
EUR/GBP
Debate at the Bank of England is focused at the timing of rate cuts. Slower than expected April disinflation and a surprise general election on July 4 suggest that a June cut in line with the ECB looks improbable. Sterling gained momentum with money markets now discounting a Fed-like scenario. EUR/GBP tested the 2023 & 2024 lows near 0.85. Euro weakness eventually pulled the trick after French president Macron called snap elections following a weak showing in EU elections.