

Sample Category Title
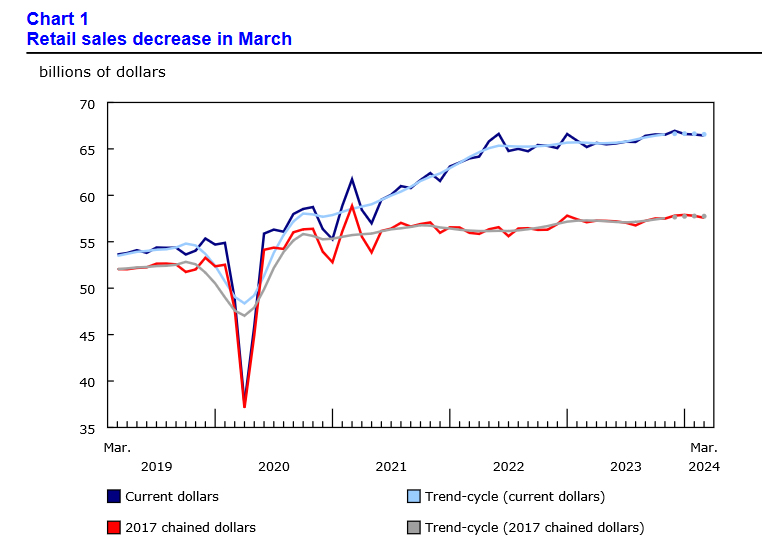
Canada’s retail sales falls -0.2% mom in Mar, slightly worse than expectations
Canada's retail sales value fell -0.2% mom to CAD 66.4B in March, slightly worse than expectation of -0.1% mom. Sales were down in seven of nine subsectors and were led by decreases at furniture, home furnishings, electronics and appliances retailers.
Core retail sales—which exclude gasoline stations and fuel vendors and motor vehicle and parts dealers—were down -0.6% om.
Advance estimate suggests that that sales increased 0.7% mom in April.
Is the Pause in NGAS a Warning Signal?
- Natural gas faces limits near January’s peak
- Technical signals flag some weakness
- Improved trend signals suggest bullish continuation
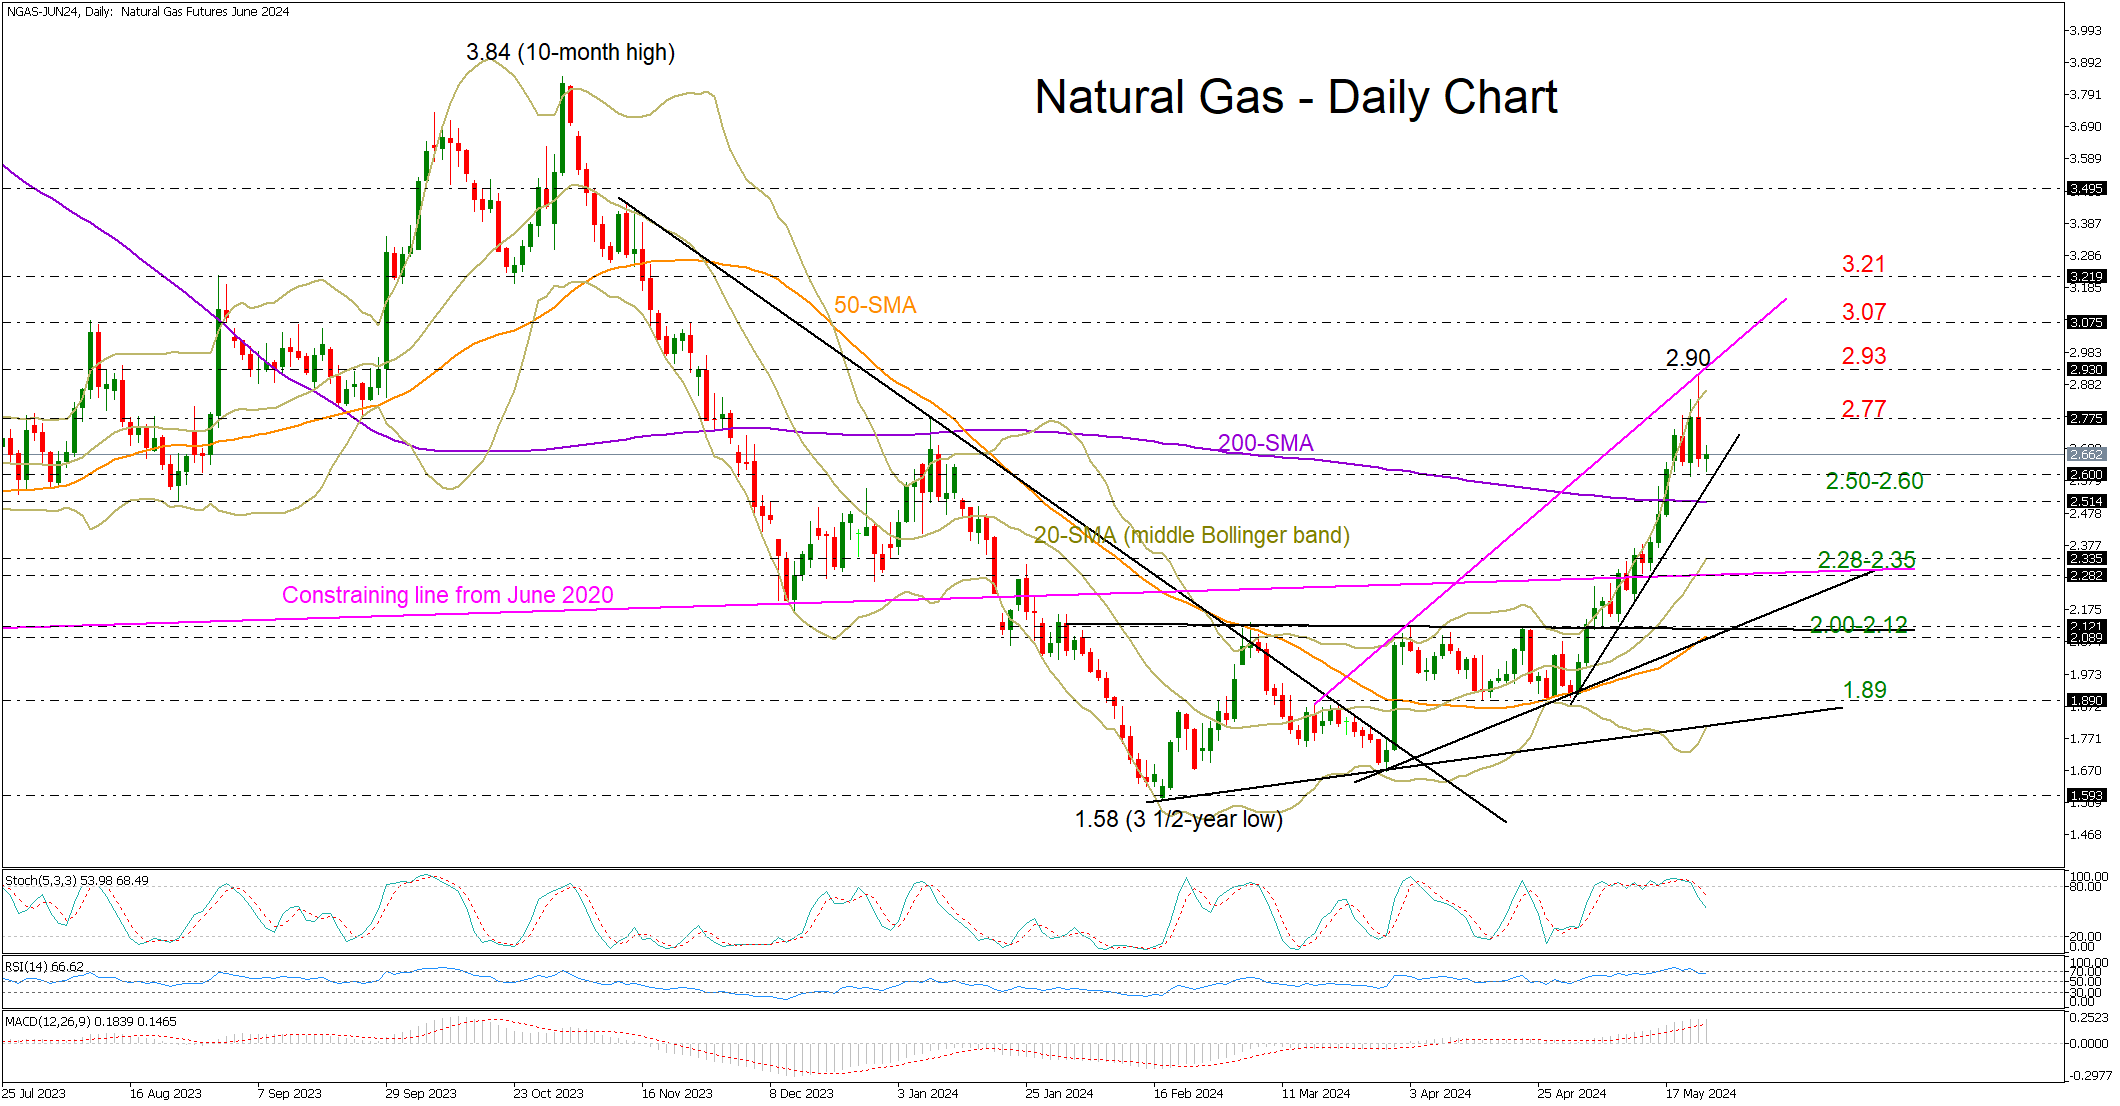
Lower-than-usual storage increases, improved demand forecasts, and a summer season ahead boosted natural gas prices above the key 200-day simple moving average (SMA) and more recently to a four-month high of 2.90.
The price, however, eased immediately to close again below January’s peak of 2.77, making investors wonder whether the upward pattern, which started from the well-known support region of 1.50, is nearing its peak.
Given the overbought signals coming from the RSI and the stochastic oscillator and the widened Bollinger bands, some softness is likely. Though a potential rebound within the nearby support region of 2.50-2.60, where the 200-day SMA is flattening, could resurface buying interest. Failure to pivot there might dampen sentiment, causing a quick decline into the 2.30-2.35 constraining zone, while lower, the 2.00-2.12 trendline territory could be more important to watch. A violation there and a step below the 50-day SMA would wipe out hopes for a bullish trend continuation, bringing the 1.89 base back into view.
Historically, the period from March onwards is flourishing for natural gas prices. Excluding the delayed rebound during the pandemic and the neutral spring phase in 2019, the market has been exhibiting significant upward tendencies every single year for more than a decade. The positive cross between the 20- and 50-day SMAs is in line with this narrative, though a golden cross between the longer-term 50-and 200-day SMA is not in sight yet.
Nevertheless, with geopolitical risks looming in the background, the bulls might seek to retain their advantage. In the short-term, an acceleration above the 2.77 border could stall near the resistance line at 2.93 which joins the April and May highs. If the bulls knock down that wall, they might run straight to the 3.07 barrier and then surge up to 3.21.
Summing up, natural gas could take a breather after its recent significant appreciation. Yet, considering the improved trend signals, a potential pullback or a sideways move could be just a temporary break in the upward trajectory.
Ethereum: Too Soon to Say Goodbye to $3000
Market picture
The crypto market lost 2.9% in the last 24 hours, retreating to a market capitalisation of $2.5 trillion. The market came under pressure as active trading began in the US on a fresh batch of strong economic data. News of the approval of spot ETFs on Ethereum only added to the pressure.
Ethereum’s sell-off on positive news is a typical “buy the rumours, sell the facts” reaction of speculators. We saw the same in January after the approval of the Bitcoin ETF, which took 19% off its price in the following two weeks before there was a spectacular reversal.
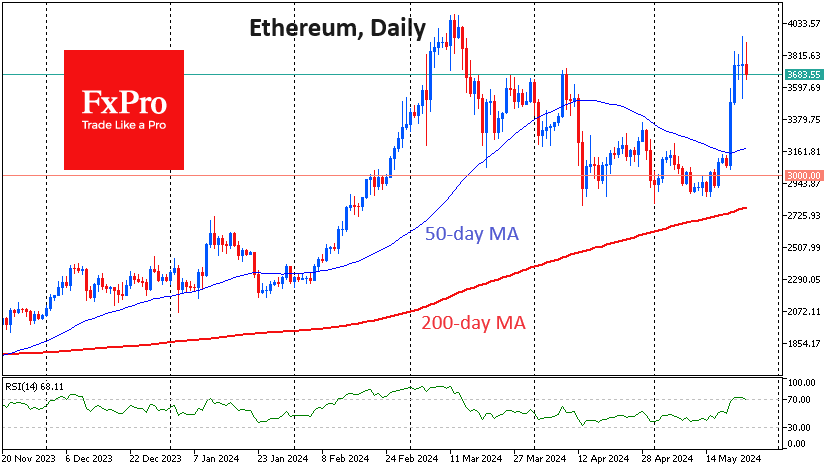
Similarly, the market may let off steam regarding Ethereum. We shouldn’t be surprised if the price pulls back to the $3000 area again, returning to an important consolidation area. From these levels, large institutional investors can start building a position in ETFs.
As a result of another recalculation, the difficulty of mining the first cryptocurrency increased by 1.48% to 84.38 T. The average hash rate for the period since the previous value change was 705 EH/s. Despite the increase, the complexity did not recover the indicator’s collapse by almost 6%, which followed the halving.
News background
The US SEC has approved the launch of Ethereum spot ETFs, according to a document uploaded on the agency’s website. The document lists eight ETFs from VanEck, Fidelity, Franklin, Grayscale, Bitwise, ARK Invest & 21Shares, Invesco & Galaxy, and BlackRock’s iShares Ethereum Trust proposed for listing on the Nasdaq, NYSE Arca, and Cboe BZX Exchange. The Ethereum ETFs will face a week-long process to complete S-1 registration statements, a form required by the SEC for ETFs to list securities.
The move is expected to result in a significant influx of institutional capital into the Ethereum market. Standard Chartered predicts inflows of $15 billion to $45 billion in the first 12 months.
According to Nansen, the total market capitalisation of stablecoins has surpassed $160 billion, up $30 billion since the start of the year. The growth means “new money” is flowing into the segment, which is bullish.
A survey by the US Federal Reserve showed that 18 million US adults (7% of the population) have invested in cryptocurrencies over the past year.
From 12 June, messenger Telegram will introduce an internal currency called Telegram Stars to pay for digital goods and services in bots and mini apps. The initiative follows Apple’s notification of a violation of App Store policy prohibiting the acceptance of internal payments, including cryptocurrencies, from customers. Bot owners reacted sharply negatively to the news, recalling Apple’s 30 per cent commission.
AUD/USD: Regains Traction After Losing Over 1% This Week
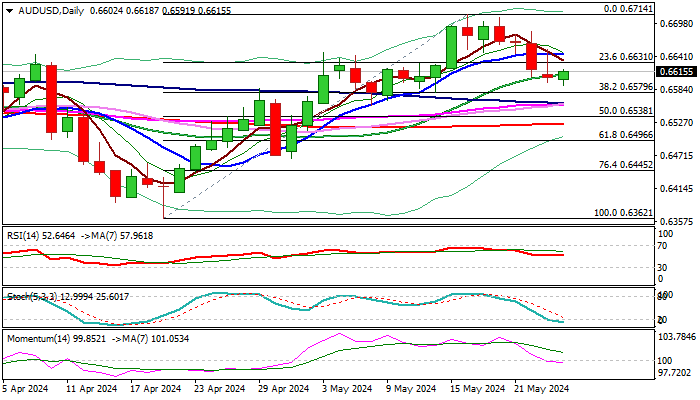
AUDUSD edges higher on Friday as traders collected part of profits from the drop in past four days.
Today’s action marks the first gain this week, but the pair remains on track for a weekly loss of over 1% so far.
Technical studies on daily chart are mixed and lack clearer direction signal, with lift and close above 0.6650 zone (10DMA / 50% retracement of 0.6714/0.6591) seen as a minimum requirement to keep recovery in play for retest of upper pivots at 0.6676 (Fibo 61.8% of 0.6871/0.6362) and 0.6713 (weekly cloud top).
Otherwise, the downside will remain vulnerable, as limited upticks will likely signal positioning for fresh push lower.
Pivotal supports lay at 0.6580/60 zone (last week’s low/Fibo 38.2% of 0.6362/0.6714/converged 100/55DMA’s) and break here would risk deeper correction.
Res: 0.6644; 0.6667; 0.6676; 0.6750.
Sup: 0.6592 0; 6580; 0.6560; 0.6538.
GBPJPY Continues its Journey North
- GBPJPY closing in to pre-intervention levels
- BoJ has the habit of intervening during bank holidays
- Momentum indicators remain bullish
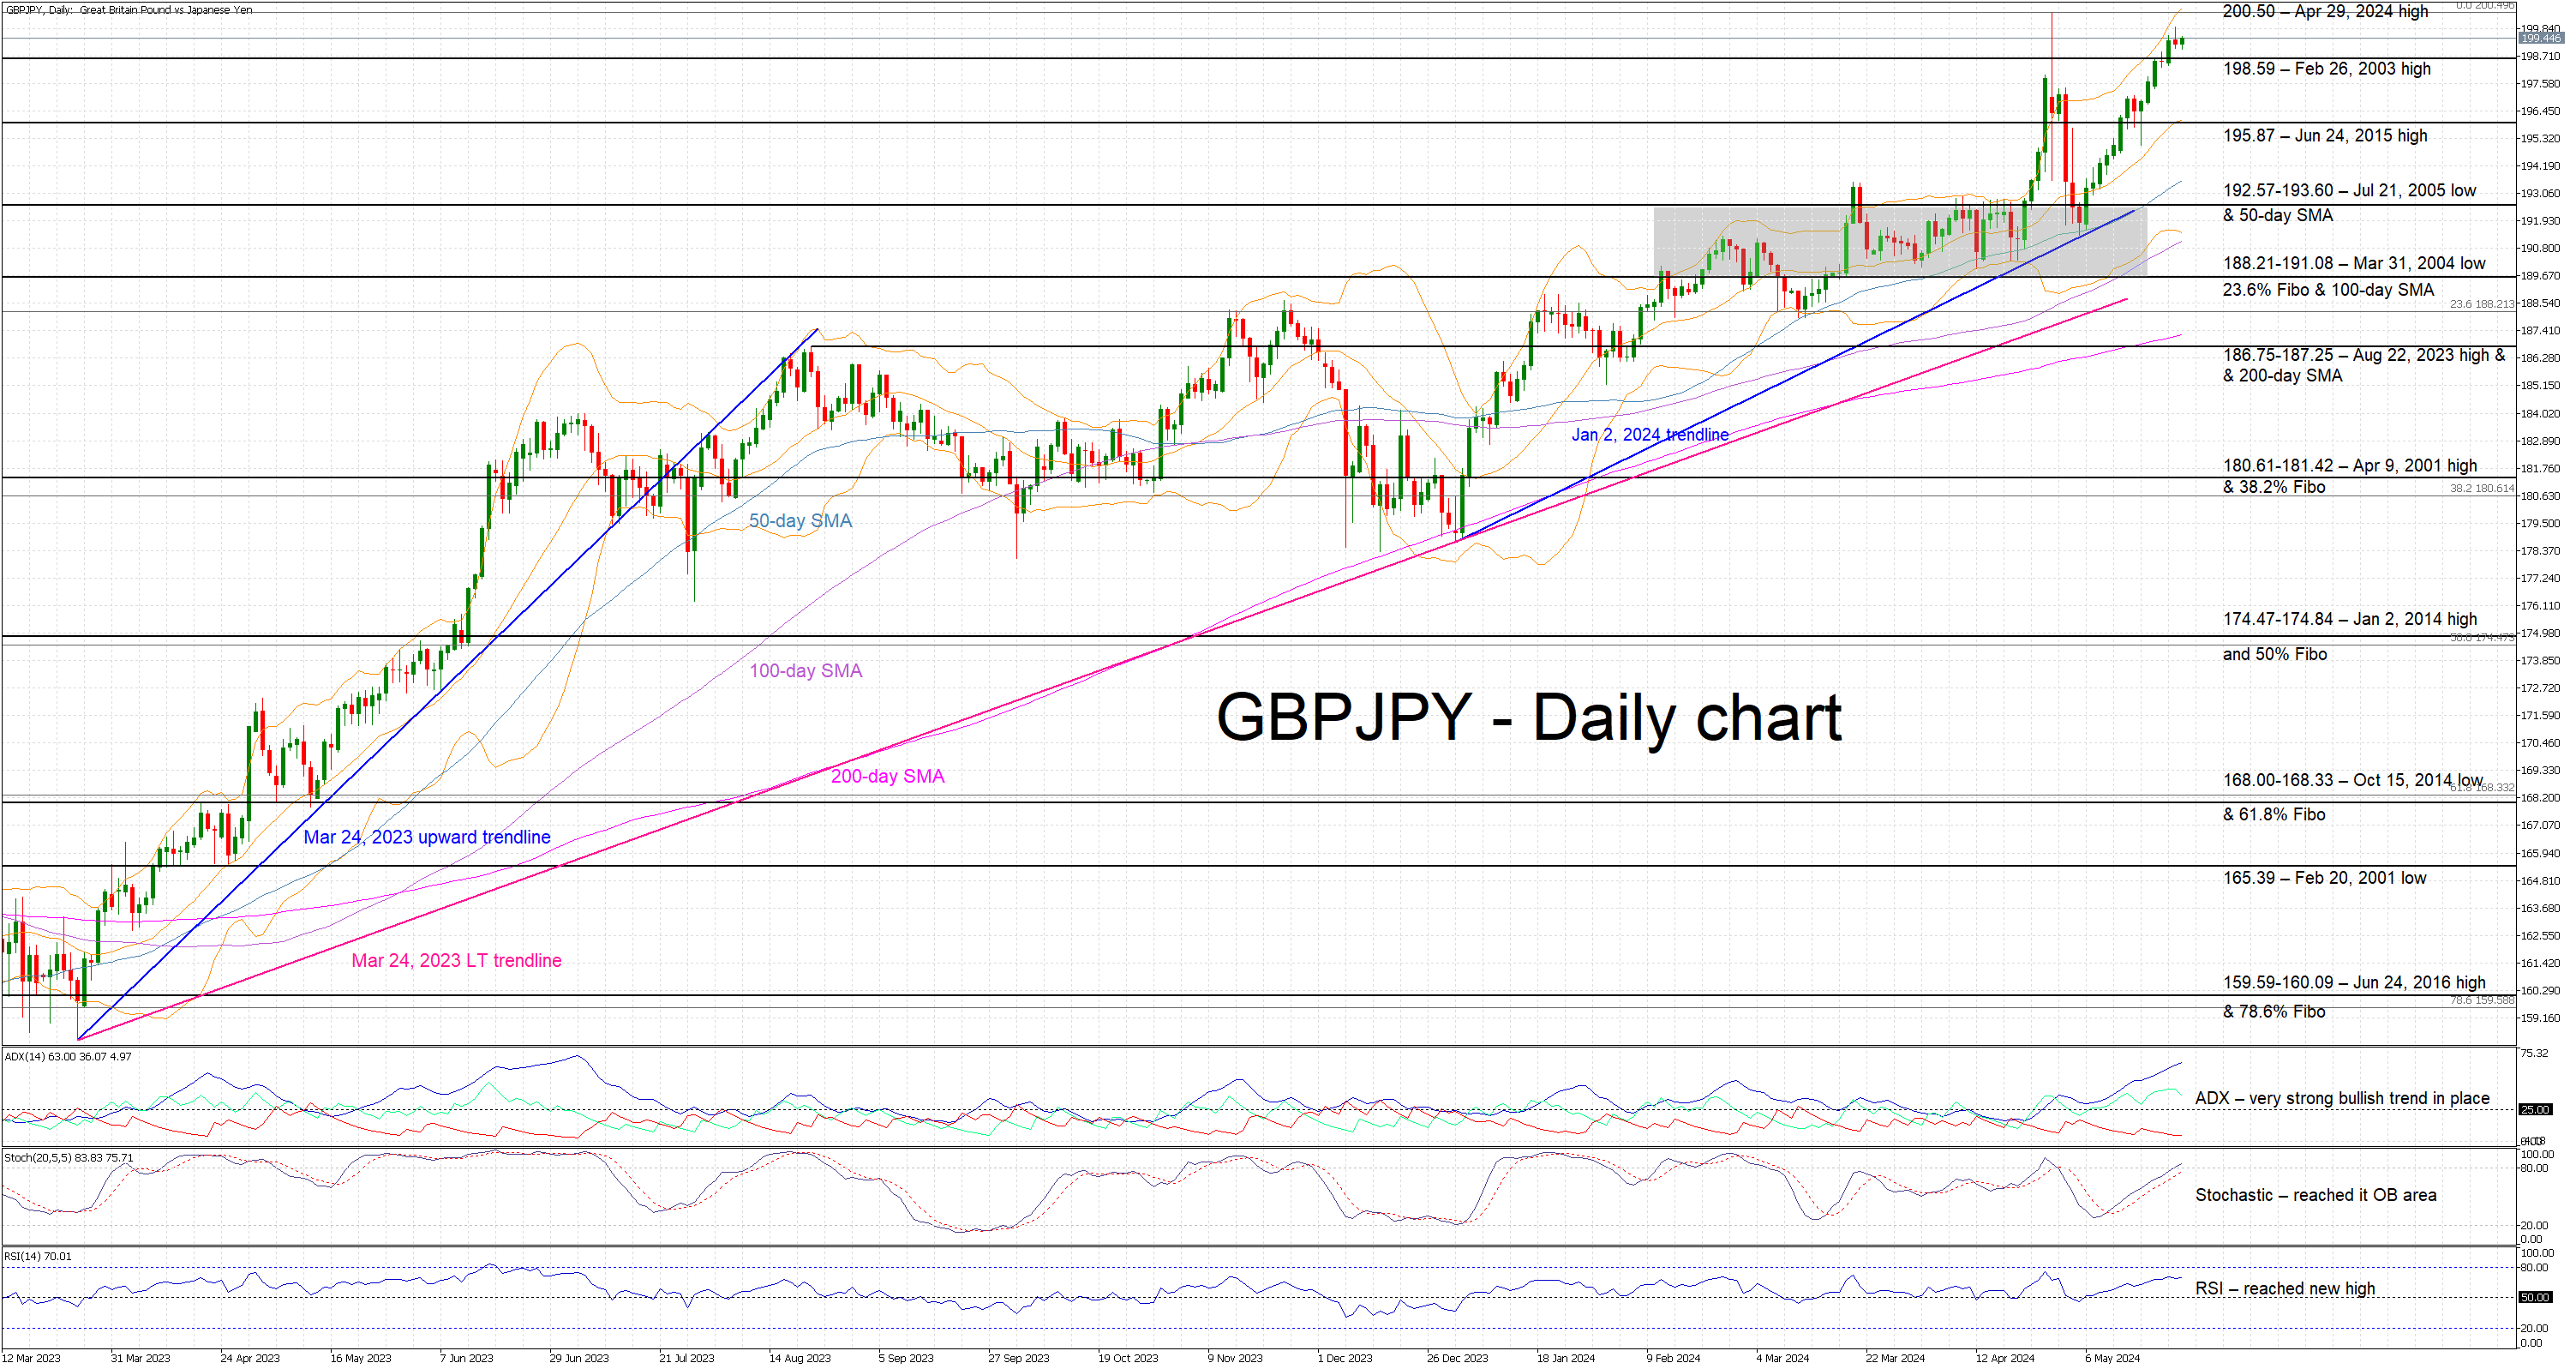
GBPJPY is edging higher again today, trading very close to the levels that forced the BoJ to intervene twice in late April. This pair has been experiencing a non-stop rally from the early May lows, quickly erasing the post-intervention correction. With Monday, May 27 being a bank holiday in the US, there is an opportunity for the BoJ to intervene, if deemed necessary.
In the meantime, momentum indicators remain bullish. More specifically, the Average Directional Movement Index (ADX) is edging higher and signaling the presence of the strongest trend in GBPJPY since the March-June 2023 rally. Similarly, the stochastic oscillator has returned to its overbought territory (OB), confirming the current bullish move in GBPJPY. However, the RSI might be showing an early sign of exhaustion as it appears unable to record a higher high.
If the bulls remain confident, they could try to keep GBPJPY above the 198.59 level and then gradually retest the April 29, 2024 high at 200.50. However, if successful, they would be trading at levels that could provoke another intervention from the Japanese authorities and thus potentially suffer losses.
On the other hand, the bears are desperately trying to regain market control. They could attempt to push GBPJPY back below the 198.59 level and towards to the June 24, 2015 high at 195.87. Such a move could open the door to a gradual retest of the 192.57-193.60 area, which is populated by the July 21, 2005 and the 50-day simple moving average (SMA), as well as the January 2, 2024 trendline.
To sum up, GBPJPY continues to climb higher as the bulls appear determined to retest BoJ’s commitment to help the ailing yen.
Australian Dollar Rapidly Depreciates
The AUD/USD pair has fallen rapidly in the final week, reaching 0.6592. This decline is primarily driven by the US dollar's robust performance, following stronger-than-expected US economic data. Investors now speculate that the Federal Reserve may postpone any interest rate cuts.
The minutes from the Fed's recent meeting have revealed concerns among policymakers about the possibility of high and persistent inflation. This has led some monetary committee members to express a readiness to tighten policy further if inflation continues to rise.
Similarly, the minutes from the Reserve Bank of Australia's (RBA) recent meeting revealed doubts among local policymakers. Although the RBA considered raising interest rates in May, it ultimately decided to maintain the current policy stance. Meanwhile, domestic statistics showed that inflation expectations in Australia fell to 4.1% in May, the lowest level since October 2021.
Technical Analysis of AUD/USD
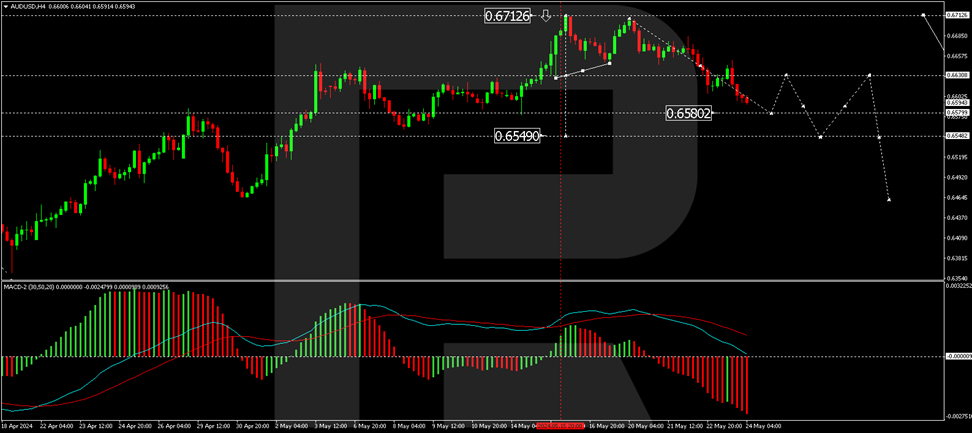
On the H4 chart of AUD/USD, a decline to 0.6663 was followed by a correction to 0.6780. Subsequently, a new wave of decline to 0.6580 has formed, serving as the local target. Upon reaching this target, a correction to 0.6630 (testing from below) is possible, followed by another decline to 0.6548. This target represents the initial objective of the downward trend wave. Technically, this scenario is confirmed by the MACD indicator, with its signal line above zero and pointing strictly downwards.
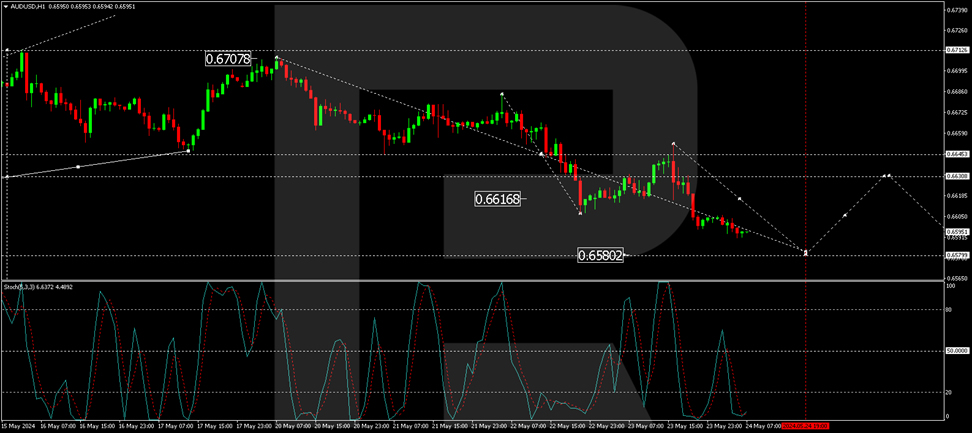
On the H1 chart, a consolidation range has formed around 0.6645. The downward exit from this range achieved the local target of 0.6607. The market has since corrected to 0.6646 (testing from below). Today, the decline wave to 0.6580 continues. After reaching this level, a consolidation range is expected to form around it. An upward exit from this range could lead to a correction to 0.6630. Conversely, a downward exit would open the potential for a further decline to 0.6540. This scenario is technically confirmed by the Stochastic oscillator, with its signal line below 20, indicating a potential beginning of a growth link to 50.
Summary
The Australian dollar's depreciation is largely influenced by the strong US dollar and the cautious outlook of the Federal Reserve and the Reserve Bank of Australia. Technical indicators suggest further potential declines with possible corrective rebounds. Market participants should closely monitor these levels as economic conditions and policy expectations evolve.
ECB’s Schnabel warns against hasty moves following likely June cut
ECB Executive Board member Isabel Schnabel indicated in an interview that if inflation outlook and upcoming data support a sustainable convergence towards 2% target, "a rate cut in June will be likely."
However, Schnabel emphasized the need for caution regarding further rate cuts. She advised giving the situation "sufficient time" and warned against "moving too quickly", noting the risk of cutting interest rates too fast. Schnabel stressed that it is crucial to avoid such premature actions.
Regarding the broader economic context, Schnabel observed a "gradual recovery" in Eurozone economy, alongside a continuing decline in inflation. She expressed optimism, stating that these trends justify the hope of "returning to price stability without a recession."
Canadian Dollar Eyes Retail Sales
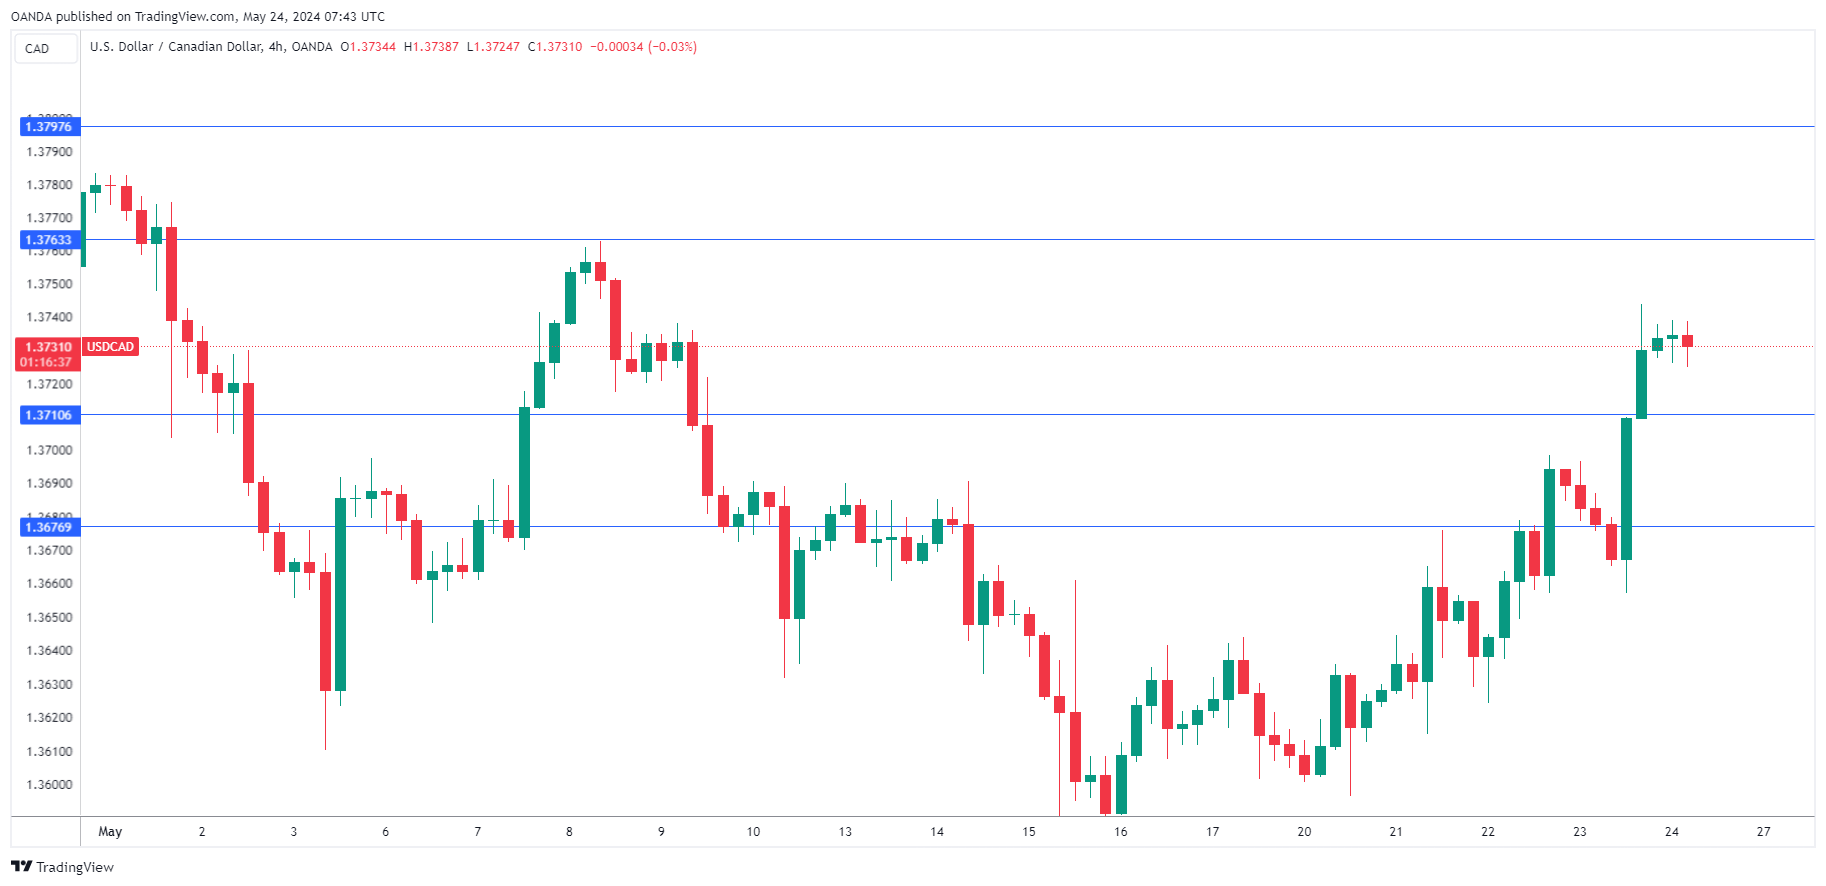
The Canadian dollar is unchanged on Friday. USD/CAD is trading at 1.3726 in the European session at the time of writing at the time. Canada releases retail sales later, which may trigger some volatility in the North American session. The US will release durable goods and consumer confidence data.
Canada’s retail sales expected to remain flat
Canadian consumers have tightened their belts, as retail sales have been flat so far in 2024. More of the same is expected in the March release, with a market estimate of 0%. Today’s report will be carefully watched by the Bank of Canada, which meets next on June 5th. The BoC has held rates at 5% for six straight times, and restless consumers are looking for some rate relief as they continue to feel the squeeze of elevated rates and the high cost of inflation.
Will the BoC make a move and lower rates at the June meeting? This week’s positive inflation release appears to provide the support that the central needs to trim rates, as CPI fell from 2.9% to 2.7% in April. Inflation is not quite at the 2% target but both the headline and core rates have dipped below 3%, which is within the BoC’s “comfort level” of 1-3%. The downtrend in inflation provides strong support for an initial rate cut in either June or July.
In the US, PMIs provided positive news. Services PMI jumped to 54.8 in May, up from 51.3 in April and above the market estimate of 51.3. This was the highest level in a year and pointed to improving business activity despite high interest rates. Manufacturing showed weak expansion, with the PMI rising from 50.0 to 50.9. The 50 level separates contraction from expansion.
USD/CAD Technical1.
- 1.3710 is a weak support level. Below, there is support at 1.3676
- 1.3763 and 1.3797 are the next resistance lines
AUDUSD Outlook Turns Neutral Again
- AUDUSD loses its gains above 0.6640 and falls into previous range area
- Short-term risk skewed to the downside; next support near 0.6570
- US durable goods orders and more Fed speakers on the calendar
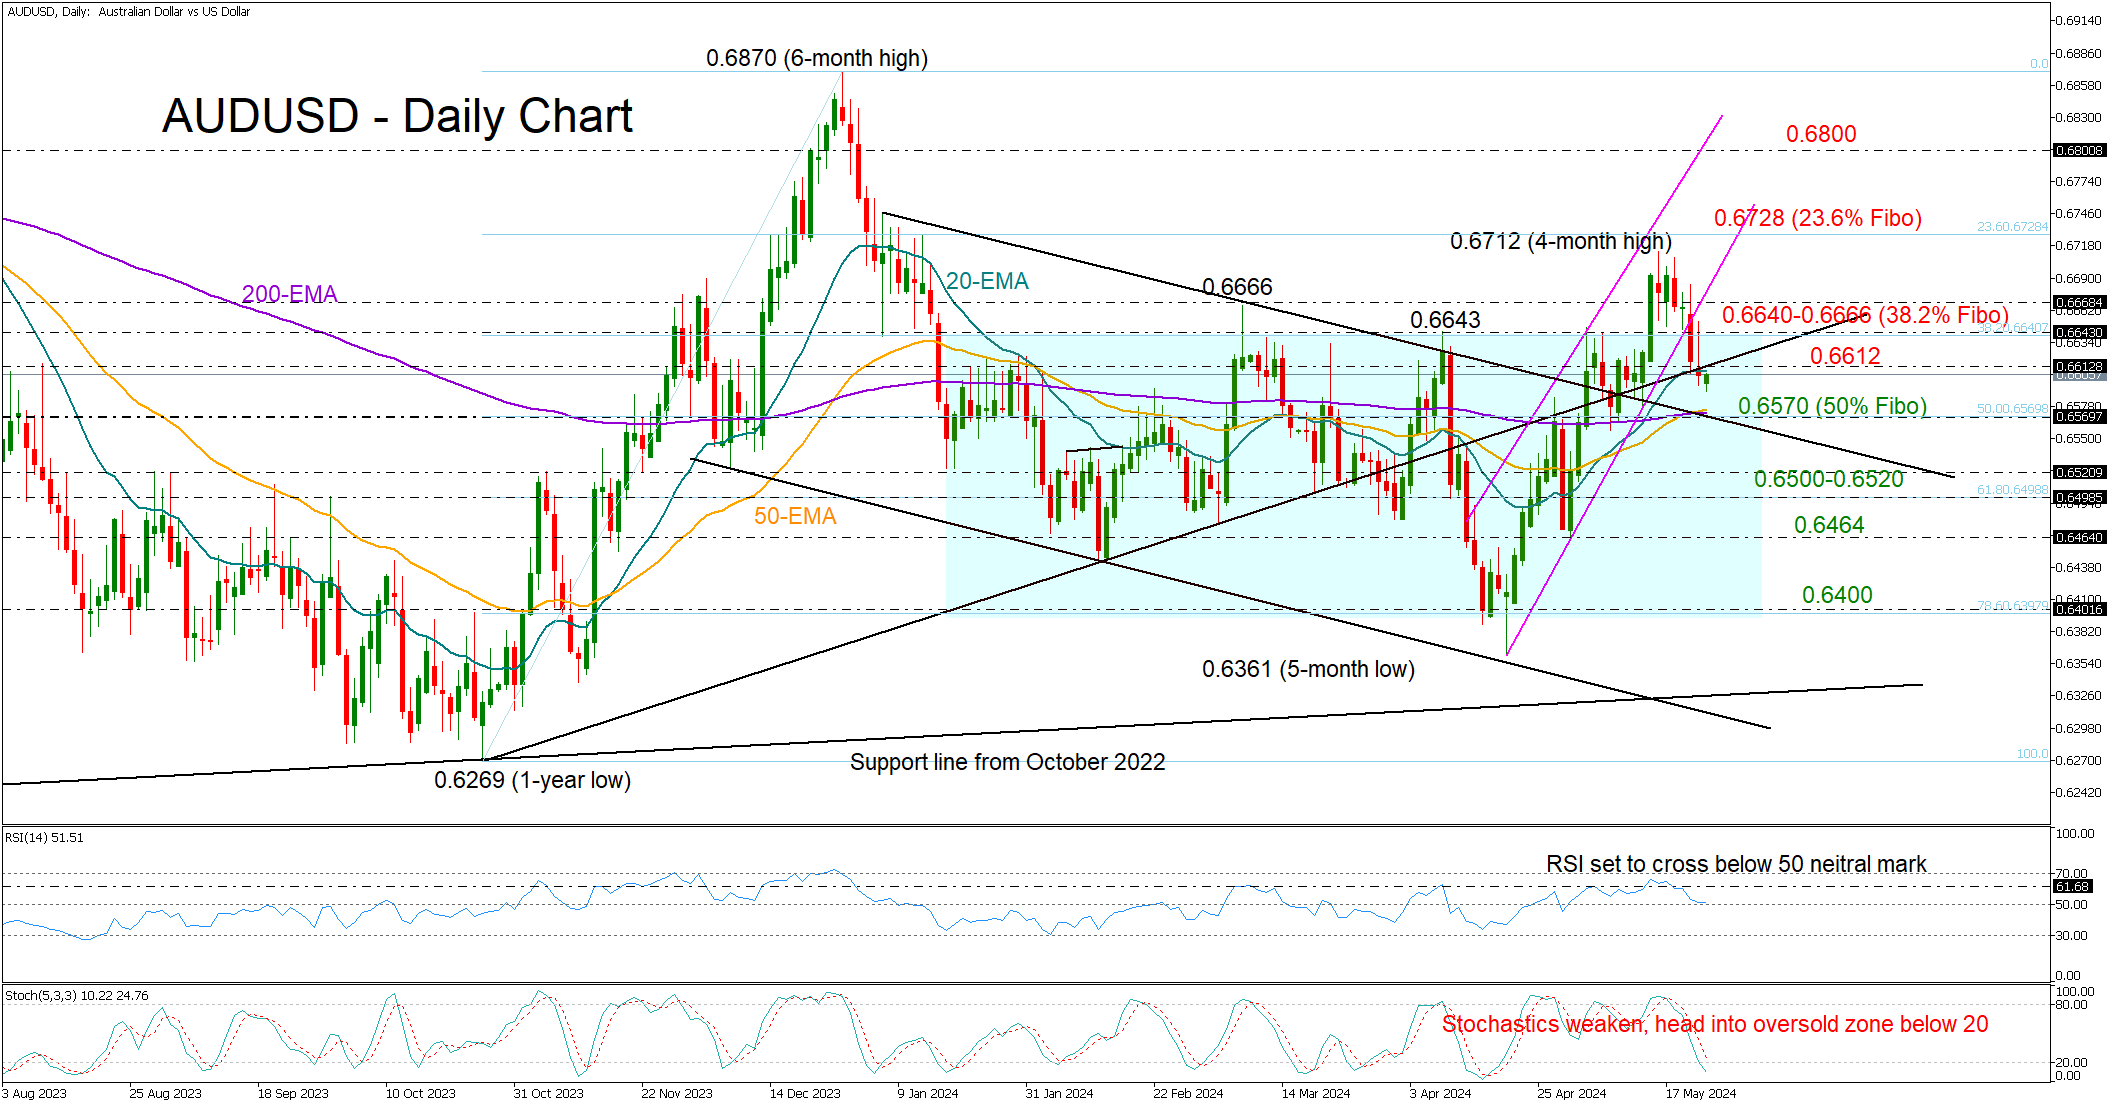
Despite the exciting bull run to a four-month high of 0.6712 last week, AUDUSD could not sustain its gains above the 0.6640 threshold, diving back into its previous range area.
Having closed below the support trendline from April’s lows and eased slightly beneath the ascending line from October 2023 and the 20-day exponential moving average (EMA), the pair might be exposed to more selling. The technical indicators align with this narrative because the falling stochastic oscillator has not yet reached its lowest point in the oversold region, and the RSI is about to dip below its neutral mark of 50.
If the 50- and 200-day EMAs don’t serve as a safety net near the 50% Fibonacci retracement of the 0.6279-6870 uptrend at 0.6570, the price could plunge into the 0.6500-0.6520 zone, where the 61.8% Fibonacci level is located. Then, May’s low of 0.6464 could be the next target if downside pressures intensify. A decisive close below it could clear the way towards the 0.6400 mark.
To turn bullish again, the pair needs to rally above the March peak of 0.6666 and close above the broken support trendline. However, recovery attempts might be hindered by the limits at 0.6612 and 0.6640. Regardless, if the price surpasses its recent peak and exceeds the 23.6% Fibonacci level of 0.6728, it could potentially reach the psychological level of 0.6800. A continuation higher would shift all the attention to the December 2023 top of 0.6870.
Simply put, the latest downward trend in AUDUSD has breached crucial support levels, indicating an upcoming period of weakness. The sell-off is expected to gain extra impetus below the 0.6570 barrier.
Gold Price Drops Over 3.6% in 2 Days
The price of gold has fallen by more than 3.6% over 2 days, as indicated by today's XAU/USD chart. The day before yesterday, at the opening of the daily candle, the price of gold was $2421 per ounce, and yesterday at the close it was $2331.
This can be explained by market participants expecting higher Federal Reserve interest rates for a longer period. However, although gold is a hedge against inflation, it has two drawbacks:
→ It does not inherently generate income;
→ The gold market may be overvalued – after all, a historical peak was reached on May 20th.
Therefore, investors are increasingly paying attention to bonds – they also allow hedging against inflation, while their yields are rising.
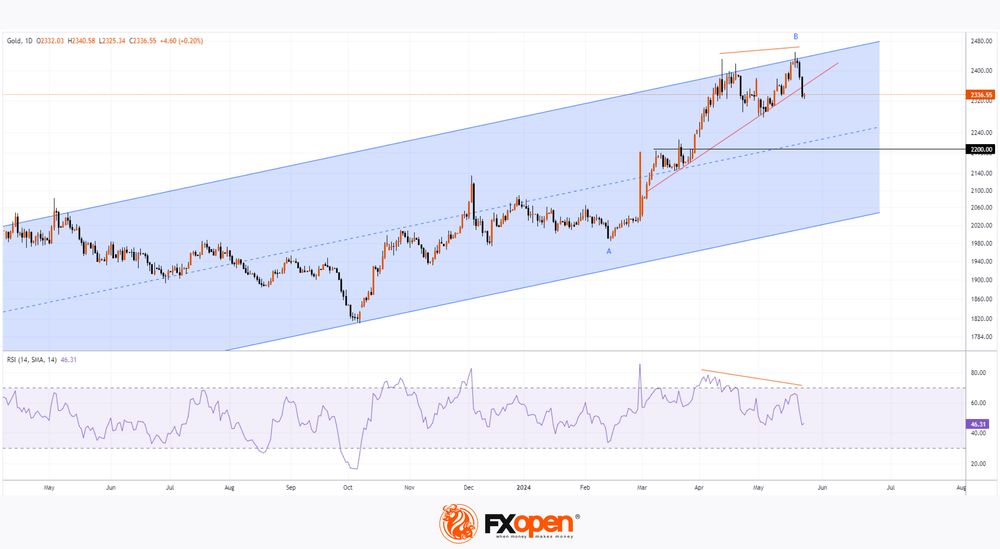
Technical analysis of the XAU/USD daily chart shows that:
→ The price of gold is in a long-term uptrend (shown in blue);
→ After reaching the upper boundary in mid-April, there was a pullback to around 2300 in early May.
Setting the historical record on May 20th also marked another achievement of the upper boundary of the channel. However:
→ Bulls failed to sustain the price above the mid-April peak;
→ There was a reversal from the upper boundary of the channel with the formation of bearish divergence on the RSI between the two peaks, which can be considered as a significant double top pattern, where the second top is slightly higher than the first.
Considering the speed of the gold price decline from the May 20th peak and the confidence of bears in breaking the trend line (shown in red), it is reasonable to assume that the market is vulnerable to forming a deeper correction within the ascending blue channel – it is possible that the correction will develop towards the median line of the blue channel.
It is worth noting the important support level at $2200:
→ This is a psychological level;
→ Previously, it served as resistance;
→ It is approximately at the 50% level of impulse A→B.
Start trading commodity CFDs with tight spreads. Open your trading account now or learn more about trading commodity CFDs with FXOpen.
This article represents the opinion of the Companies operating under the FXOpen brand only. It is not to be construed as an offer, solicitation, or recommendation with respect to products and services provided by the Companies operating under the FXOpen brand, nor is it to be considered financial advice.