Sample Category Title
S&P 500 Analysis: Good News is Bad News
Yesterday, S&P Global reported its Purchasing Managers' Index (PMI) values for the US, which exceeded expectations. According to ForexFactory:
→ Manufacturing PMI: actual = 50.9; expected = 50.0; previous = 50.0.
→ Services PMI: actual = 54.8 (the highest value since May 2023); expected = 51.2; previous = 51.3.
However, the high PMI values, indicating a healthy economy, led to a drop in the stock index. The S&P 500 index (US SPX 500 mini on FXOpen) fell by more than 1.5% following the publication.
What explains this case of "good news is bad news"?
The point is, amid high business activity, manufacturers reported rising prices for a range of resources, suggesting that goods inflation might strengthen in the coming months. Stock market participants might have interpreted this as a reason for the Federal Reserve to maintain high rates for a longer period – hence the sharp decline in the index.
"Companies remain cautious with respect to the economic outlook amid uncertainty over the future path of inflation and interest rates, and continue to cite worries over geopolitical instabilities and the presidential election," said Chris Williamson, Chief Business Economist at S&P Global Market Intelligence, in an interview with Reuters.
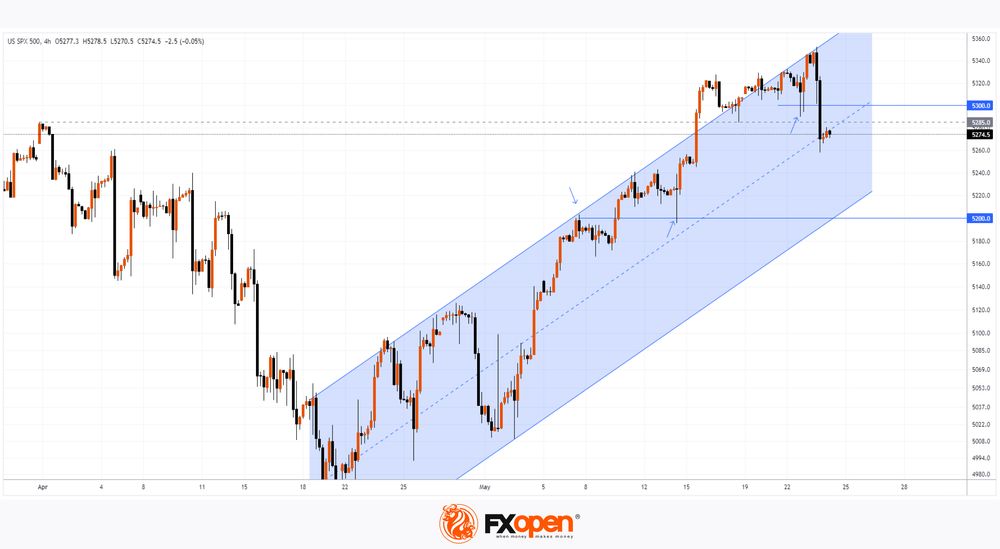
Technical analysis of the S&P 500 chart today (US SPX 500 mini on FXOpen) shows that:
→ the price has been forming an ascending channel since 19 April (shown in blue);
→ bulls failed to hold above the March high around the 5285 level (a bearish sign);
→ the psychological level of 5300, which showed signs of support this week, has now been breached and may act as resistance. Conversely, the 5200 level, after being breached, has shifted its role from resistance to support (as indicated by arrows).
So far, the bearish momentum that emerged yesterday following the PMI news release is being contained at the median line of the blue channel. But if sentiment does not change today, the median might be breached, and then the path to the lower boundary of the channel will open for the S&P 500 price (US SPX 500 mini on FXOpen).
Trade global index CFDs with zero commission and tight spreads. Open your FXOpen account now or learn more about trading index CFDs with FXOpen.
This article represents the opinion of the Companies operating under the FXOpen brand only. It is not to be construed as an offer, solicitation, or recommendation with respect to products and services provided by the Companies operating under the FXOpen brand, nor is it to be considered financial advice.
WTI Crude Oil Opens the Way for Bearish Actions
- WTI drops below diagonal line
- 20- and 200-day SMAs post death cross
- RSI flattens and Stochastics hold in oversold region
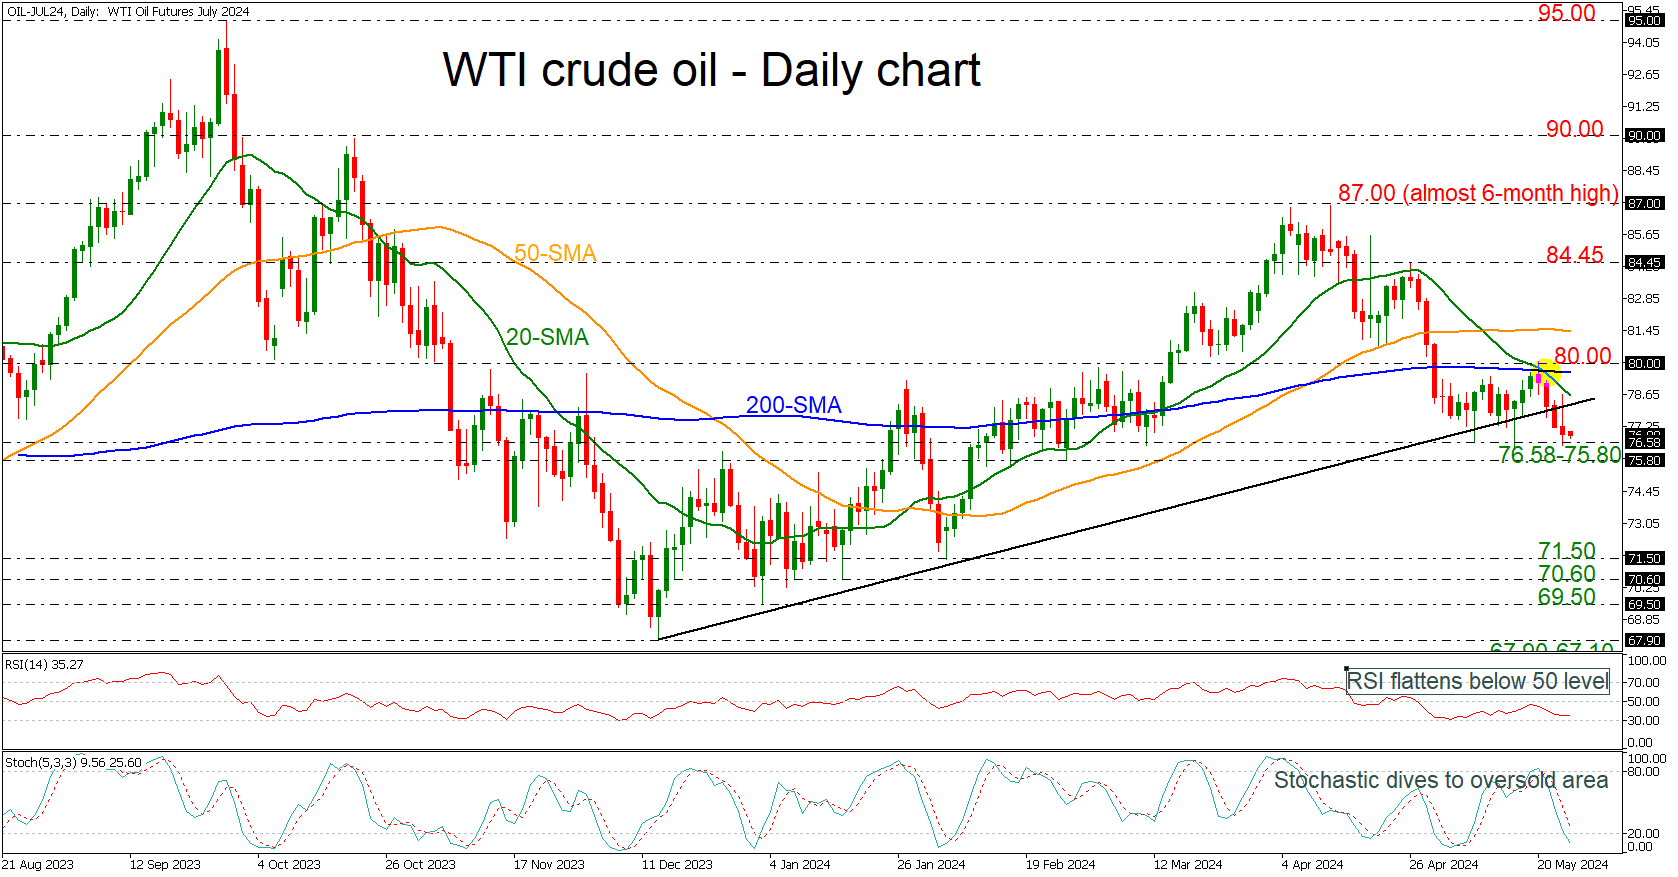
WTI crude oil with delivery in July is plummeting from the 80.00 level, which is acting as a strong resistance obstacle as well as the 200-day simple moving average (SMA). The commodity slipped beneath the medium-term ascending trend line, suggesting more declines in the market.
To attract new buyers, the bulls will have to surpass the nearby resistance of the uptrend line at 78.20 and move beyond the bearish cross within the 20- and the 200-day SMAs near the 80 level. Another successful battle there could see the price jumping to the 50-day SMA at 81.40.
However, the mixed technical indicators are not convincing traders of the bullish scenario. The narrowing SMAs indicate a potential downside move but the direction is unclear as the flattening RSI is suggesting the end of bearish action, but the stochastic oscillator keeps lacking power in the oversold region.
Hence, a downside correction could still be possible in the coming sessions. If the pair slumps below the 76.58-75.80 range, it could stabilize near the 71.50 mark. Otherwise, the sell-off could expand towards the 70.60 support disappointing medium-term traders.
Summing up, oil prices have not eliminated downside risks yet, as they remain beneath important barriers. To boost buying confidence, WTI will need to crawl above 80.00 level.
GBP/JPY Daily Outlook
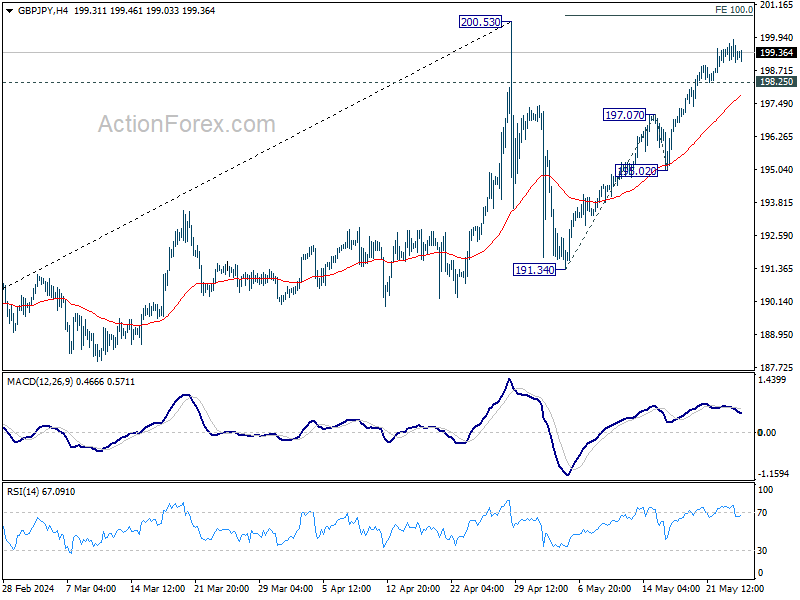
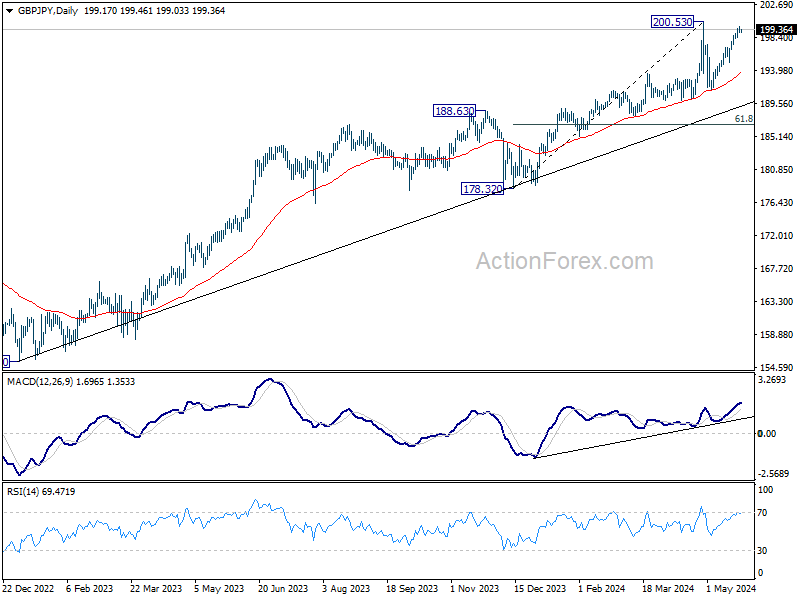
Daily Pivots: (S1) 198.20; (P) 198.56; (R1) 198.84; More...
Intraday bias in GBP/JPY remains mildly on the upside. Current rise from 191.34, as the second leg of the corrective pattern from 200.53, should target 100% projection of 191.34 to 180.07 from 195.02 at 200.75. But upside should be limited there. On the downside, below 198.25 minor support will turn intraday bias neutral first. Further break of 195.02 will argue that the third leg has started, and target 191.34 support and possibly below.
In the bigger picture, a medium term top could be in place at 200.53 after breaching 199.80 long term fibonacci level. As long as 55 W EMA (now at 184.47) holds, fall from there is seen as correcting the rise from 178.32 only. However, sustained break of 55 W EMA will argue that larger scale correction is underway and target 178.32 support.
EUR/JPY Daily Outlook
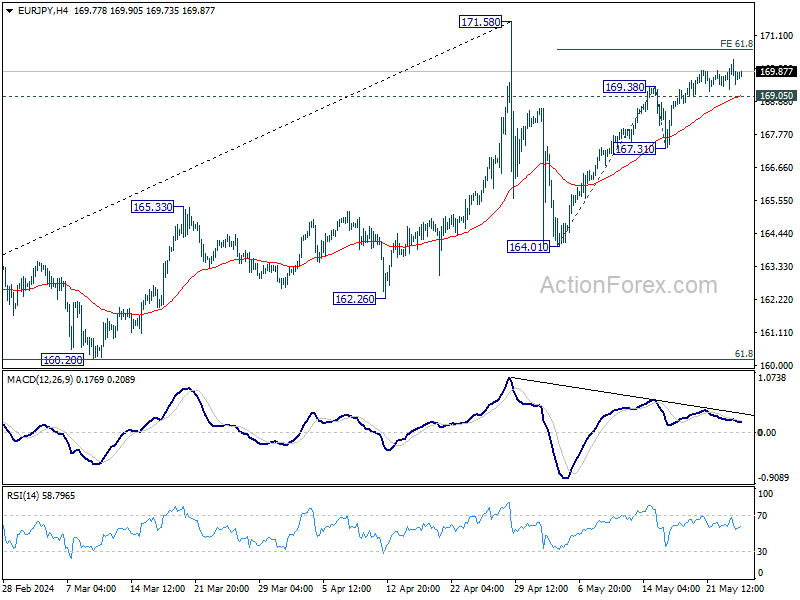
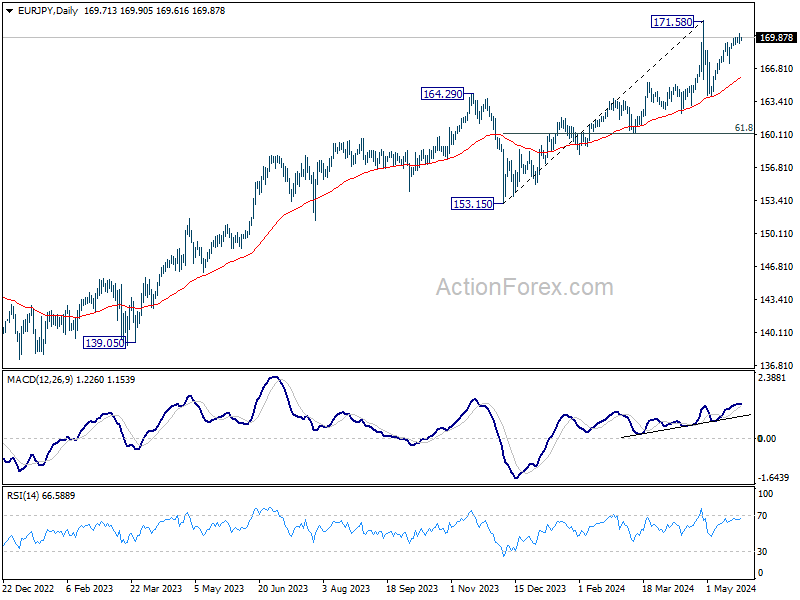
Daily Pivots: (S1) 169.26; (P) 169.79; (R1)170.29; More...
No change in EUR/JPY's outlook. Further rise is mildly in favor despite loss of upside momentum. Rise from 164.01, as the second leg of the corrective pattern from 171.58, would target 61.8% projection of 164.01 to 169.38 from 167.31 at 170.62. On the downside, break of 169.05 minor support will intraday bias neutral first. Further break of 167.31 should turn bias back to the downside to start the third leg towards 164.01.
In the bigger picture, a medium top could be formed at 171.58 after brief breach of 169.96 (2008 high). As long as 55 W EMA (now at 158.70) holds, fall from there is seen as correcting the rise from 153.15 only. However, sustained break of 55 W EMA will argue that larger scale correction is underway and target 153.15 support.
EUR/GBP Daily Outlook
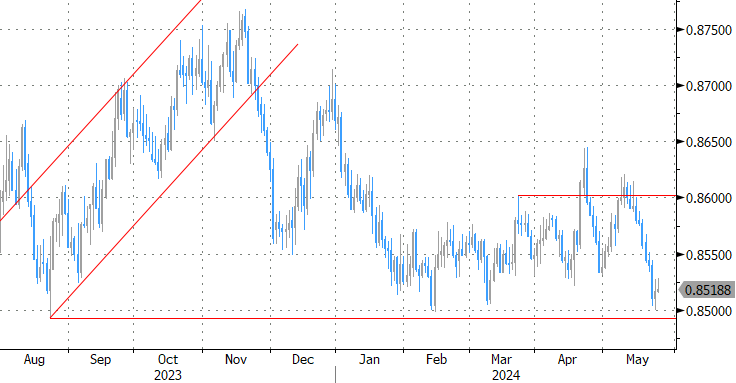
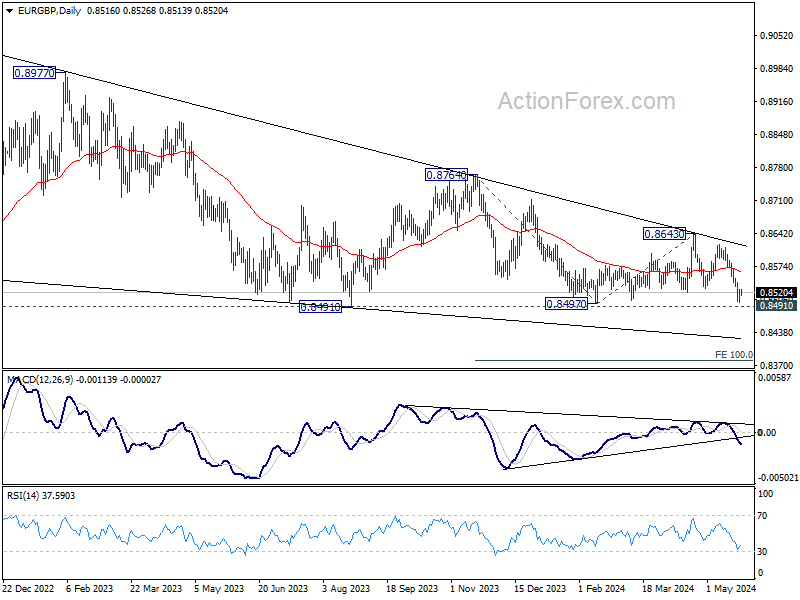
Daily Pivots: (S1) 0.8502; (P) 0.8515; (R1) 0.8529; More...
Further decline is still in favor with 0.8540 minor resistance intact. Firm break of 0.8491/7 support zone will confirm larger down trend resumption. Next target is 0.8376 projection level next. On the upside though, above 0.8540 minor resistance will delay the bearish case and turn intraday bias neutral first.
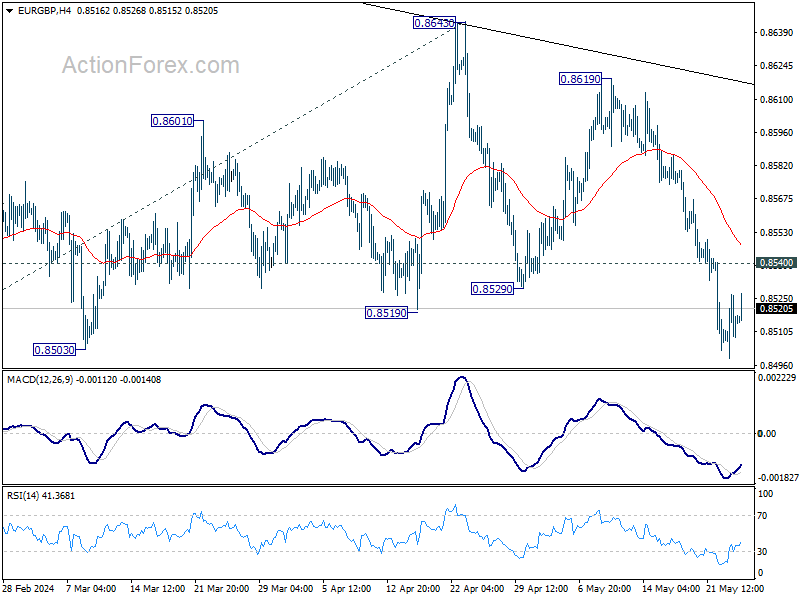
In the bigger picture, outlook remains bearish as EUR/GBP is capped below medium term falling trendline. That is, down trend from 0.9267 (2022 high) is still in progress. Firm break of 0.8491/7 will target 100% projection of 0.8764 to 0.8497 from 0.8643 at 0.8376.
EUR/AUD Daily Outlook
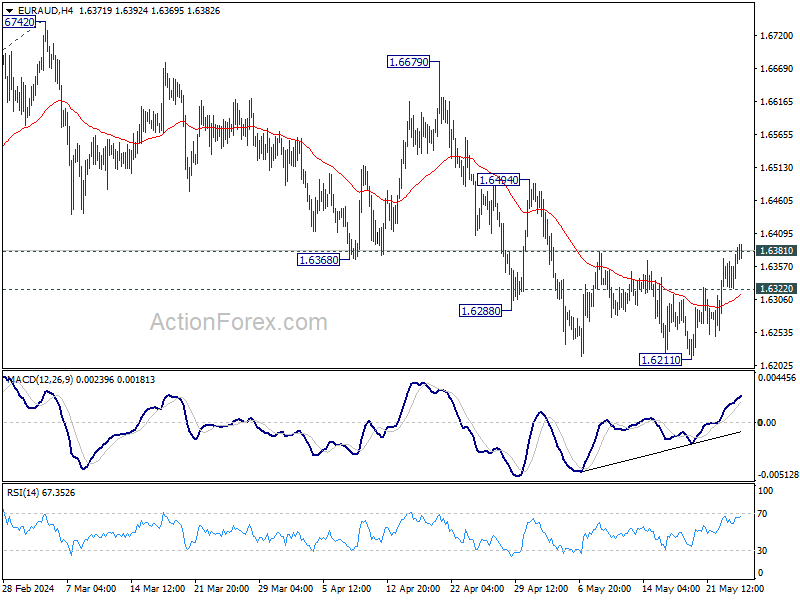
Daily Pivots: (S1) 1.6337; (P) 1.6359; (R1) 1.6394; More...
Breach of 1.6381 resistance suggests short term bottoming at 1.6211. Intraday bias is back on the upside for recovery to 55 D EMA (now at 1.6411) and above. On the downside, though, below 1.6322 minor support will bring retest of 1.6211 support instead.
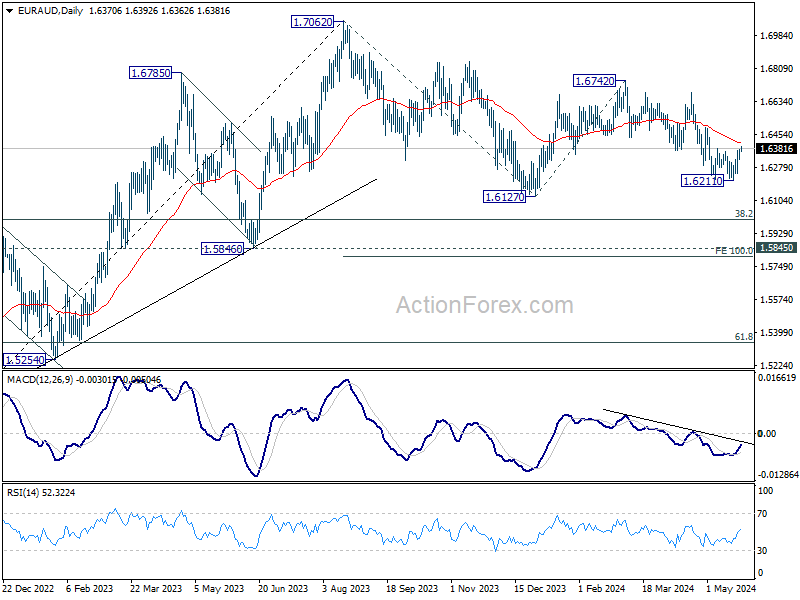
In the bigger picture, fall from 1.7062 medium term top is seen as a correction to the up trend from 1.4281 (2022 low). In case of deeper fall, strong support is expected around 1.5846 and 38.2% retracement of 1.4281 to 1.7062 at 1.6000 to bring rebound. Break of 1.7062 is in favor as a later stage.
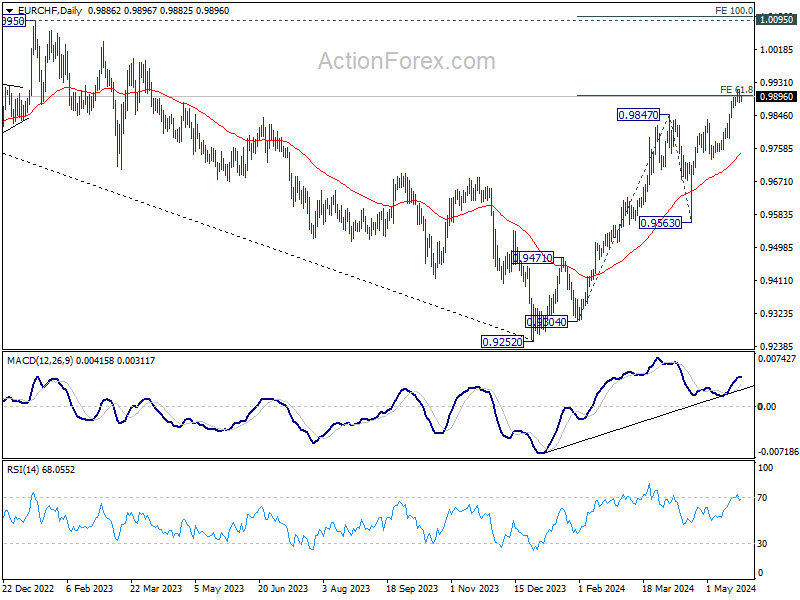
EUR/CHF Daily Outlook
Daily Pivots: (S1) 0.9875; (P) 0.9896; (R1) 0.9909; More....
Intraday bias in EUR/CHF is turned neutral again as it retreated after edging higher to 0.9914. On the downside, break of 0.9876 minor support will turn bias back to the downside for retreat, back to 0.9728/9835 support zone. On the upside, sustained break of 61.8% projection of 0.9304 to 0.9847 from 0.9563 at 0.9899 will pave the way to 100% projection at 1.0106, which is slightly above 1.0095 key structural resistance.
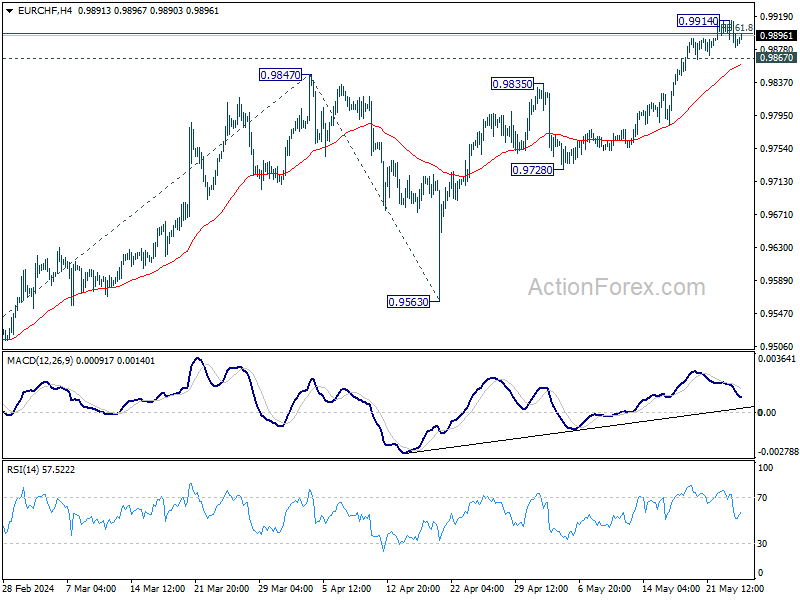
In the bigger picture, as long as 0.9563 support holds, rise from 0.9252 medium term bottom is still in favor to continue. Next target is 38.2% retracement of 1.2004 (2018 high) to 0.9252 (2023 low) at 1.0303, even as a correction to the down trend from 1.2004.
Gold Price and Crude Oil Price Signal Bearish Acceleration
Gold price started a sharp decline from $2,450. Crude oil prices declined steadily below the $80.00 support and moved into a bearish zone.
Important Takeaways for Gold and Oil Prices Analysis Today
- Gold price climbed higher toward the $2,450 zone before there was a sharp decline against the US Dollar.
- A key bearish trend line is forming with resistance near $2,375 on the hourly chart of gold at FXOpen.
- Crude oil prices extended downsides below the $78.00 support zone.
- A major bearish trend line is forming with resistance near $78.00 on the hourly chart of XTI/USD at FXOpen.
Gold Price Technical Analysis
On the hourly chart of Gold at FXOpen, the price rallied heavily above the $2,350 resistance. The price even spiked above $2,425 before the bears appeared.
A high was formed near $2,450 before there was a major decline. There was a move below the $2,400 support level. The bears even pushed the price below the $2,355 support and the 50-hour simple moving average.
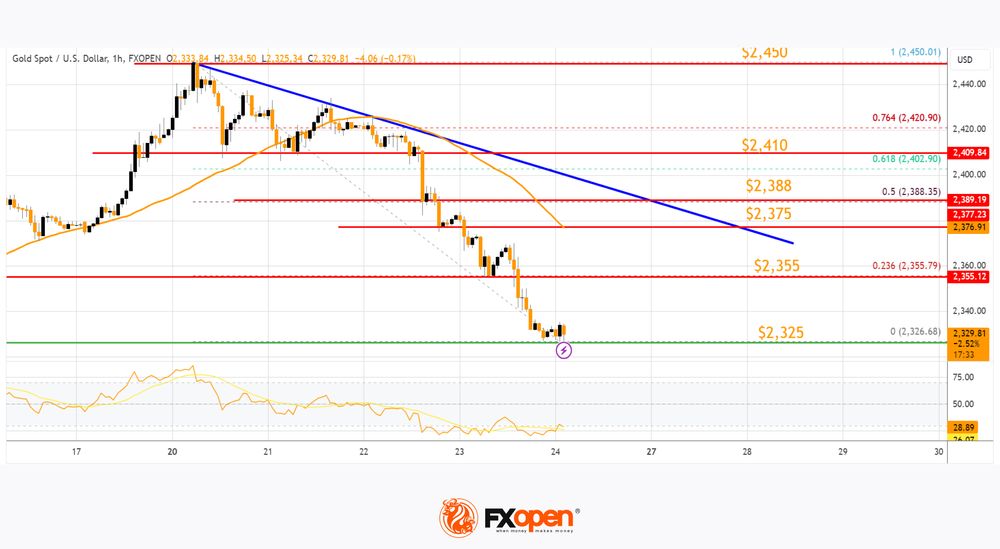
It tested the $2,325 zone. A low is formed near $2,326 and the price is now showing bearish signs. Immediate resistance is near the 23.6% Fib retracement level of the downward move from the $2,450 swing high to the $2,326 low at $2,355.
The next major resistance is near a bearish trend line at $2,375. The trend line is close to the 50-hour simple moving average.
The main resistance could be $2,388 and the 50% Fib retracement level of the downward move from the $2,450 swing high to the $2,326 low, above which the price could test the $2,410 resistance. The next major resistance is $2,450.
An upside break above the $2,450 resistance could send Gold price toward $2,480. Any more gains may perhaps set the pace for an increase toward the $2,500 level.
Initial support on the downside is near the $2,325 level. The first major support is near the $2,312 level. If there is a downside break below the $2,312 support, the price might decline further. In the stated case, the price might drop toward the $2,250 support.
Oil Price Technical Analysis
On the hourly chart of WTI Crude Oil at FXOpen, the price struggled to continue higher above $80.00 against the US Dollar. The price formed a short-term top and started a fresh decline below $78.00.
There was a steady decline below the $77.40 pivot level. The bears even pushed the price below $76.50 and the 50-hour simple moving average. Finally, the price tested the $76.30 zone. The recent swing low was formed near $76.31, and the price is now consolidating losses.
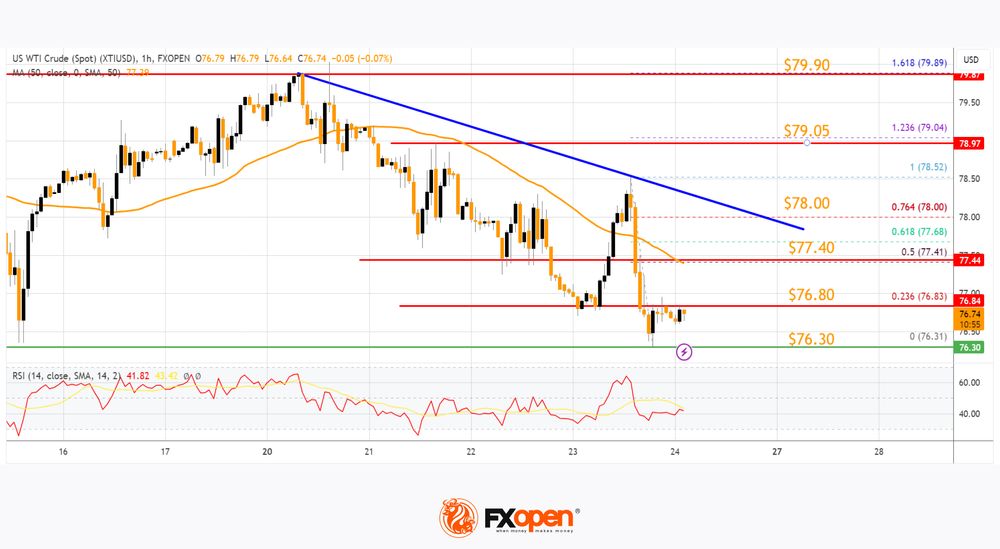
Immediate support is near the $76.30 level. The next major support on the WTI crude oil chart is near $75.00. If there is a downside break, the price might decline toward $73.50. Any more losses may perhaps open the doors for a move toward the $72.00 support zone.
On the upside, immediate resistance is near the 23.6% Fib retracement level of the downward move from the $78.52 swing high to the $76.31 low at $76.80.
The next resistance is near the 50-hour simple moving average and the 50% Fib retracement level of the downward move from the $78.52 swing high to the $76.31 low at $77.40. The main resistance is near a trend line at $78.00.
A clear move above the trend line resistance could send the price toward $79.05. The next key resistance is near $79.90. If the price climbs further higher, it could face resistance near $81.20. Any more gains might send the price toward the $82.00 level.
Start trading commodity CFDs with tight spreads. Open your trading account now or learn more about trading commodity CFDs with FXOpen.
This article represents the opinion of the Companies operating under the FXOpen brand only. It is not to be construed as an offer, solicitation, or recommendation with respect to products and services provided by the Companies operating under the FXOpen brand, nor is it to be considered financial advice.
USD/JPY: JPY Weakness Back in Vogue At Least for the Short-Term
- The 10-year JGB yield has continued to push higher to 1% together with 3-month and 6-month overnight indexed swap (OIS) rates in Japan at 0.12% to 0.17%
- The JPY has failed to strengthen despite the bullish movements in JGB yields and OIS rates.
- Broad-based US dollar strength and the deceleration in the lagging core-core CPI inflation trend are the main drivers of short-term JPY weakness.
- Watch the key short-term support of 155.90 on the USD/JPY.
Since our last publication, the price actions of USD/JPY have continued to hold above its 20-day moving average acting as a support at 155.90 at this juncture despite a rise in both the 10-year and 30-year Japanese Government Bonds (JGB) yields since the start of this week to 1% (its highest level in almost 12 years) and 2.17% respectively (see Fig 1).
JGB yields and overnight index swap rates are pointing to a possible BoJ rate hike in July
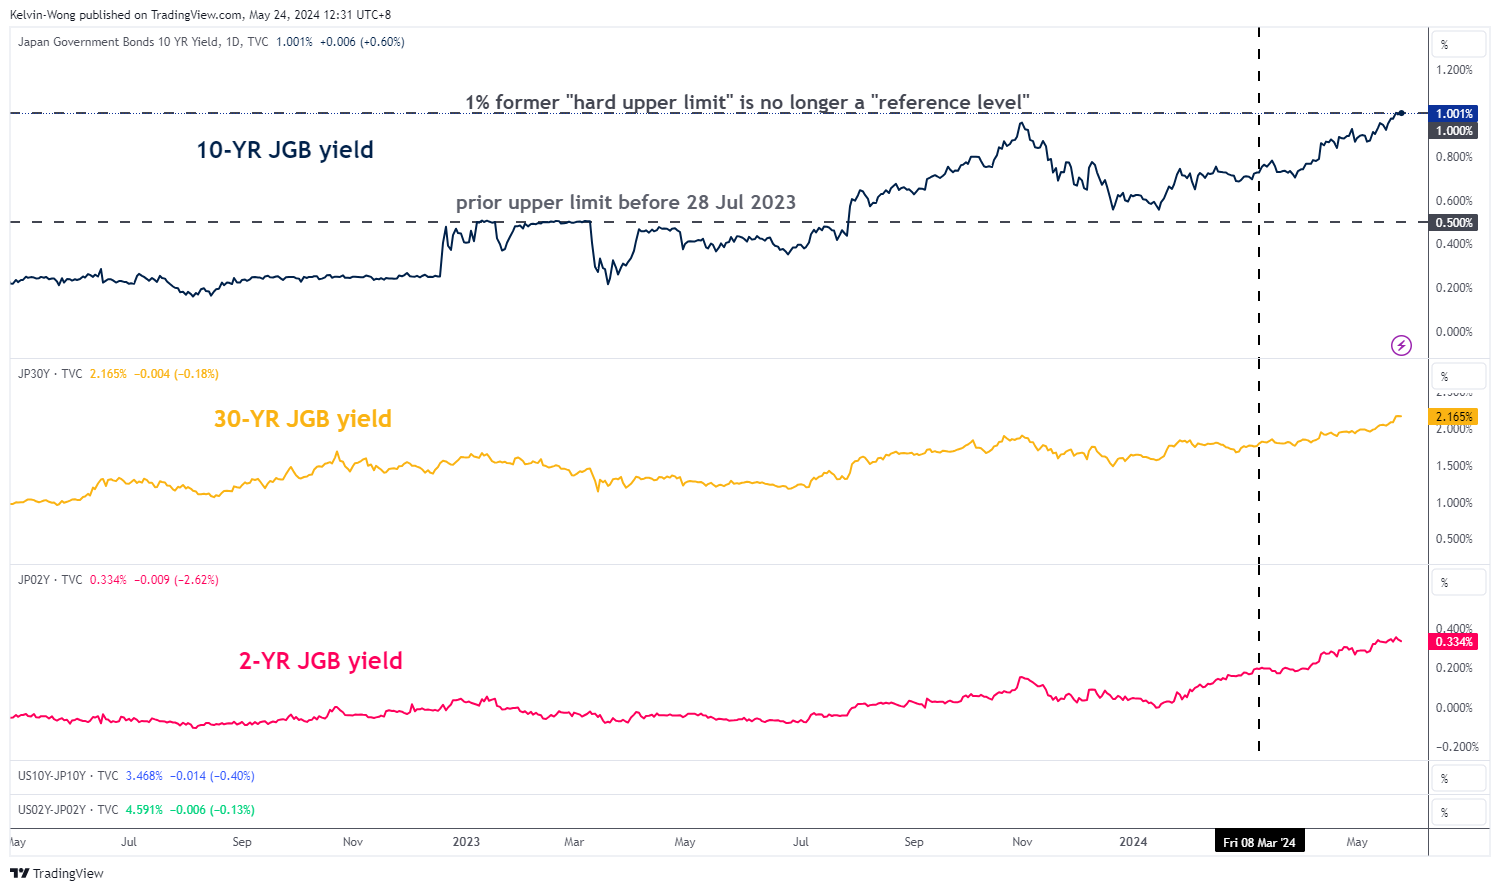
Fig 1: JGB yields medium-term & major trends as of 24 May 2024 (Source: TradingView, click to enlarge chart)
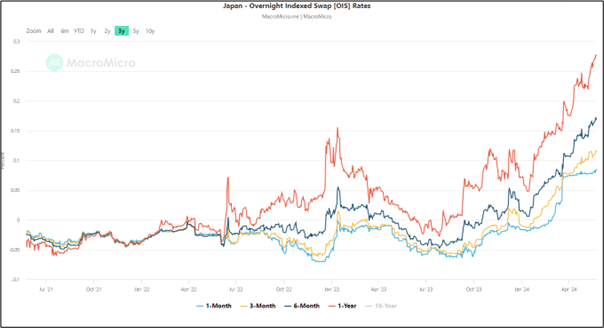
Fig 2: Japan Overnight Indexed Swap Rates major trends as of 24 May 2024 (Source: MacroMicro, click to enlarge chart)
Even the overnight indexed swap rates (OIS) for 3-month and 6-month have risen at a faster pace to 0.12% to 0.17% over the 1-month OIS and their spreads have widened significantly which suggests the OIS market is pricing a higher chance of another Bank of Japan (BoJ) interest rate hike in the July meeting (see Fig 2).
So, what is causing the failure of the yen to stage a short-term bullish reversal?
Deceleration of consumer inflationary trend in Japan
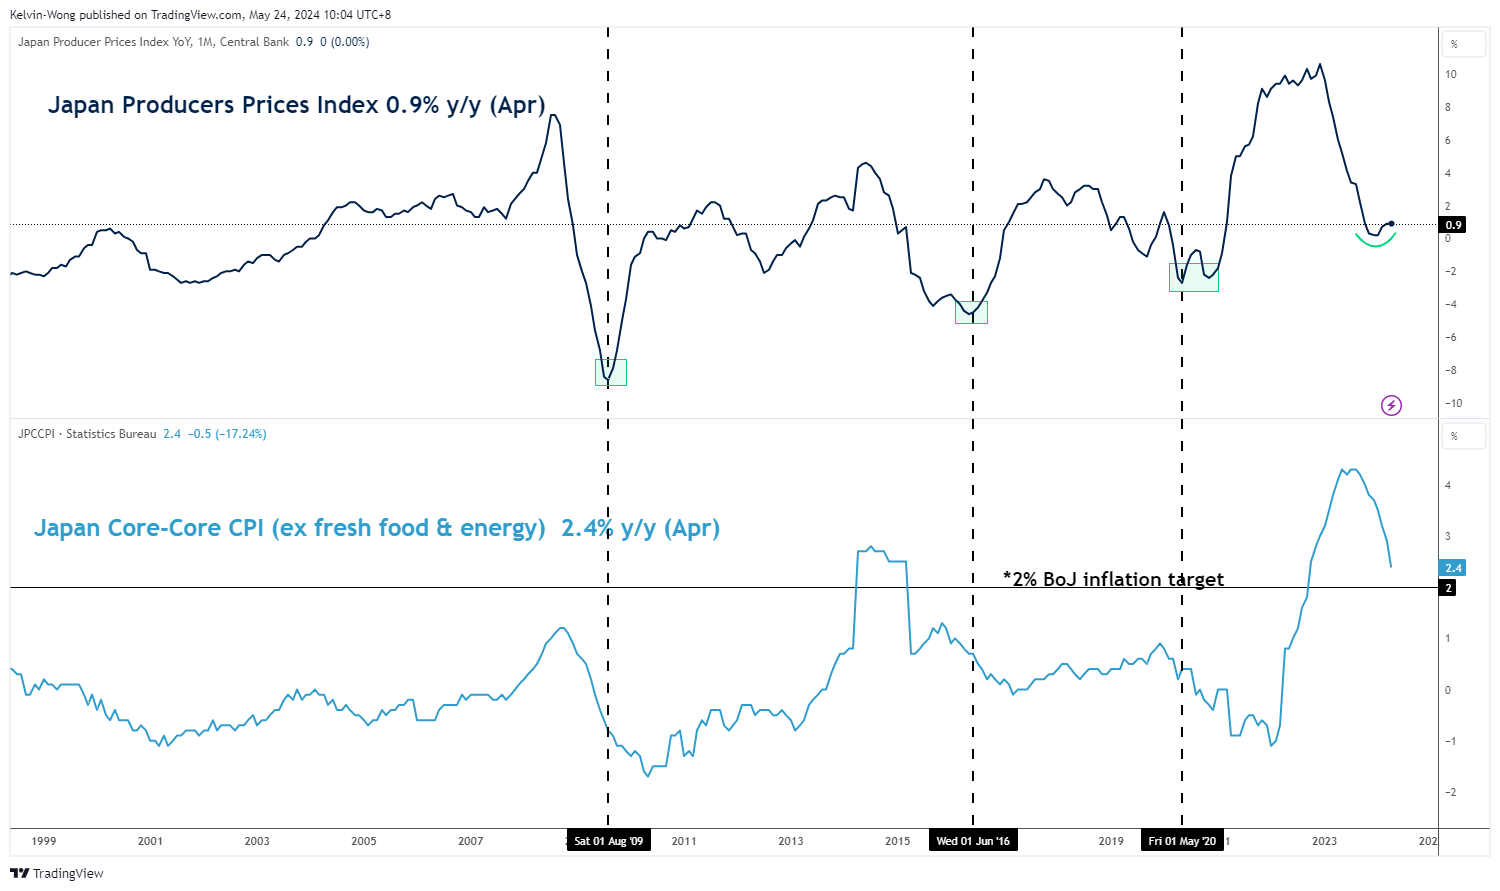
Fig 3: Japan Producer & Consumer Price Indices as of April 2024 (Source: TradingView, click to enlarge chart)
Inflation data is one of the key matrices to guide BoJ’s path of normalizing its decade-long ultra-accommodative monetary policy after ending its short-term negative interest rate in March.
BoJ Governor Ueda has implied in his public speeches that an interest rate hike cycle in Japan can only take shape if the inflation trend maintains a virtuous cycle of sustained, stable achievement of BoJ’s 2% target coupled with strong wage growth.
So far, Japan’s producer prices (PPI) have started to show signs of turning the corner after close to a year of deceleration from December 2022 to January 2024. In the past four months, the PPI has risen to 0.9% y/y in April from 0.2% y/y printed in January.
An interesting point to note is that the PPI tends to bottom out ahead of Japan’s consumer inflation as seen in the three past periods of August 2009, June 2016, and May 2020 (see Fig 3).
So far, the Japan core-core CPI (excludes fresh food and energy) which is closely watched by BoJ as a key gauge of broader inflation trends in Japan has failed to turn around and continued its path of deceleration since August 2023. It rose at a slower pace in April to 2.4% y/y from 2.9% y/y in March.
Broad-based US dollar strength revival
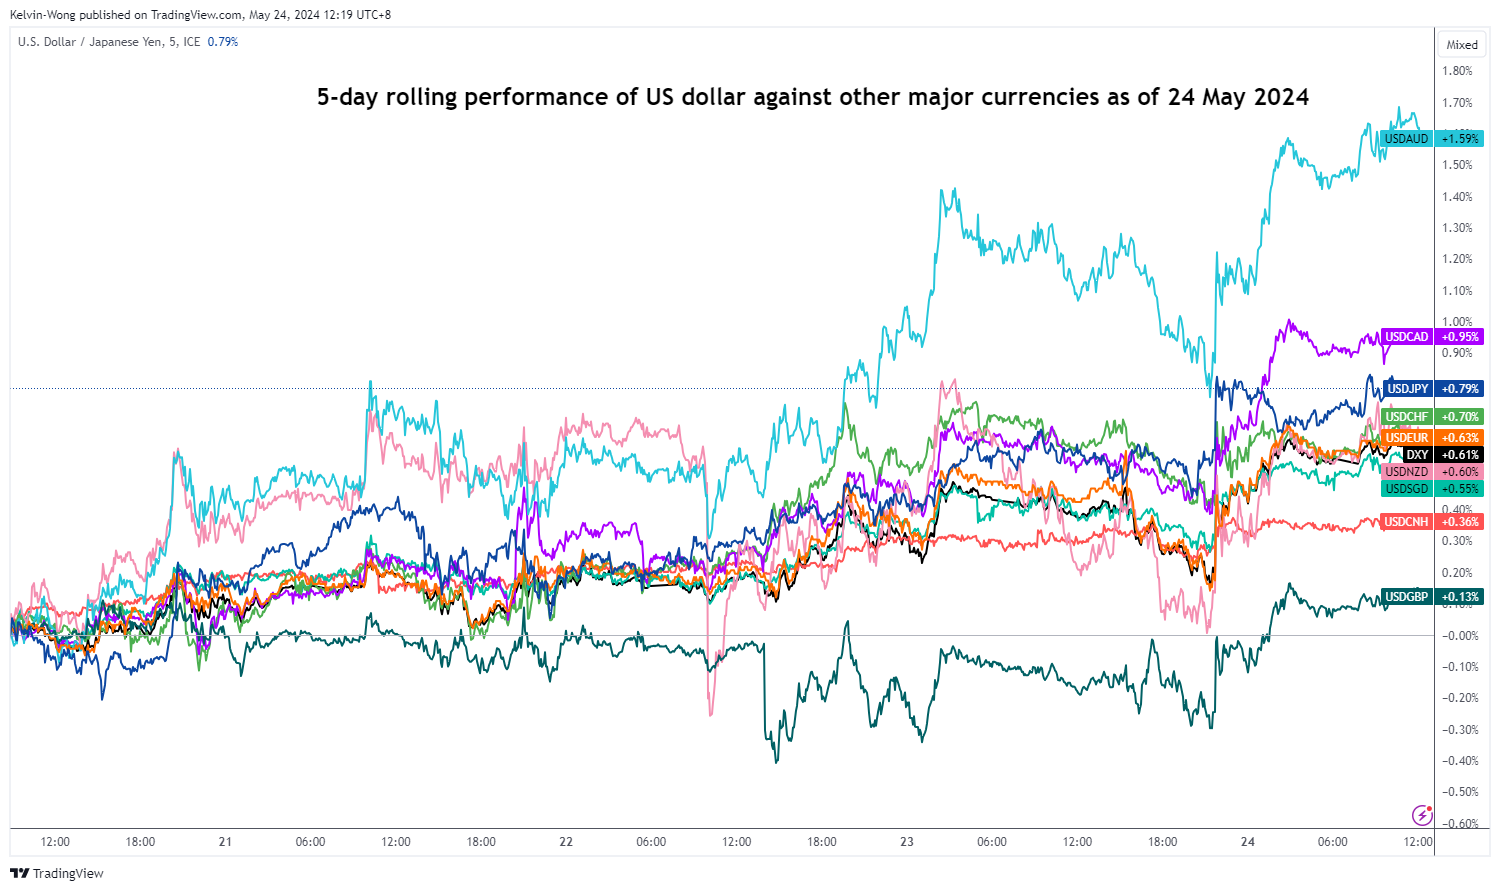
Fig 4: 5-day rolling performance of the US dollar against major currencies of 24 May 2024 (Source: TradingView, click to enlarge chart)
The US dollar has strengthened across the board against other major currencies reinforced by a further recovery in the US Treasury yields in place since last Friday, 17 May, and the 10-year yield is now just a whisker away from a key 4.50% technical level after it rallied by 16 basis points from last Wednesday low of 4.31% to yesterday, 23 May closing level of 4.48%.
So far, based on a 5-day rolling performance basis, the JPY is the third major weakest currency against the US dollar with the USD/JPY recording a gain of +0.8% at this time of the writing and surpassing the return of the US Dollar Index at +0.6% (see Fig 4).
USD/JPY has held above its 20-day moving average for 5 consecutive days
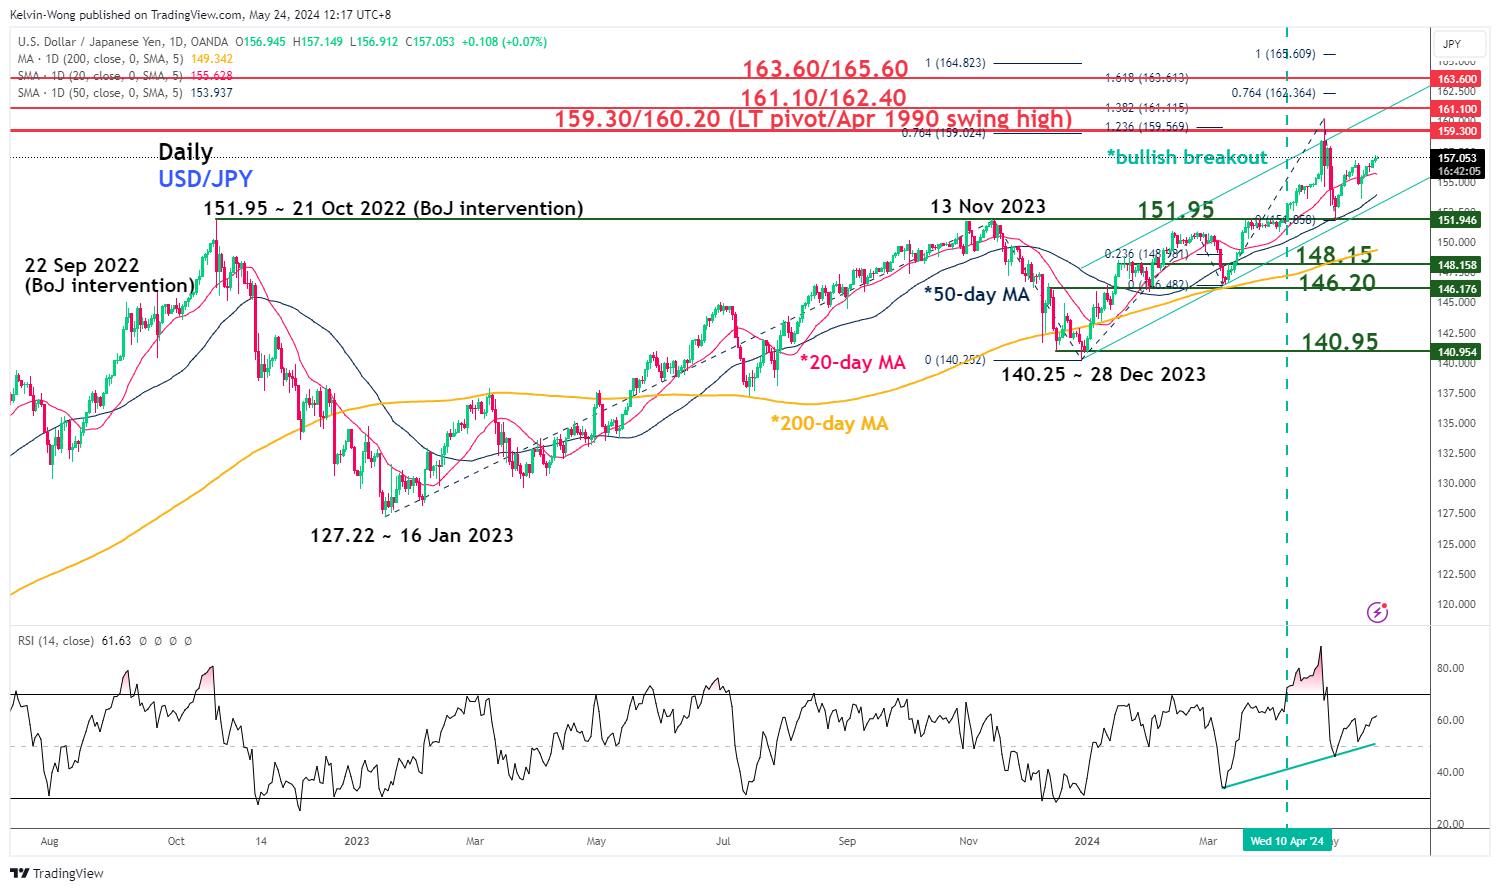
Fig 5: USD/JPY medium-term & major trends as of 24 May 2024 (Source: TradingView, click to enlarge chart)
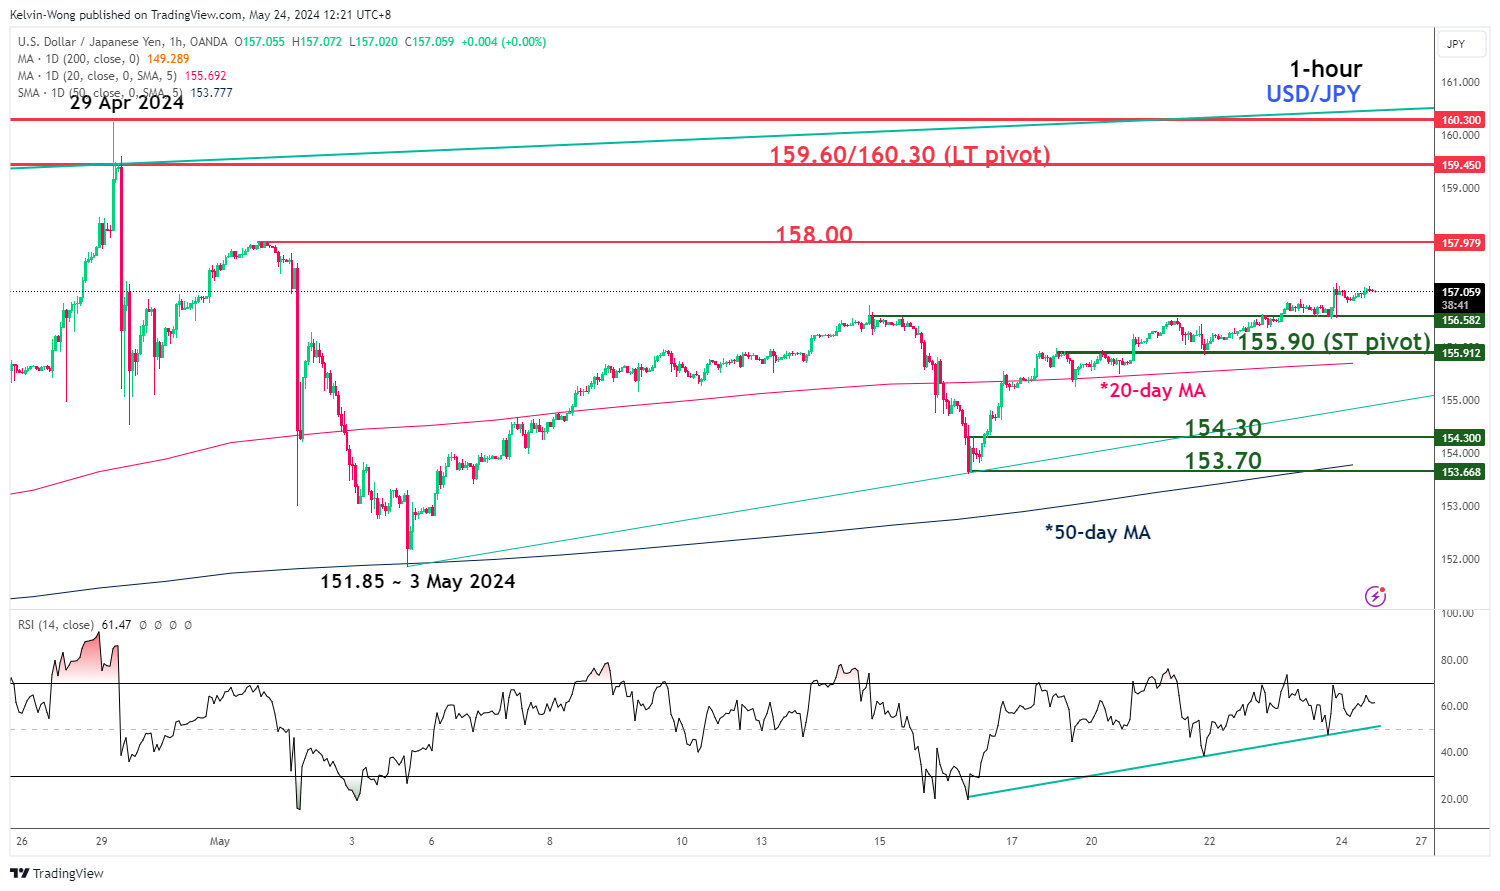
Fig 6: USD/JPY short-term trend as of 24 May 2024 (Source: TradingView, click to enlarge chart)
The short-term uptrend phase of the USD/JPY remains intact, supported by a rising daily RSI momentum indicator that is above the 50 level, and has yet to reach its overbought level of above 70 (see Fig 5)
Watch the key short-term pivotal support at 155.90 (also the 20-day moving average) to maintain the short-term bullish tone for the next near-term resistance to come in at 158.00 and above it sees the 159.60/160.30 long-term pivotal resistance zone (see Fig 6).
On the other hand, a break below 155.90 invalidates the bullish bias for a minor corrective slide to expose the next near-term supports at 154.30 and 153.70 (also the 50-day moving average).
Japanese Inflation Falling Towards BoJ 2% Inflation Target
Markets
Core bonds fell yesterday with German Bunds marginally underperforming US Treasuries. A solid European May services PMI (unchanged at 53.3) and an improving manufacturing one (47.4 from 45.7) coupled with record-matching Q1 wage negotiations (picking up from 4.5% to 4.7%) hurled German yields between 4.2 and 7.4 bps higher. The front of end of the curve - in swaps as well - rose to new YtD highs. The German 10-yr yield attacked 2.59% resistance and finished just a few bps shy of the April 2024 high. US rates swung 4.3 to 6.7 bps higher with similar front-end underperformance in response to strong country PMIs. Reversing a slowdown over the prior three months, service sector activity (54.8 from 51.3) was the strongest in a year as new orders picked up. Increased manufacturing output and a moderating drag from new orders lifted the headline figure from 50 to 50.9 in May. Sharply rising input prices, especially in manufacturing, led to higher selling prices. PMI owner S&P Global concluded that “rates of inflation for costs and selling prices are now somewhat elevated by pre-pandemic standards in both sectors to suggest that the final mile down to the Fed’s 2% target still seems elusive.” The dollar’s sharp intraday U-turn resulted in the fourth daily loss for EUR/USD this week. The pair finished at 1.0815 after trading as high as 1.086. DXY moved beyond 105. A setback in the UK services PMI offered EUR/GBP (0.8516) some breathing room after testing the critical 0.85 support area. PM Sunak’ surprise announcement of general elections on July 4 already left no marked impact on sterling. The Tories have been trailing the opposition Labour party for a very long time and their defeat seems discounted for now. US stock markets are showing signs of exhaustion with bearish engulfers popping up in the S&P500 and Nasdaq. Both indices were flirting overbought territory in recent days. The upcoming long weekend in the US for Memorial Day on Monday may have served as an excuse to take some chips off the table as well. Against this background we doubt whether US durable goods orders will move markets in a significant way. Fed Waller’s keynote speech on the neutral rate is worth mentioning though. Following yesterday’s jump we don’t expect US rates to show similar vigour ahead of the (long) weekend but the downside for now looks well protected. Closing the week with new YtD highs in European (short-term) rates would be technically important. EUR/USD is testing support at 1.0811. Breaking below would bring the pair back within the downward 2024 trend channel. EUR/GBP jumped towards 0.853 before paring gains after the UK released disastrous retail sales this morning. We nonetheless believe the pair is ready for a gradual recovery within the sideways 0.85-0.87 trading range again. The UK is also headed for an extended weekend (Spring bank holiday on Monday).
News & Views
UK consumer confidence as measured by Growth for Knowledge improved further in May, from -19 to -17, the best level since December 2021 and beating -18 consensus. Details showed personal financial prospects, savings and the general economic outlook all improving whereas willingness to buy big-ticket items declined. The latter reinforces the fact that the cost-of-living crisis is still a day-to-day reality for all of us according the GfK. Client strategy director Staton added though that the latest drop in headline inflation and the prospect of interest-rate cuts in due course suggest that the trend is certainly positive after a long period of stasis. All in all, consumers are clearly sensing that conditions are improving, anticipating further growth in confidence in the months to come.
The pace of national Japanese headline inflation remained unchanged in April at 0.2% M/M. In Y/Y-terms, inflation slowed from 2.7% to 2.5%. The main contributor was a deceleration in processed food prices. The Bank of Japan’s preferred ex fresh food gauge was flat M/M, with the Y/Y-measure extending its disinflationary trend from 2.6% to 2.2%. Services inflation declined by 0.1% M/M with Y/Y growth slowing from 2.1% to 1.7%. Japanese inflation is falling towards the BoJ 2% inflation target but today’s data are unlikely to derail plans to very gradually increase the policy rate with strong wage gains (>5% for large companies) expected to spur spending and inflation.
Graphs
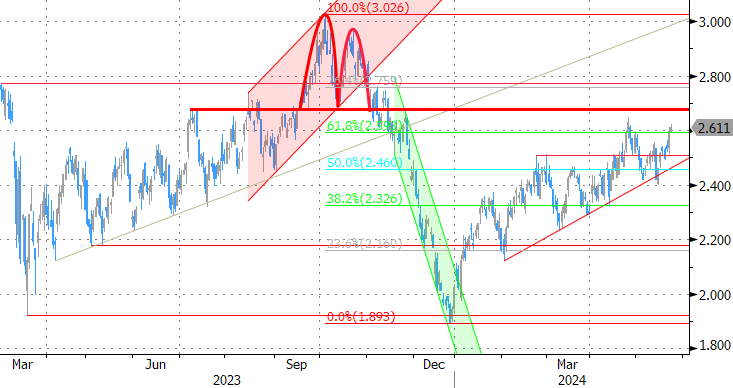
GE 10y yield
ECB President Lagarde clearly hinted at a summer (June) rate cut which has broad backing. EMU disinflation continued in April and brought headline CPI closer to the 2% target. Together with weak growth momentum, this gives backing to deliver a first 25 bps rate cut. A more bumpy inflation path in H2 2024 and the Fed’s higher for longer strategy make follow-up moves difficult. Markets have come to terms with that.
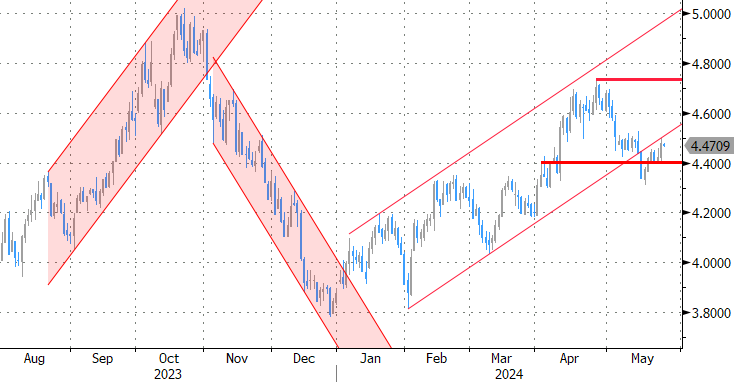
US 10y yield
The Fed in May acknowledged the lack of progress towards the 2% inflation objective, but Fed’s Powell left the door open for rate cuts later this year. Soft US ISM’s and weaker than expected payrolls supported markets’ hope on a first cut post summer, triggering a correction off YTD peak levels. Sticky inflation suggests any rate cut will be a tough balancing act. 4.37% (38% retracement Dec/April) already might prove strong support for the US 10-y yield.
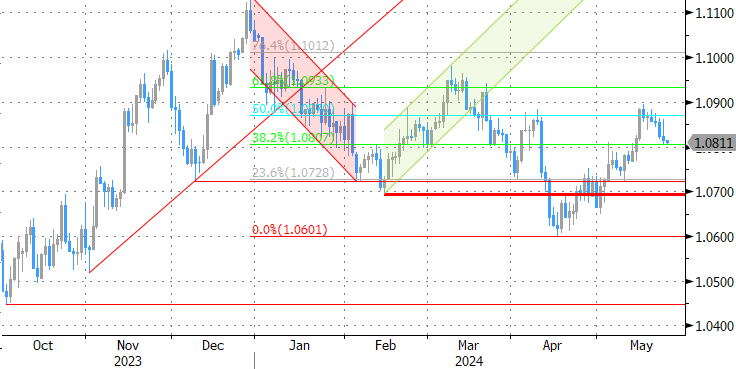
EUR/USD
Economic divergence, a likely desynchronized rate cut cycle with the ECB exceptionally taking the lead and higher than expected US CPI data pushed EUR/USD to the 1.06 area. From there, better EMU data gave the euro some breathing space. The dollar lost further momentum on softer than expected early May US data. Some further consolidation in the 1.07/1.09 are might be on the cards short-term.
EUR/GBP
Debate at the Bank of England is focused at the timing of rate cuts. Most BoE members align with the ECB rather than with Fed view but slower than expected April disinflation and a surprise general election on July 4 complicated matters. A June cut in line with the ECB looks improbable. Sterling extends a recent bull rally. A test of EUR/GBP’s 2024 YtD low (0.8489) is possible. We expect this important support level to hold.