Sample Category Title
Australian Westpac consumer sentiment falls -0.3% mom amid budget disappointment
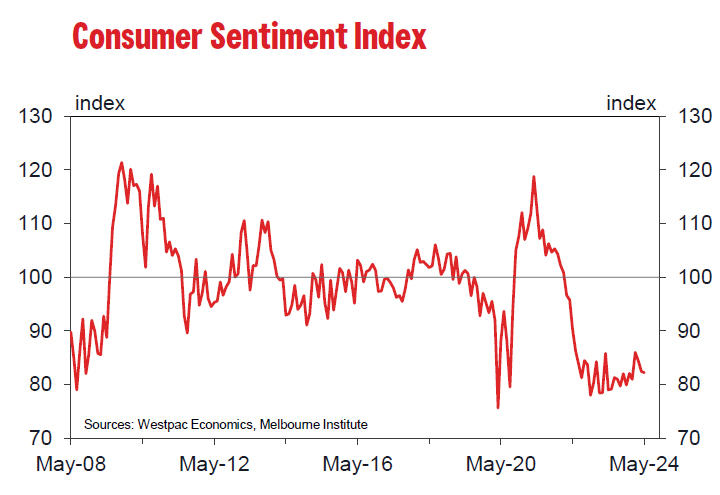
Australia Westpac Consumer Sentiment index fell by -0.3% mom to 82.2 in May. Westpac highlighted that the primary takeaways from the May survey are "no let-up in the weak consumer environment" and the cautious mindset of consumers. Consumers are more inclined to use funds from fiscal measures to repair their finances rather than go on spending sprees, which aligns with RBA's efforts to bring inflation back to target.
The May survey, conducted during budget week, provided a clear comparison of sentiment before and after the budget announcement. Sentiment among those surveyed before the budget was relatively optimistic, with an index reading of 86.8, marking a 5.3% increase from April. However, sentiment plummeted to 76.6 after the budget announcement, reflecting a 7% decline from April. This -11.8% drop in sentiment post-budget contrasts with a -7.4% decline observed last year.
Fed officials express caution on inflation, uncertainty over rate cuts
Fed Governor Philip Jefferson issued a cautious message in a speech last night, stating that while April's inflation data was "encouraging," it remains "too early to tell" if the recent slowdown in disinflation will be "long lasting." He described current monetary policy as restrictive and declined to predict whether rate cuts will happen this year. He emphasized the importance of continuing to closely monitor incoming economic data, the outlook, and the balance of risks.
Separately, Cleveland Fed President Loretta Mester told Bloomberg Television that she is reconsidering her earlier forecast of three interest rate cuts this year. Although not her "base case," Mester noted that if progress on reducing inflation stalls or reverses, Fed is "well positioned" to increase rates if necessary.
San Francisco Fed President Mary Daly also shared her views, expressing doubt about achieving the 2% inflation target in the near term. Daly highlighted that while there are expectations for improvement in shelter inflation, the progress is not expected to be rapid.
Bitcoin’s Resurgence: Price Climbs with Renewed Momentum
Key Highlights
- Bitcoin price climbed higher steadily higher above the $67,500 and $70,000 resistance levels.
- BTC is trading well above a key bullish trend line with support near $63,850 on the 4-hour chart.
- Crude oil prices found support near $76.80 and started a recovery wave.
- Gold surged toward the $2,450 level before a minor pullback.
Bitcoin Price Technical Analysis
Bitcoin price formed a base and started a fresh increase above $63,500. BTC/USD climbed higher above the $66,500 and $68,500 resistance levels to move into a positive zone.
Looking at the 4-hour chart, the price settled well above the 100 simple moving average (red, 4 hours) and the 200 simple moving average (green, 4 hours). The price also surpassed $70,000 and traded as high as $72,084.
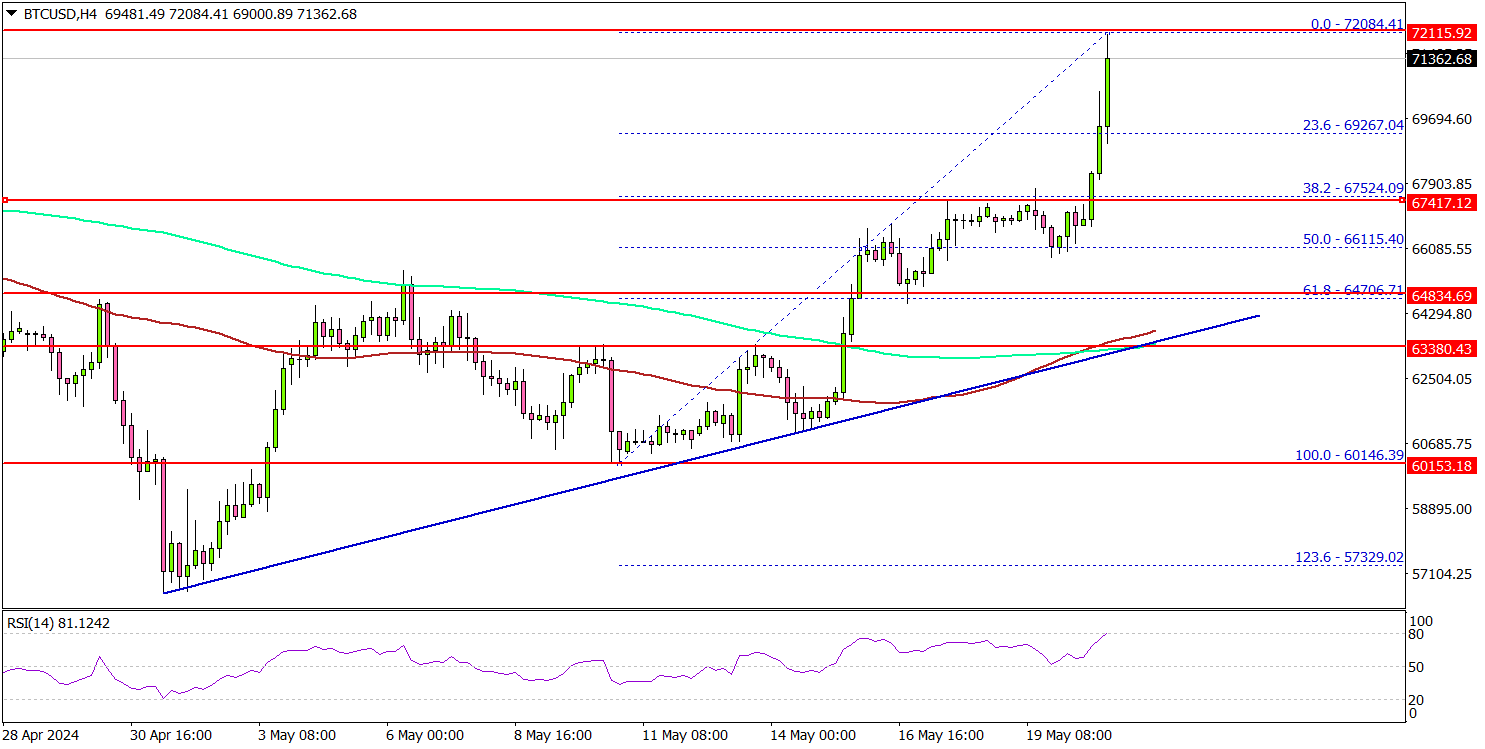
The price is now consolidating gains and trading well above the 23.6% Fib retracement of the upward move from the $60,146 swing low to the $72,084 high.
Bitcoin is also trading well above a key bullish trend line with support near $63,850 on the 4-hour chart. The trend line is close to the 61.8% Fib retracement of the upward move from the $60,146 swing low to the $72,084 high.
The main support sits at $63,000 and the 200 simple moving average (green, 4 hours). Any more losses might send the price toward the $60,500 support zone.
Immediate resistance is near the $72,000 level. The first key resistance is near the $72,500 zone. The next resistance is near $73,800. A successful close above $73,800 might start another steady increase. In the stated case, the price may perhaps rise toward the $75,000 level.
Today’s Economic Releases
- Canadian Consumer Price Index for April 2024 (MoM) – Forecast +0.5%, versus +0.6% previous.
- Canadian Consumer Price Index for April 2024 (YoY) – Forecast +2.7%, versus +2.9% previous.
EURJPY Wave Analysis
- EURJPY broke resistance level 169.40
- Likely to rise to resistance level 171.00
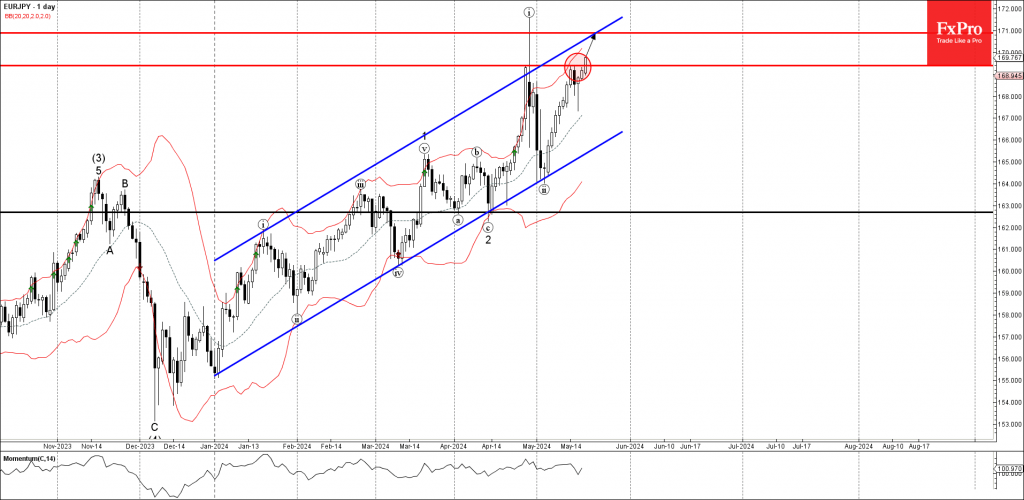
EURJPY is currency under the bullish pressure after the recent breakout of the minor resistance level 169.40, which reversed the price last week.
The breakout of the resistance level 169.40 accelerated the active impulse wave iii, which belongs to the higher order impulse waves 3 and (5).
Given the clear daily uptrend and the continuation of the widespread yen sales, EURJPY can be expected to rise further to the next resistance level 171.00, intersecting with the daily up channel from January.
Natural Gas Wave Analysis
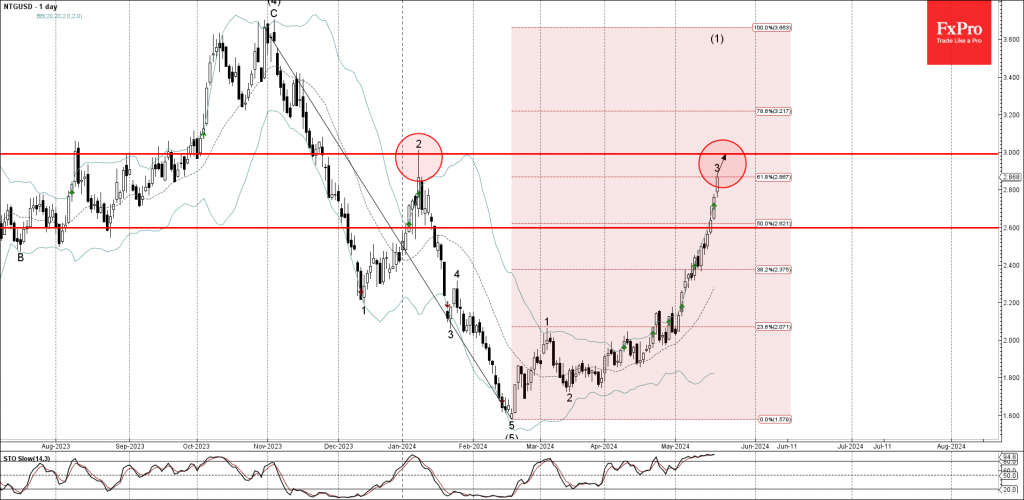
- Natural gas rising inside impulse waves 3 and (1)
- Likely to reach resistance level 3.000
Natural gas continues to rise sharply after recently breaking the resistance level 2.600 intersecting with the 50% Fibonacci correction of the downtrend from last October.
The breakout of these resistance levels accelerated the active impulse waves 3 and (1).
Given the strength of the active impulse wave 1, Natural gas can be expected to rise further to the next round resistance level 3.000 (former monthly high from January).
Oil Shows Weakness
Oil is losing about 0.75% of its peak on Monday, having hit a strengthening sell-off as it attempts to climb above $80/bbl WTI and $84/bbl Brent.
Interestingly, oil is declining despite the death of Iran’s president, which should reinforce the risk premium, and despite a strong rally in metals and other commodities in response to China’s stimulus measures.
News on the US oil industry points to relative stagnation. According to Friday’s report from Baker Hughes, the total number of Oil rigs in the US was 497 compared to 496 and 499 in the last two weeks. We have been seeing fluctuations around the 500 level since last October.
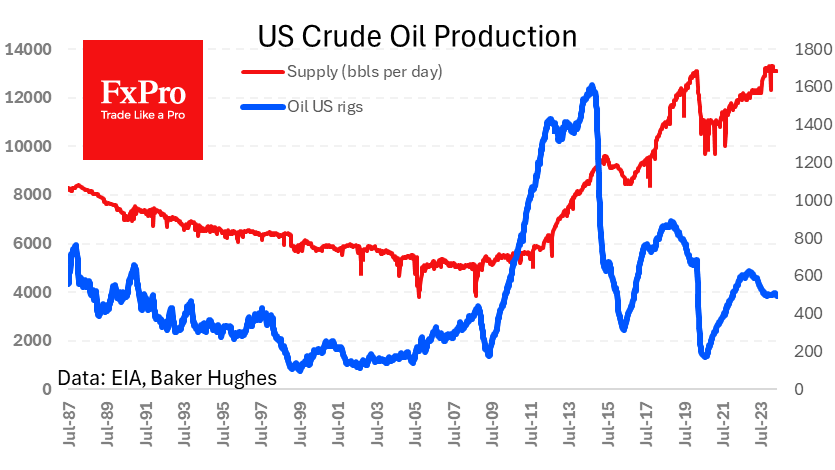
The official weekly report from the US Energy Information Administration last week also pointed to stagnant production at 13.1 million bpd over the last ten weeks. This volume also is the average over the period since mid-September.
The conclusion is that current prices are neutral for the industry, not creating incentives to increase production but not causing it to decline either.
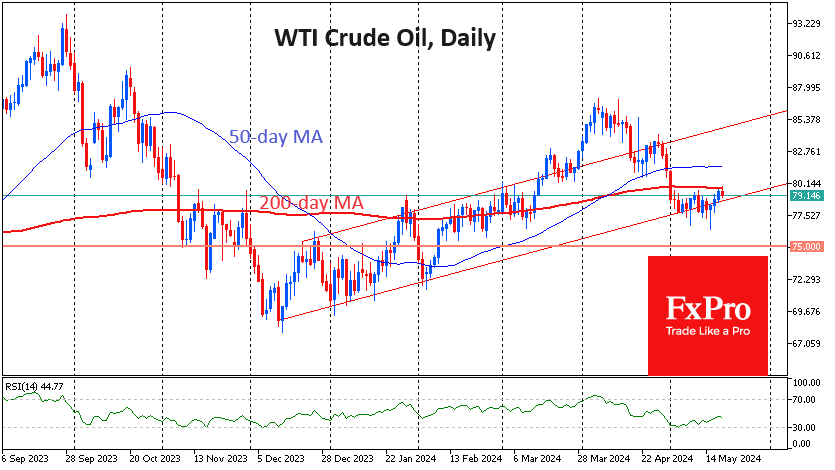
The price chart also shows a clear balance of power for more than two weeks now. Since December, the price has been moving in an ascending channel. Oil briefly fell out of this range last week but found buyers in the second half of last week, rising from $76.4 to $79.8 in less than three days.
The bulls are also not yet able to unequivocally retake the lead, as an attempt to exceed the 200-day moving average on Monday was met with increased selling. This may be a signal that the bears are still in control of the situation and are now gathering strength for a new downward impulse. We will get confirmation of this hypothesis only in case of consolidation under $76.5. It is also relatively easy for oil to roll back to $75, where the 200-week moving average lies. However, a failure below $70-$71 could start a real corkscrew in oil with a potential first target at $50 and a final target at $30.
The ability to get back above $80 would be a sign of a bullish recovery and set the mood for a quick exit to $85 within weeks and above $92 by mid-summer.
USD/JPY Mid-Day Outlook
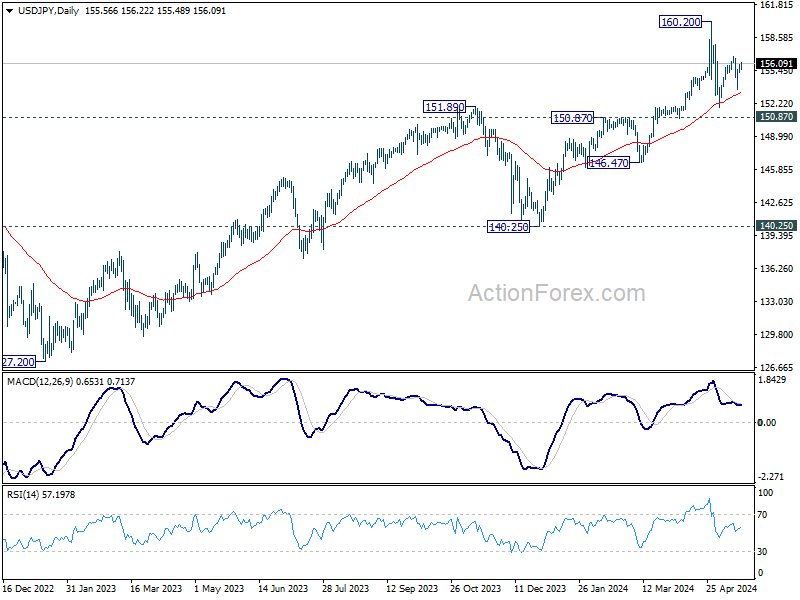
Daily Pivots: (S1) 155.29; (P) 155.63; (R1) 156.02; More...
No change in USD/JPY's outlook and intraday bias stays neutral. Price actions from 160.20 are seen as a corrective pattern. On the upside, break of 156.78 will resume the rise from 151.86, as the second leg, to retest 160.20 high. On the downside, below 153.59 will target 151.86 and below as the third leg.
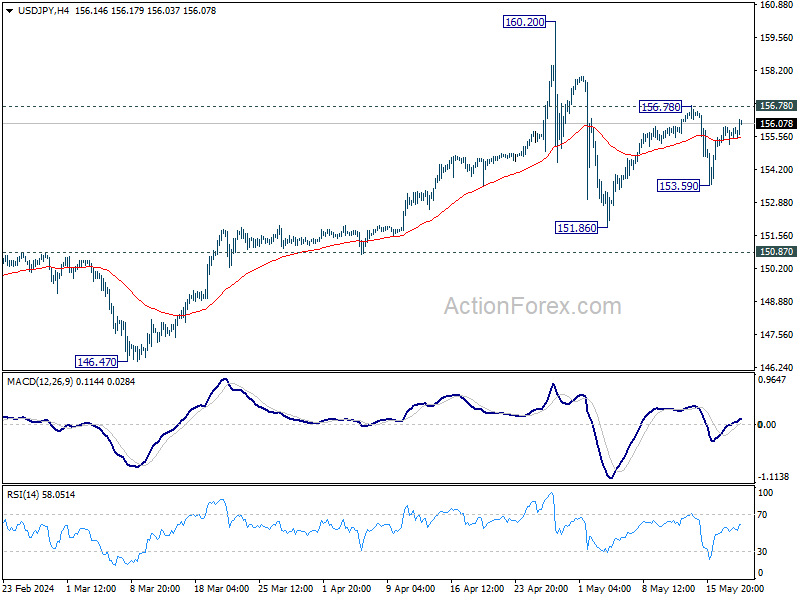
In the bigger picture, a medium term top might be formed at 160.20. But as long as 150.87 resistance turned support holds, fall from there is seen as correcting rise from 150.25 only. However, decisive break of 150.87 will argue that larger correction is possibly underway, and target 146.47 support next.
USD/CHF Mid-Day Outlook
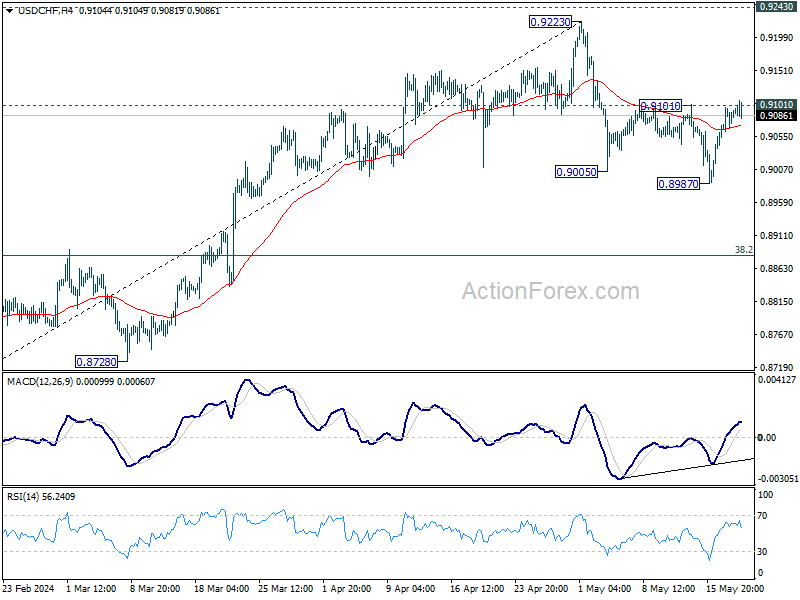
Daily Pivots: (S1) 0.9062; (P) 0.9080; (R1) 0.9110; More....
No change in USD/CHF's outlook and intraday bias stays neutral. On the upside, firm break of 0.9101 will argue that corrective fall from 0.9223 has completed with three waves down to 0.8987 already. Further rise should then be seen to retest 0.9223. On the downside, though, break of 0.8987 will resume the fall to 38.2% retracement of 0.8332 to 0.9223 at 0.8883.
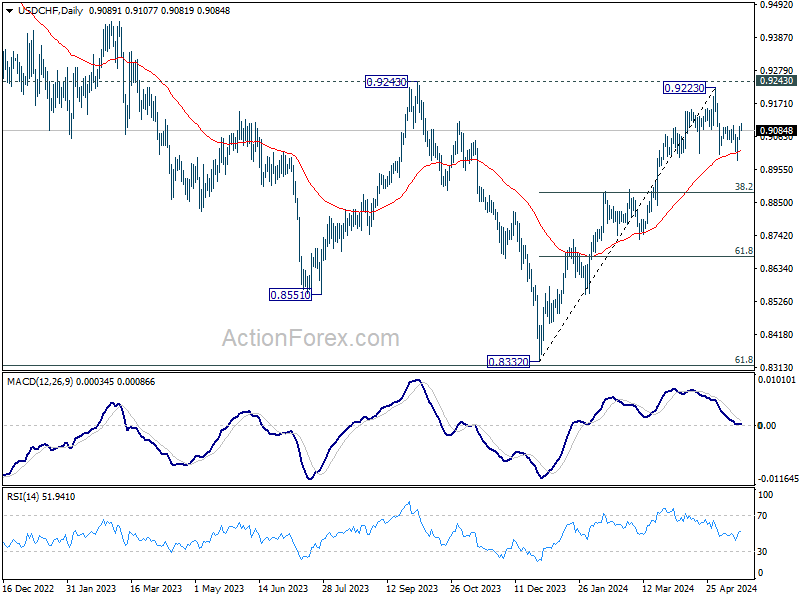
In the bigger picture, price actions from 0.8332 medium term bottom are tentatively seen as developing into a corrective pattern to the down trend from 1.0146 (2022 high). Rejection by 0.9243 resistance, followed by sustained break of 38.2% retracement of 0.8332 to 0.9223 at 0.8883 will strengthen this case, and maintain medium term bearishness. However, decisive break of 0.9243 will argue that the trend has already reversed and turn medium term outlook bullish for 1.0146.
GBP/USD Mid-Day Outlook
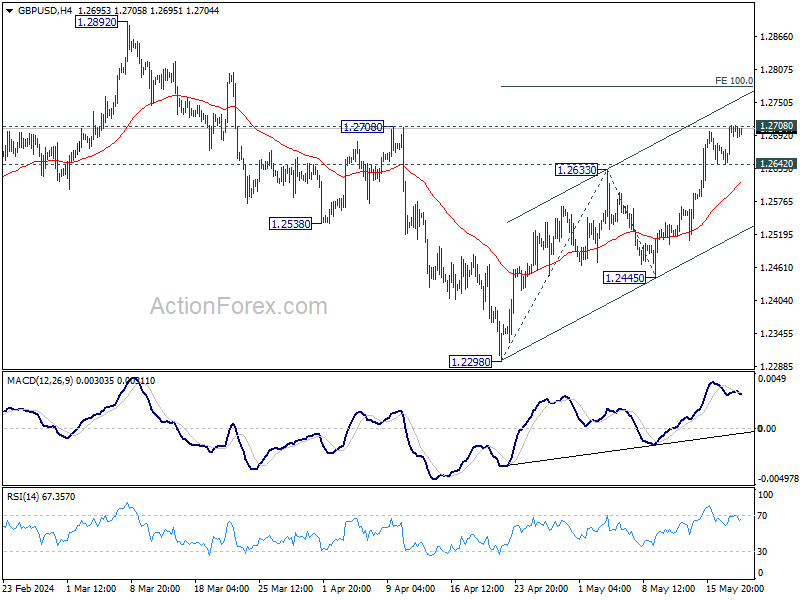
Daily Pivots: (S1) 1.2660; (P) 1.2686; (R1) 1.2727; More...
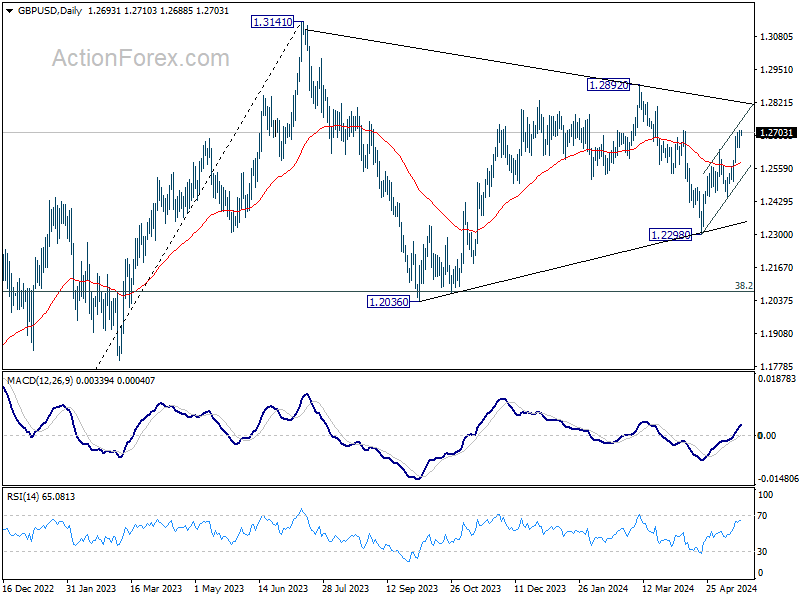
No change in GBP/USD's outlook and intraday bias stays on the upside. Firm break of 1.2708 resistance will extend the rise from 1.2298 to 100% projection of 1.2298 to 1.2633 from 1.2445 at 1.2780. On the downside, below 1.2642 minor support will turn intraday bias neutral again. But further rise will now remain in favor as long as 1.2445 support holds, in case of retreat.
In the bigger picture, price actions from 1.3141 medium term top are seen as a corrective pattern. Fall from 1.2892 is seen as the third leg which might have completed already. Break of 1.2892 resistance will argue that larger up trend from 1.0351(2022 low) is ready to resume through 1.3141. Meanwhile, break of 1.2298 support will extend the corrective pattern instead.