Sample Category Title
Forex and Cryptocurrency Forecast
EUR/USD: Inflation Persists, US GDP Growth Slows
The US economy remains the most powerful on the planet. Moreover, its share of global GDP has reached a nearly two-decade high of 26.3%. According to the IMF, from 2018, the European Union's share decreased by 1.4%, Japan's by 2.1%, while the United States increased by 2.3%. China's GDP is 64% of the American figure, down from 67% five years ago. As a result, the dollar remains the undisputed leader among G10 currencies, with no contenders for its throne in the foreseeable future. The strength of the national economy, coupled with a robust labour market, allows the Federal Reserve to focus on combating inflation, aiming to reduce it to the target 2.0%. According to Jerome Powell, head of the US Central Bank, easing monetary policy under current conditions would have far more negative consequences for the economy than maintaining it tight over a long period. Against this backdrop, the likelihood of a dollar interest rate cut at the Fed's June meeting, according to the FedWatch Tool, fell to 15%. Market participants believe that, at best, a decision to change the current policy may be taken in September. Some economists, including analysts from Morgan Stanley and Societe Generale, even suggest that the Fed may delay the first rate cut until early 2025. Such forecasts led to the US currency rising to five-month highs in mid-April against the euro, British pound, Australian, and New Zealand dollars, with USD/JPY once again reaching a 34-year price record and the DXY index climbing to 106.42.
However, that was in mid-April. For the last ten days of the month, the DXY was under bearish pressure, pushing EUR/USD upward. Jerome Powell stated that decisions on rate cuts are not made in advance but depend entirely on macroeconomic statistics. The statistics released in the last few days looked ambiguous, causing doubts that the US economy could maintain its previous positive dynamics. Tuesday's statistics on April 23, regarding US business activity and core durable goods orders, disappointed investors. Preliminary data from S&P Global showed that the Business Activity Index (PMI) in the US services sector unexpectedly fell from 51.7 to 50.9 points. The manufacturing sector's indicators were even worse, where the PMI crossed the threshold, separating progress from regression. In April, this indicator fell from 51.9 to 49.9 (forecast 52.0). These data alone are not as significant as labor market or inflation reports, but two days later, on April 25, they were supplemented by equally disappointing US GDP data. The preliminary estimate showed that US economic growth in Q1 was only 1.6%, lower than the forecast 2.5% and previous 3.4%. Compared to the same quarter in 2023, GDP growth decreased from 3.1% to 3.0%. Against this backdrop, the DXY, and with it EUR/USD, underwent a correction, with the pair rising to 1.0752.
It should be recalled that the US inflation data released on April 10 showed that the Consumer Price Index (CPI) reached 3.5% year-on-year, the highest in six months. On Friday, April 26, the Bureau of Economic Analysis reported that inflation measured by the change in the Personal Consumption Expenditures (PCE) Price Index in March rose to 2.7% (year-on-year). The core PCE, which excludes volatile food and energy prices, instead of the expected decrease to 2.6%, remained at the previous level of 2.8%. Thus, on the one hand, we see that inflation is resistant and does not want to go down, and on the other hand, we observe a slowdown in GDP growth. According to our forecasts, faced with such a crossroads, the Fed will still not deviate from its previous path and will choose to fight price growth. Moreover, the decrease in GDP in Q1 should not overly alarm the regulator, as the US economy had been expanding at 2% and more for seven consecutive quarters, despite the aggressively tight monetary policy of the Fed. Moreover, recent labor market data looks very positive. The number of initial unemployment claims decreased from 212K to 207K (forecast 214K) – a minimum since February.
On Tuesday, April 23, the same day as in the US, preliminary data on business activity came out from the other side of the Atlantic. In Germany, the Manufacturing PMI rose from 41.9 to 42.2, and in the services sector – from 50.1 to 53.3, the Composite Index – from 47.7 to 50.5. Regarding the Eurozone as a whole, a positive dynamic was also noted. Thus, the Business Activity Index in the services sector rose from 51.5 to 52.9 points, the Composite Index from 50.3 to 51.4. The exception was the Manufacturing PMI (a decrease from 46.1 to 45.6). As for forecasts about the start of easing monetary policy by the European Central Bank, the emphasis is still on June. This was once again confirmed by the president of the German Bundesbank and a member of the ECB's Governing Council, Joachim Nagel, who stated on April 24 that a rate cut in June does not necessarily imply a series of rate cuts. In other words, in June – yes, there will be a cut, what happens next – is still unknown.
All of the above indicates that the fundamental indicators are still on the side of the dollar. The EUR/USD correction is likely to be limited and will not be powerful or prolonged. Last week, the pair closed at 1.0692. According to economists from the Singapore-based United Overseas Bank, it is unlikely to have the strength to break through the resistance at 1.0765. As for the forecast for the near future, as of the evening of April 26, 50% of experts expect the dollar to strengthen, 35% – its weakening, the remaining 15% maintained neutrality. Among the trend indicators on D1, 65% are on the side of the bears, 35% – are coloured green. Among the oscillators, a third are on the side of the bears, a third – on the side of the greens, and a third – are painted in neutral gray. The nearest support for the pair is located in the zone of 1.0680, then 1.0600-1.0620, 1.0560, 1.0495-1.0515, 1.0450, 1.0375, 1.0255, 1.0130, 1.0000. Resistance zones are located in the areas of 1.0710-1.0725, 1.0740-1.0750, 1.0795-1.0805, 1.0865, 1.0895-1.0925, 1.0965-1.0980, 1.1015, 1.1050, 1.1100-1.1140.
The coming week promises to be quite turbulent and volatile as it is filled with various important events. On Monday, April 29, preliminary data on consumer inflation (CPI) in Germany will be released. The next day, another batch of German statistics will be released, including GDP and retail sales figures. On the same day, we will learn the preliminary volume of GDP and the level of inflation in the Eurozone as a whole. On Wednesday, May 1, Germany and many other EU countries will have a holiday – Labor Day. However, the United States will continue to work on this day. First, the ADP report on employment levels in the private sector of the country and indicators of business activity in the manufacturing sector will be published. The most important event will undoubtedly be the meeting of the FOMC (Federal Open Market Committee) of the US Federal Reserve on Wednesday, May 1, and the subsequent press conference of the management of this regulator. In addition, on Friday, May 3, we traditionally await another batch of very important statistics from the American labor market, including the unemployment rate and the number of new jobs created outside the agricultural sector (NFP), as well as revised data on business activity (PMI) in the US services sector.
GBP/USD: US PCE Hindered the Strengthening of the Pound
The preliminary statistics on business activity in the United Kingdom released on Tuesday, April 23, were mixed. The PMI in the manufacturing sector of the country crossed from above to below the growth/fall boundary, and with a forecast and previous value of 50.3 points, it actually fell to 48.7. In the UK services sector, on the other hand, there was growth in April – the indicator rose from 53.1 to 54.9 (market expectations 53.0). As a result, the Composite PMI reached 54.0 (52.8 a month earlier). However, all these figures did not attract much attention from investors.
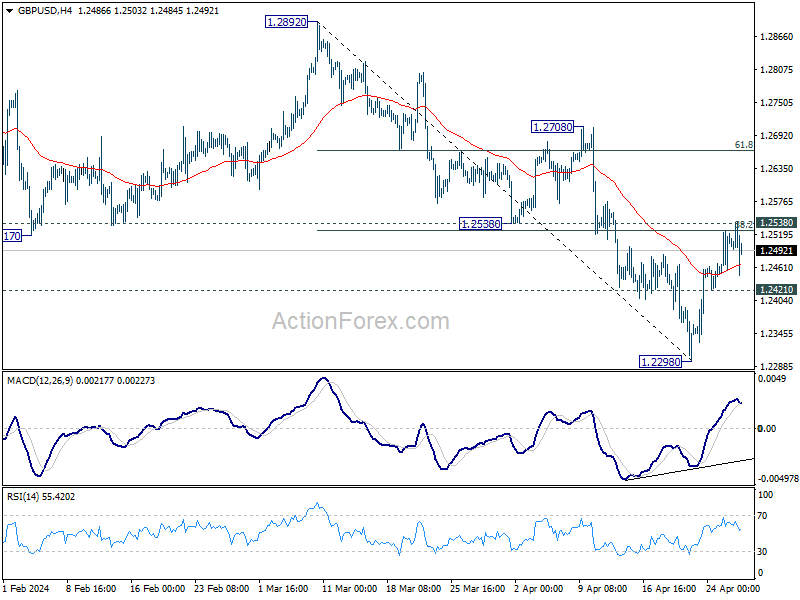
On April 22, GBP/USD fell to 1.2300. The bulls on the pair took advantage of the dollar's overbought condition to return it to the lower boundary of the medium-term corridor of 1.2500-1.2800 in which it had been moving since the end of November last year. However, they did not have enough strength to consolidate within the corridor. The two-week maximum was recorded at 1.2540, after which, pushed by US PCE, the pair went down again and ended the five-day period at 1.2492.
According to specialists from United Overseas Bank, as long as the support at 1.2420 is not broken, there is still a possibility of the pound breaking through the 1.2530 mark. The next resistance, according to them, is at 1.2580. The median forecast of analysts regarding the behaviour of GBP/USD in the near future looks maximally uncertain: 20% voted for the movement of the pair to the south, the same amount – to the north, and the majority (60%) simply shrugged their shoulders. As for technical analysis, the trend indicators on D1 point south 65% and 35% look north. Among the oscillators, the picture is mixed: 25% recommend selling, 25% – buying, and 50% are in the neutral zone. In case of further decline of the pair, it will encounter support levels and zones at 1.2450, 1.2400-1.2420, 1.2300-1.2330, 1.2185-1.2210, 1.2110, 1.2035-1.2070, 1.1960, and 1.1840. In case of growth, the pair will encounter resistance at levels 1.2530-1.2540, 1.2575-1.2610, 1.2695-1.2710, 1.2755-1.2775, 1.2800-1.2820, 1.2885-1.2900.
No significant statistics on the state of the UK economy are planned for the week.
USD/JPY: Reached the Moon, Next Target – Mars?
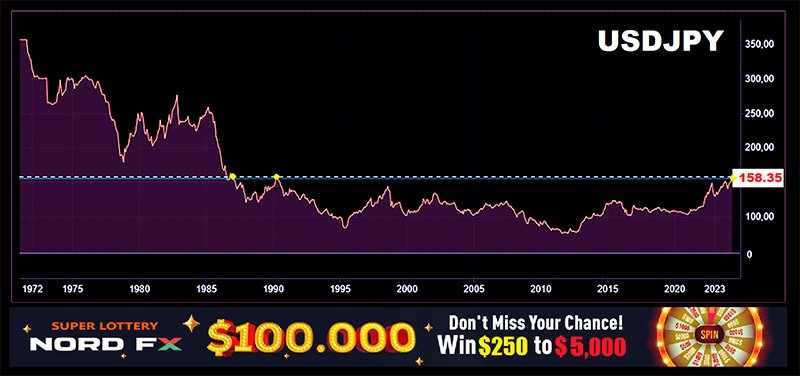
We called the previous review "Higher and Higher". Now, it is worth asking at what altitude will this flight into space end? When will the Bank of Japan (BoJ) finally decide on a radical change in its monetary policy?
At the meeting on April 26, the members of the Japanese Central Bank unanimously decided to keep the key interest rate at the previous level of 0.0-0.1%. Moreover, the regulator removed from the statement the reference that it is currently buying JGB bonds for about 6 trillion yen per month. The statement after the meeting states that "the prospects for the development of the economy and prices in Japan are extremely uncertain," "if inflation rises, the Bank of Japan will likely change the degree of easing of monetary policy," however, "it is expected that the eased monetary policy will be maintained for some time."
The market predictably reacted to such decisions of the Japanese Central Bank with another Japanese candle on the chart of the USD/JPY pair. The maximum was recorded at 158.35, which corresponds to the peak values of 1990. There were no currency interventions to save the national currency, which many market participants feared. Recall that strategists from the Dutch Rabobank called the level of 155.00 critical for the start of such interventions by the Ministry of Finance of Japan. The same mark was called by 16 out of 21 economists surveyed by Reuters. The rest predicted such actions at levels of 156.00 (2 respondents), 157.00 (1), and 158.00 (2). USD/JPY has long exceeded the levels at which the intervention took place in October 2022 and where the market turned around about a year later. It now seems that 158.00 is not the limit. Perhaps it is worth raising the forecast bar to 160.00? Or immediately to 200.00?
USD/JPY ended the past week at 158.32. The forecast of analysts regarding the near future of the pair looks as follows: fear of currency interventions still prevails over 60% of them, while the remaining 40% are waiting for the continuation of the flight to Mars. Technical analysis tools clearly have no concerns about interventions. Therefore, all 100% of trend indicators and oscillators on D1 point north, although a third of the latter are in the overbought zone. The nearest support level is located in the area of 156.25, then 153.90-154.30, 153.10, 151.00, 149.70-150.00, 148.40, 147.30-147.60, 146.50. And it is practically impossible to determine resistance levels. We only note the reversal maximum of April 1990, 160.30, although this target is quite conditional.
No significant events regarding the state of the Japanese economy are expected in the coming week. Moreover, traders should keep in mind that Monday and Friday in Japan are holidays: April 29, the country celebrates the birthday of Hirohito (Emperor Showa), May 3 – Constitution Day.
CRYPTOCURRENCIES: Where Will Bitcoin Fall?
As expected, the fourth halving took place in the bitcoin network at block #840000 on April 20. The reward for finding a block was reduced from 6.25 BTC to 3.125 BTC. Recall that halving is a halving of the reward size for miners for adding a new block to the bitcoin blockchain. This event is embedded in the code of the first cryptocurrency and occurs every 210,000 blocks – until the moment when the mining of 21 million coins (presumably in 2040) ends the emission of cryptocurrency. It should be noted that the fourth halving will provide for the mining of approximately 95% of the entire bitcoin emission, about 99% of all coins will be mined by 2033-2036. Then, the emission will gradually move towards zero.
In the previous review, we promised to tell how the market would react to this important event. We promised – we report: the market reaction is close to zero. For several days after the halving, there was no growth in volatility. The price of bitcoin slowly and lazily moved first upward, reaching $67,269 on April 23, and then returned to where it began its weekly journey: to the $64,000 zone. It seems that market participants froze in anticipation of who would be the first to start buying or, conversely, selling the main cryptocurrency massively.
According to experts from Bitfinex, the post-halving supply restriction stabilizes the price of the first cryptocurrency and may contribute to its growth. "The reduction in the pace of bitcoin issuance after halving, which will amount to $30-40 million per day, contrasts sharply with the daily net inflow of $150 million into spot ETFs. This emphasizes a significant demand and supply imbalance, which may contribute to further price growth," stated the Bitfinex report.
However, analysts from QCP Capital believe that bitcoin optimists will have to wait at least two months before assessing the effect of the past fourth halving. "The spot price grew exponentially only 50-100 days after each of the three previous halvings. If this pattern repeats this time, bitcoin bulls still have weeks to create a larger long position," their report stated.
Anthony Pompliano, the founder of the venture company Pomp Investments, believes that within 12-18 months, the coin is expected to grow to $100,000, with chances of reaching $150,000-200,000. However, before moving to a bull rally, BTC/USD, in his opinion, is waiting for a correction down. At the same time, Pompliano believes that the price will not fall below $50,000. "I think we have already crossed this Rubicon," – he wrote.
The possible upcoming decline of the main cryptocurrency is probably a topic currently much more discussed than its subsequent growth. Many agree that bitcoin coins will appreciate in the long term. But how will quotes behave in the more foreseeable future? Fidelity Digital Assets, the leading issuer of one of the spot BTC ETFs, has already revised its medium-term forecast for bitcoin from positive to neutral. The reason for abandoning optimistic sentiments is several worrying trends in the crypto market. Fidelity analysts noted the growing interest in selling from long-term hodlers. Among them, there is currently a large percentage of profitable addresses, as noted in the company's report. This means that holders may want to lock in profits and start selling BTC. On the other hand, on-chain data indicates that small investors, on the contrary, continue to accumulate the first cryptocurrency. Since the beginning of the year, the number of addresses on which BTC is stored for at least $1,000 has increased by 20% and reached a new historical maximum. "Such a trend may indicate the growing dissemination of bitcoin and its acceptance among 'average' users," – Fidelity noted.
Specialists from CryptoQuant examined the SOPR indicator readings for these categories of investors and made conclusions similar to those of their colleagues from Fidelity. Investments in Bitcoin by "new" whales (owners of coins "aged" less than 155 days) almost doubled the indicator of "old" large players (more than 155 days). At the same time, the increased value of the metric showed that the profits of the "old" hodlers significantly exceed the indicators of the "newcomers". And if the "old-timers" move to fix profits, this may lead to the formation of price peaks. An analysis of the current picture, according to CEO of CryptoQuant Ki Young Ju, also speaks of the need to exercise caution in anticipation of possible corrections and increased volatility.
Recall that earlier, specialists from JPMorgan noted that digital gold is in a state of overbought. And co-founder of CMCC Crest Willy Woo noted that if the price of the first cryptocurrency falls below the support level of short-term holders at $58,900, the market risks moving into a bearish phase.
As of the evening of Friday, April 26, the BTC/USD pair is trading in the region of $63,950. The total capitalization of the crypto market is $2.36 trillion ($2.32 trillion a week ago). The Bitcoin Fear & Greed Index remained in the Greed zone, although it rose from 66 to 70 points.
Finally, in conclusion of the review, our long-forgotten crypto-life-hacks column. It turns out that in order to become a crypto millionaire, it is enough to have a marker and a piece of paper. The possibility of such a way of enrichment was proven by Christian Langlois, also known as Bitcoin Sign Guy. This guy made headlines in many news outlets after showing a notebook sheet with the inscription "Buy Bitcoin" behind the back of the Chair of the Federal Reserve System Janet Yellen. At that moment, the head of the Fed was giving testimony about the state of the US economy. This image instantly spread across the network and became one of the symbols of the emerging crypto industry.
For his misdemeanour, the 22-year-old intern Langlois was disgracefully expelled from the hearings. But after this episode was shown on television, enthusiasts sent 7 BTC to his crypto wallet to thank the guy for his bold move. Four years ago, Christian sold 21 copies of the "cult" sheet at an average price of 0.8 BTC, earning another 16.8 BTC. Thus, his total earnings reached 23.8 BTC, which is more than $1.5 million at the current exchange rate.
And a few weeks ago, Langlois was offered another 5 bitcoins for the original, but he refused to sell the sheet. Nevertheless, Christian liked the idea of further monetizing the self-created object of "artistic and historical heritage", and he decided to sell it at an auction, directing the proceeds to finance his startup Tirrel Corp. On April 25, 2024, the auction house Scarce.City reported that the lot, which became a popular meme, was sold for 16 BTC (more than $1 million).
Yen’s Decline, Robust US Investor Confidence, and Aussie’s Rise
Last week's market activity was shaped by several significant themes. Firstly, the Japanese Yen's rapid decline caught market participants off guard. The sell-off was exacerbated by what many considered tepid verbal interventions from Japanese officials. Current momentum suggests that the Yen's free fall is far from over. The key is whether Japan will step up with stronger actions, or at least words, as Yen approaches 160 mark against the greenback.
Secondly, investor confidence in the US showed remarkable resilience. Despite economic data suggesting that Fed would further delay interest rate cuts, US markets have adapted to this new outlook well. There is a growing sentiment that robust economic data will continue to be received positively, reinforcing the adage that "good news is good news."
Thirdly, Australian Dollar benefited not only from strong domestic economic and inflation data but also from renewed optimism towards China's economic recovery. The substantial rally in Hong Kong stocks has mirrored this positive sentiment. Should this positive sentiment towards China's economy solidify into a stable trend, this could spell further upside for Aussie.
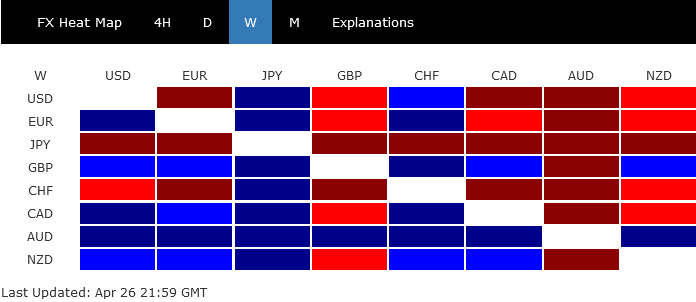
In a broader view of the currency markets, Yen concluded the week as the weakest performer, followed by Swiss Franc and Dollar. On the other end of the spectrum, Australian Dollar emerged as the top performer, followed by British Pound and New Zealand Dollar. Euro and Canadian Dollar occupied the middle ground.
Strong Finish for US Stocks After Volatile Week; Market Accepts Diminished Prospects for Fed Cuts
US stock markets ended a notably turbulent week on a high note, with major indices recording their best performances since November. S&P 500 rose by 2.7%, while NASDAQ saw an impressive 4.2% gain. DOW also climbed, albeit more modestly, by 0.7%. Some analysis attributed the rally to stellar earnings reports from tech giants and AI competitors Alphabet and Microsoft. But it's important to note the resilience of investor sentiment against the backdrop of mixed economic indicators.
Investors initially braced for impact following the release of weaker-than-expected Q1 GDP growth figures and higher-than-anticipated inflation data. However, the market's resilience suggests robust underlying confidence, supported by expectations of continued strong consumer spending. The economy is anticipated to be bolstered by consumption, even amidst elevated inflation and interest rate levels. This consumer resilience suggests sustained demand that could keep inflation at elevated levels, keep Fed's hands off from aggressive monetary policy easing.
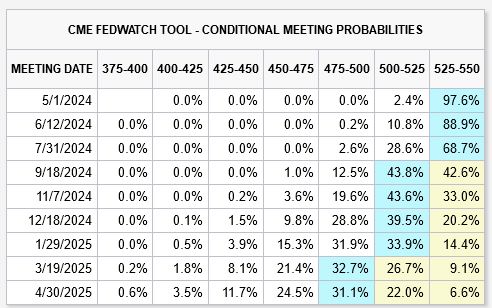
The overall market dynamics argues that expectation of fewer Fed rate cut, or even no cut this year at all, is well priced in, and absorbed by investors. According to Fed fund futures, the probability of two rate cuts this year is now around 40%, with 20% chance that rates will remain unchanged.
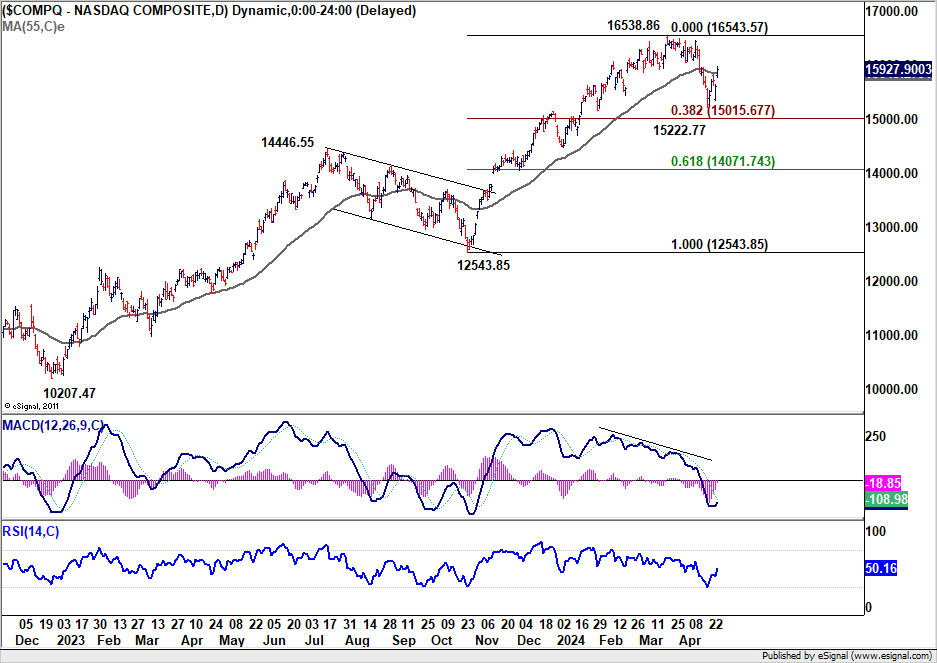
NASDAQ's break 55 D EMA argues that pull back from 16538.86 has completed at 15222.77. Price actions from 16538.86 are likely developing into a sideway consolidation pattern to rise from 12543.83 only. The range should be set between 38.2% retracement of 12543.85 to 16538.86 at 15015.67 and 16538.86, or in short, between 15000 and 16500.
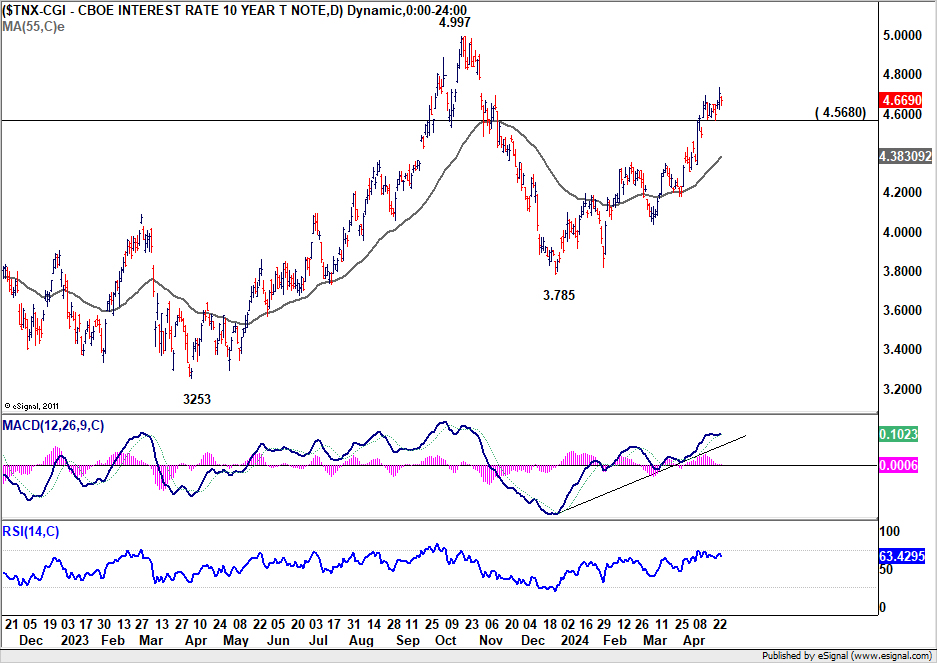
10-year yield's rally from 3.785 is staying to lose some upside momentum even though there is no clear sign of topping yet. While further rally remain in favor, upside should be capped below 4.997 high. Break of 4.568 will bring pullback to 55 D EMA (now at 4.383) first. It's a highly unlikely scenario for now, but upside re-acceleration in 10-year yield and break of 4.997 resistance could be a sign that inflation in the US is getting out of control again, which would force Fed to tighten again.
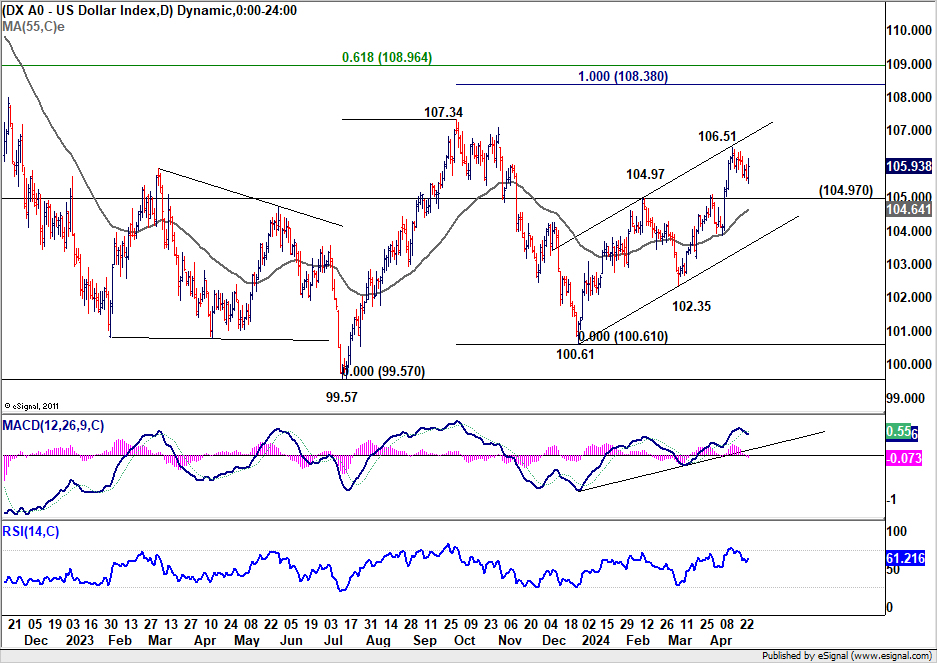
Dollar index retreated after failing to break through rising channel resistance. But price actions from are so far corrective. Outlook will stay bullish as long as 104.97 resistance holds. Rise from 100.61, as the third leg of the pattern from 99.57, is still expected to extend to 107.34 resistance, and possibly further to 100% projection of 99.57 to 107.34 from 100.61 at 108.38.
Yen's Accelerated Decline Exposes Inadequate Resolve for Currency Intervention
Another major theme of the currency markets was the intensified broad-based selloff in Japanese Yen. The decline briefly paused before BoJ meeting but the downward spirally quickly resumed afterwards. The post-meeting comments from Governor Kazuo Ueda highlighted that the weakening Yen has yet to significantly impact Japan's inflationary pressures. This observation has led to speculation that the Japanese government may refrain from intervening in the currency markets for now.
This steep depreciation is noteworthy especially considering the recent trilateral meeting between Japan, South Korea, and US just a week ago, which addressed the slump of Asian currencies. The lack of resolve for coordinated market intervention was tested and proven by market developments. Further, the stance was reinforced by US Treasury Secretary Janet Yellen's comments, as she indicated that the US expects currency market interventions to be "rare" and only reserved for periods of "excessive volatility."
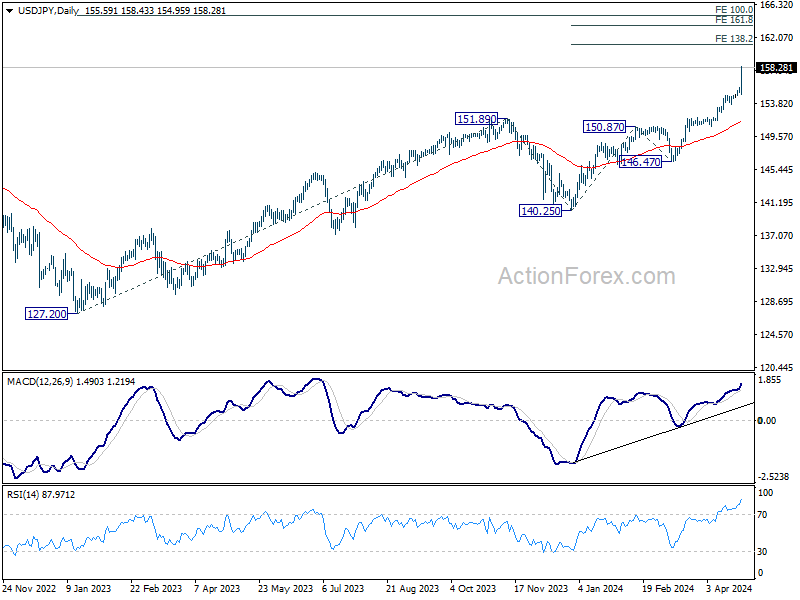
For the near term, USD/JPY's rally is in progress to 138.2% projection of 140.25 to 150.87 from 146.47 at 161.14. Attentions will be on whether Japan would step up verbal intervention near 160, or even back up with actual actions. If not, next target would be 161.8% projection at 163.65.
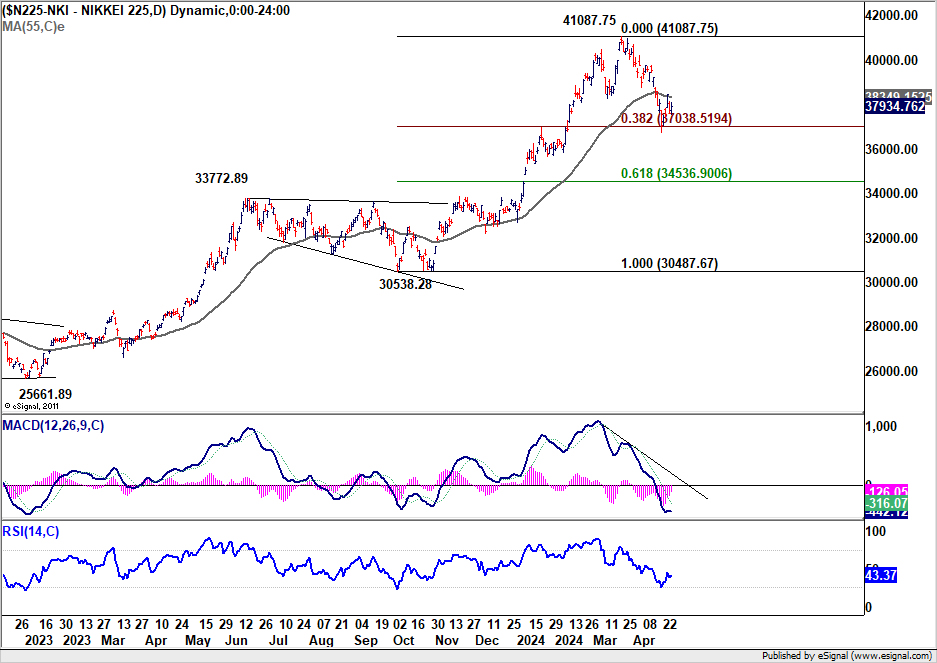
Nikkei traders are so far unimpressed by the free fall in Yen. While a weaker Yen would boost exports and tourism, it would hurt imports in particular energy, and squeeze margins out of businesses. The next few days could be important for the technical development. If Nikkei could bounce from current level and break through 55 D EMA (now at 38349.15) decisively, that would suggest that price actions from 41087.75 is merely developing into a sideway pattern, rather than a large scale bearish reversal. Such development would be a relief to both the government and BoJ.
Aussie Surges Amid RBA Rate Cut Delays and Renewed China Optimism
Australian Dollar emerged as the standout performer this week, buoyed by a combination of robust economic indicators and growing optimism around the Chinese economy's recovery.
Early in the week, strong PMI data provided a solid foundation, suggesting acceleration in Australia's GDP growth in Q2. The increasing economic activity also comes with its challenges, particularly as inflation has not on sustained path back to RBA's target band. This situation has raised discussion among analysts the possibility of further tightening by RBA.
Meanwhile, Q1 CPI data showed that disinflation progress has been rather dissatisfactory. March's monthly CPI even accelerated, hinting at risk of resurgence in inflation. Analysts have subsequently adjusted their forecasts, pushing back the timeline for an anticipated RBA rate cut from the third to the fourth quarter of the year, some even suggesting it might be delayed further.
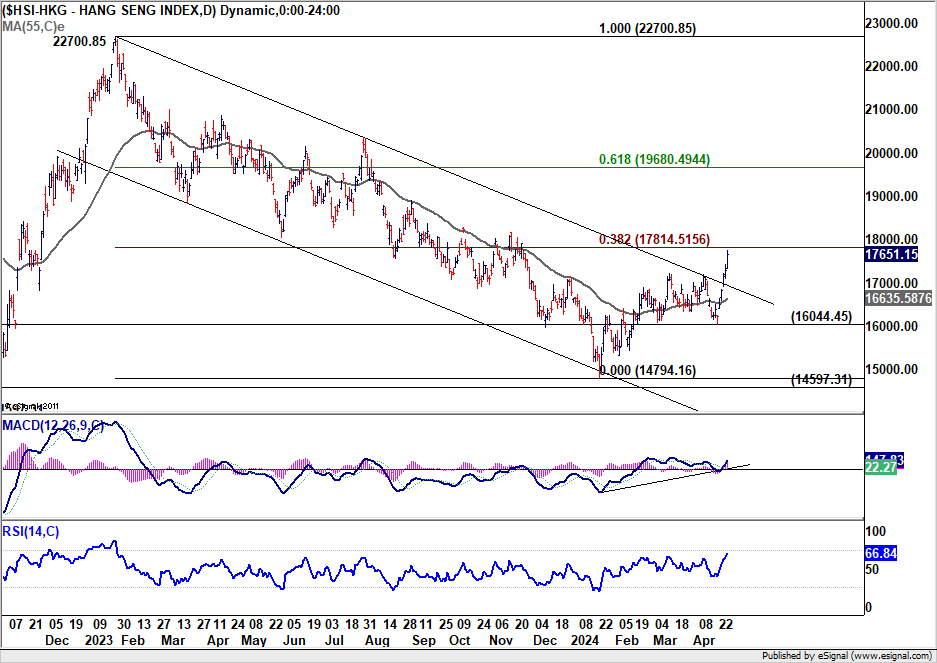
Adding to the positive outlook for Aussie is renewed confidence in the Chinese economy, Australia's major trading partner. This optimism is palpably reflected in the performance of Hong Kong's stock market. HSI powered through medium term channel resistance to close at 17651.15. Immediate focus is now on 38.2% retracement of 22700.85 to 14794.16 at 17814.51. Decisive break there will raise that chance that HSI is already reversing the downtrend from 22700.85. Further rise should then be seen to 61.8% retracement at 19680.49 and above.
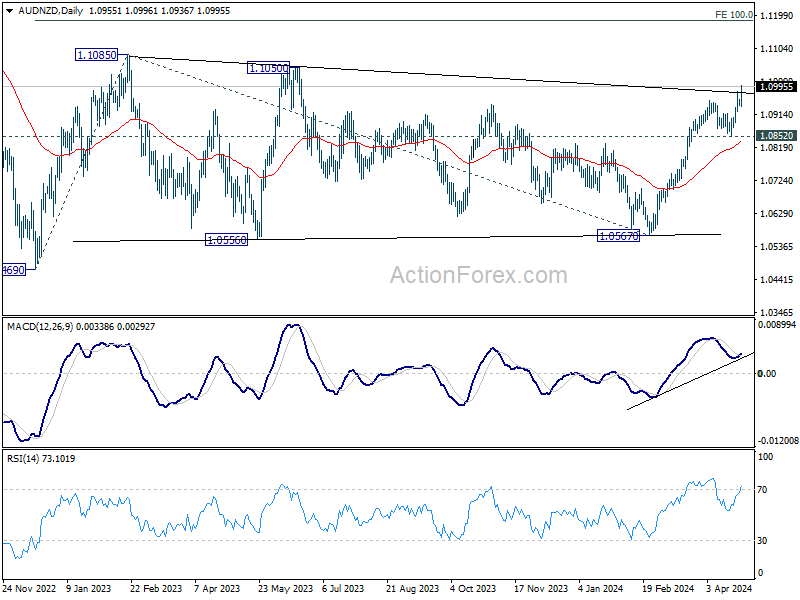
AUD/NZD's rally from 1.05670 resumed and even broke through medium term trendline resistance. The development is strengthening the case that sideway consolidation from 1.1085 has completed with three waves to 1.0567. Near term outlook will now stay bullish as long as 1.0852 support holds. Next target is 100% projection of 1.0469 to 1.1085 from 1.0567 at 1.1183.
EUR/JPY Weekly Outlook
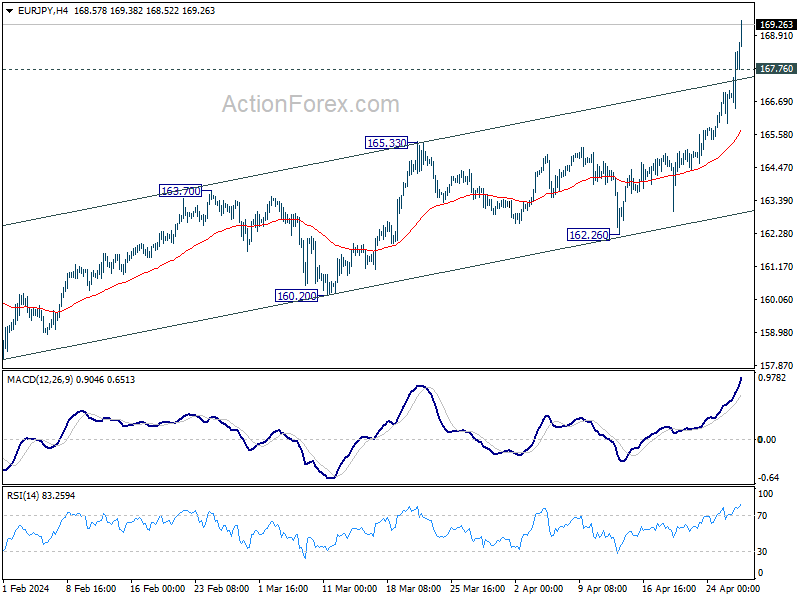
EUR/JPY's up trend resumed last week and accelerated to as high as 169.38. Initial bias remains on the upside this week. Next target is 169.96 high the downside, below 167.76 minor support will turn intraday bias neutral and bring consolidations. But pull back should be contained well above 165.33 resistance turned support to bring another rally.
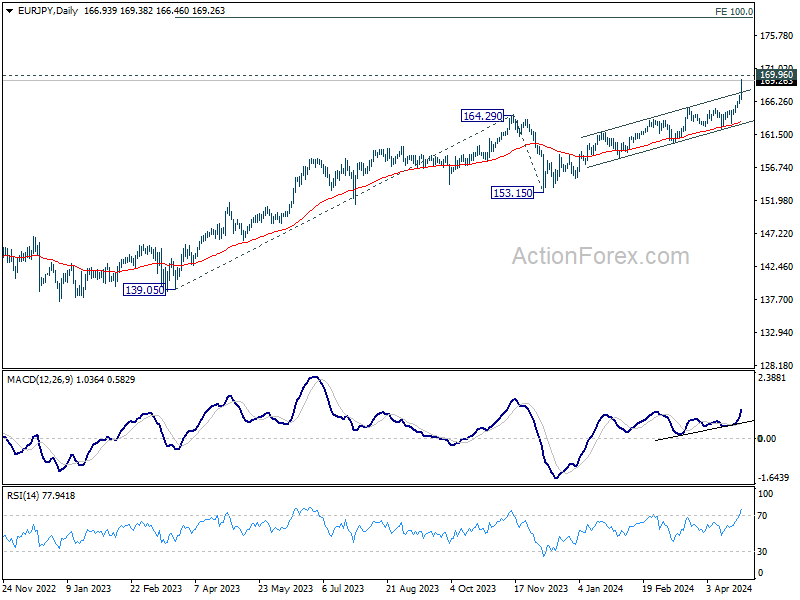
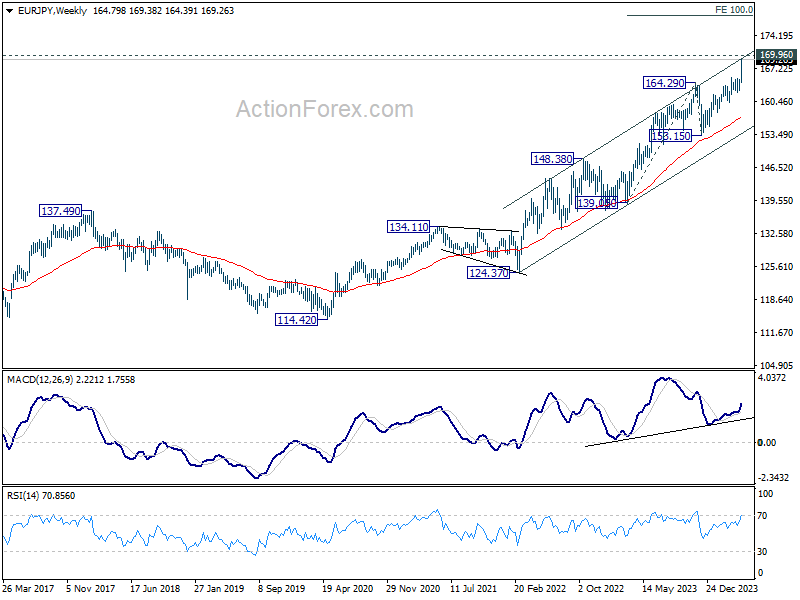
In the bigger picture, current rally is part of the up trend from 114.42 (2020 low), which is still in progress. Next target is 169.96 (2008 high). Decisive break there will pave the way to 100% projection of 139.05 to 164.29 from 153.15 at 178.39. On the downside, break of 162.26 support is needed to be the first sign of medium term topping. Otherwise, outlook will stay bullish in case of retreat.
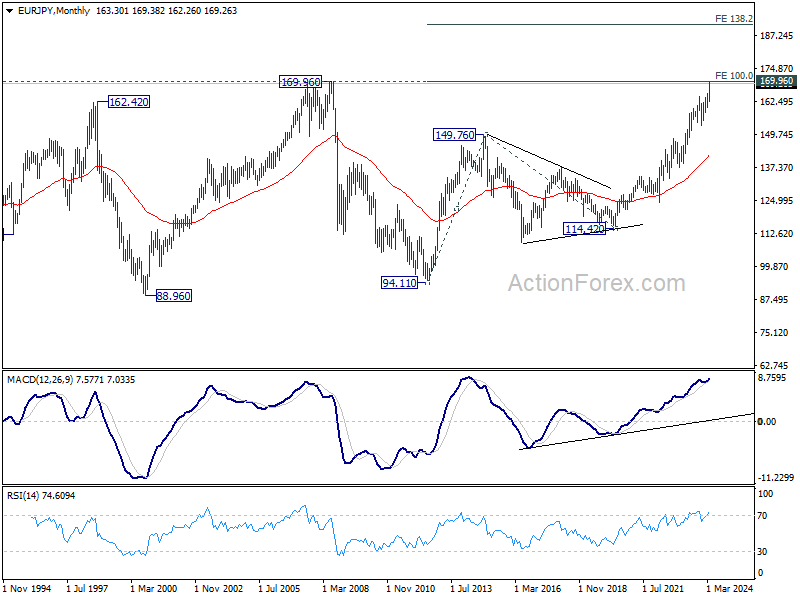
In the long term picture, rise from 114.42 (2020 low) is seen as the third leg of the whole up trend from 94.11 (2012 low). Next target is 100% projection of 94.11 to 149.76 from 114.42 at 170.07 which is close to 169.96 (2008 high). Firm break there will target 138.2% projection at 191.32. This will remain the favored case as long as 153.15 support holds.
EUR/USD Weekly Outlook
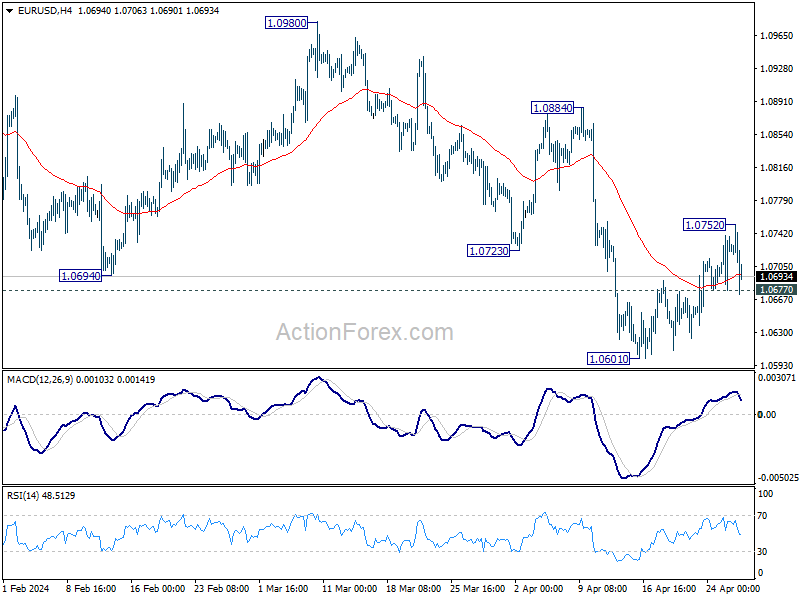
EUR/USD recovered further to 1.0752 last week but retreated since then. Initial bias is turned neutral this week first. On the upside, above 1.0752 will resume the rebound to 55 D EMA (now at 1.0780). On the downside, break of 1.0677 minor support will turn intraday bias to the downside for retesting 1.0601 low.
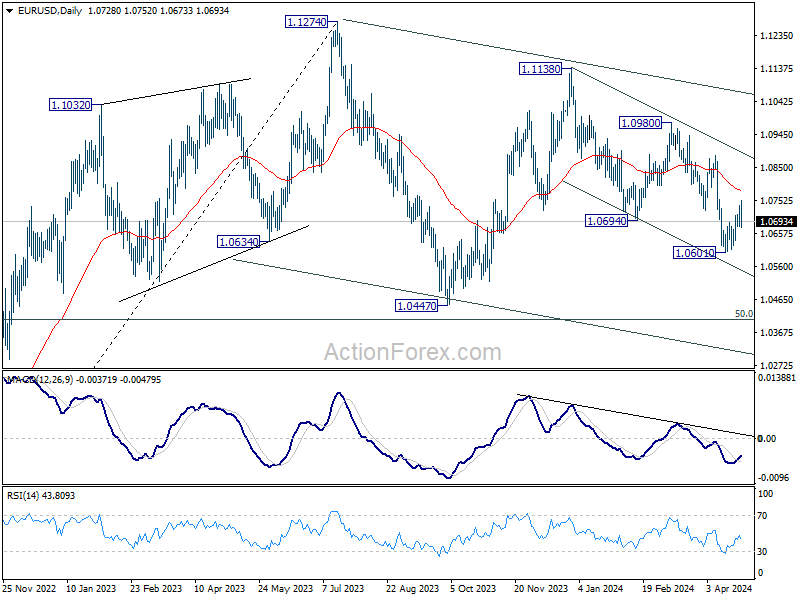
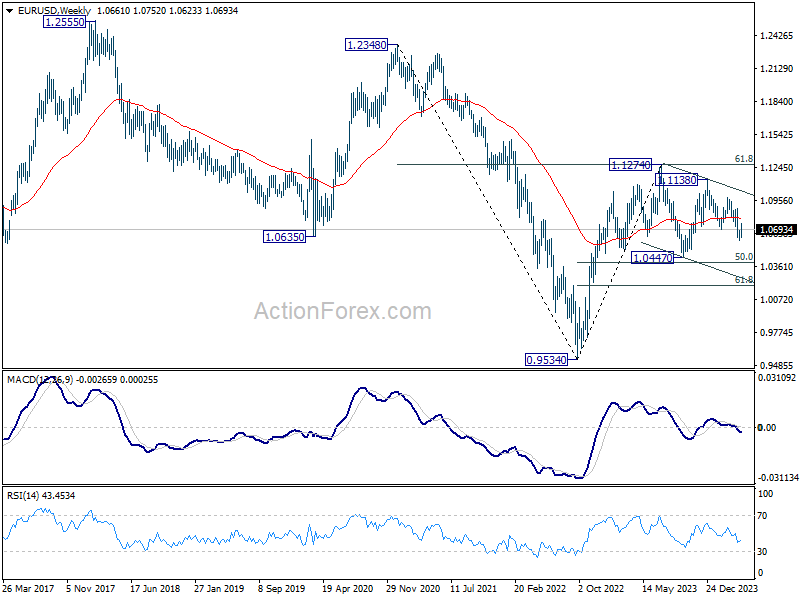
In the bigger picture, price actions from 1.1274 are viewed as a corrective pattern to rise from 0.9534 (2022 low). Current fall from 1.1138 is seen as the third leg. While deeper decline is would be seen to 1.0447 and possibly below, strong support should emerge from 61.8% retracement of 0.9534 to 1.1274 at 1.0199 to complete the correction.
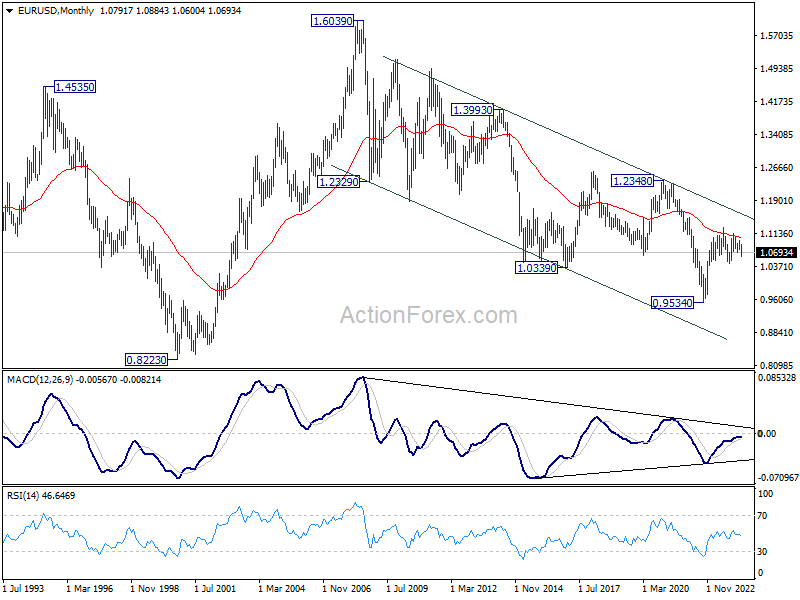
In the long term picture, a long term bottom is in place at 0.9534 on bullish convergence condition in M MACD. It's still early to call for bullish trend reversal with the pair staying inside falling channel in the monthly chart. Nevertheless, sustained trading above 55 M EMA (now at 1.1036) and break of 1.1274 resistance will raise the chance of reversal and target 1.2348 resistance for confirmation.
USD/JPY Weekly Outlook
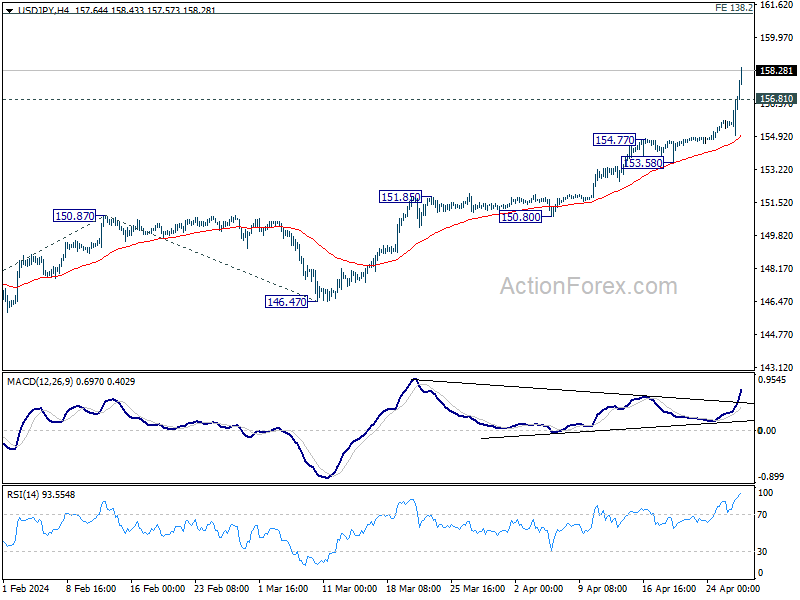
USD/JPY's up trend resumed last week and accelerated to as high as 158.43. Initial bias stay on the upside this week. Next target is 138.2% projection of 140.25 to 150.87 from 146.47 at 161.14. On the downside, below 156.81 minor support will turn intraday bias neutral and bring consolidations first.
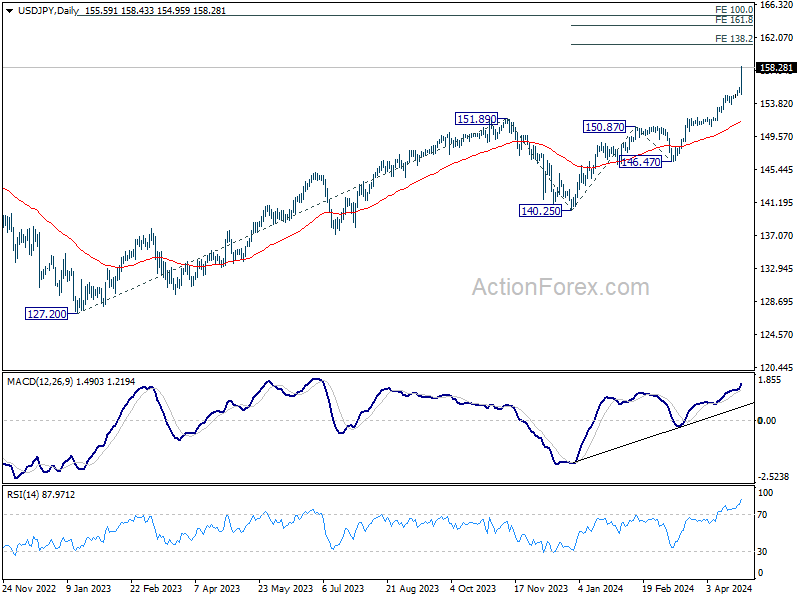
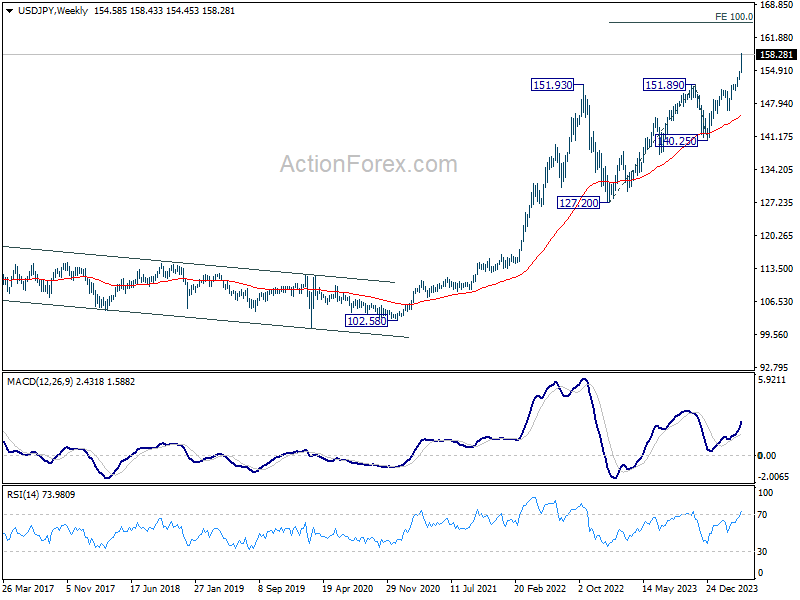
In the bigger picture, current rise from 140.25 is seen as the third leg of the up trend from 127.20 (2023 low). Next target is 100% projection of 127.20 to 151.89 from 140.25 at 164.94. Outlook will remain bullish as long as 150.87 resistance turned support holds, even in case of deep pullback.
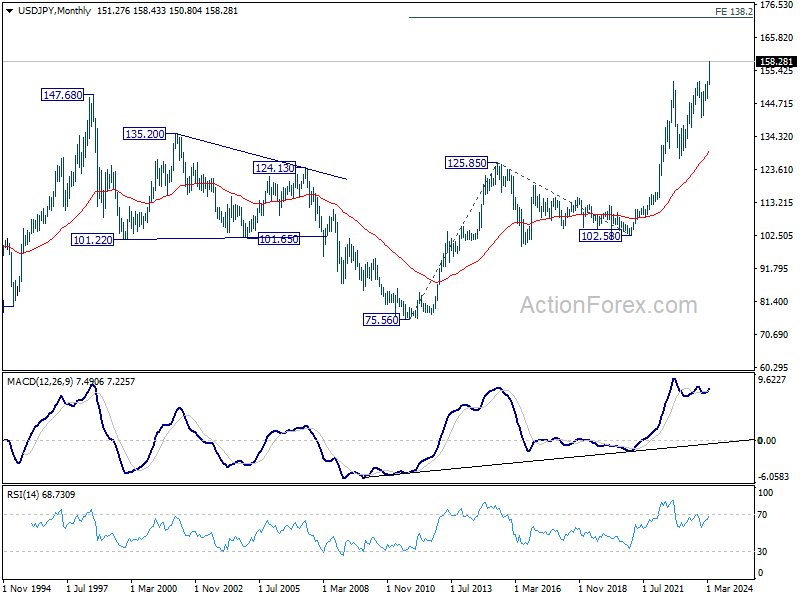
In the long term picture, as long as 140.25 support holds, up trend from 75.56 (2011 low) is still in progress. Next target is 138.2% projection of 75.56 (2011 low) to 125.85 (2015 high) from 102.58 at 172.08.
GBP/USD Weekly Outlook
GBP/USD rebounded after edging lower to 1.2298 last week. But upside is capped by 1.2538 support turned resistance. Initial bias remains neutral this week first. On the downside, break of 1.2421 will argue that rebound from 1.2298 has completed and bring retest of this low. However, decisive break of 1.2538 will bring stronger rally to 55 D EMA (now at 1.2582) and above.
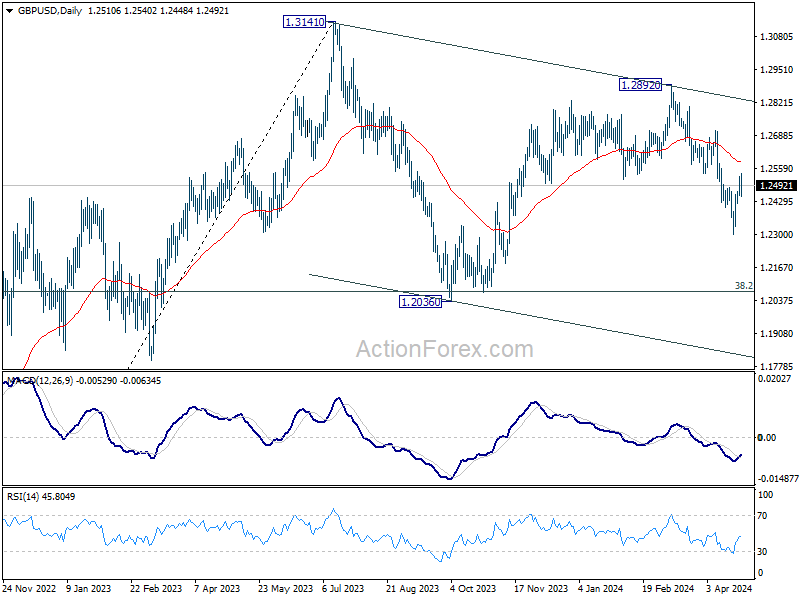
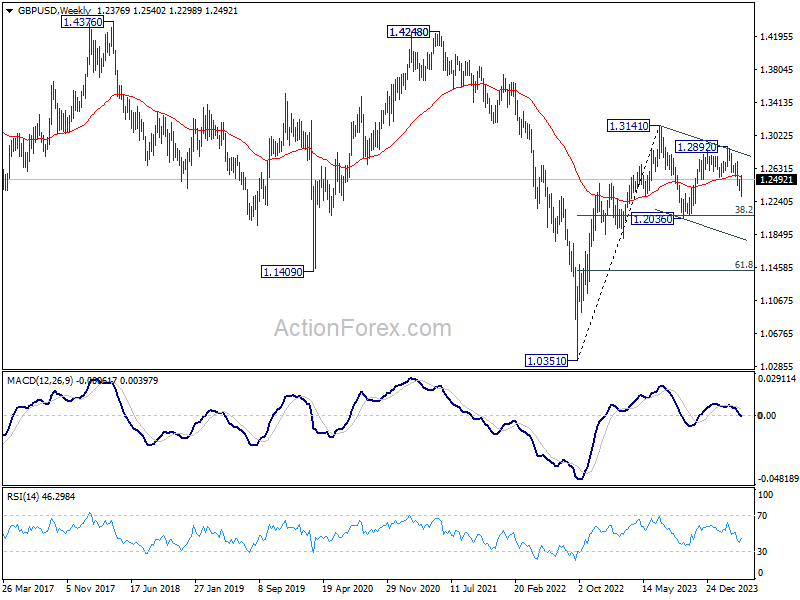
In the bigger picture, price actions from 1.3141 medium term top are seen as a corrective pattern to up trend from 1.0351 (2022 low). Fall from 1.2892 is seen as the third leg. Deeper decline would be seen to 1.2036 support and possibly below. But strong support should emerge from 61.8% retracement of 1.0351 to 1.2452 at 1.1417 to complete the correction.
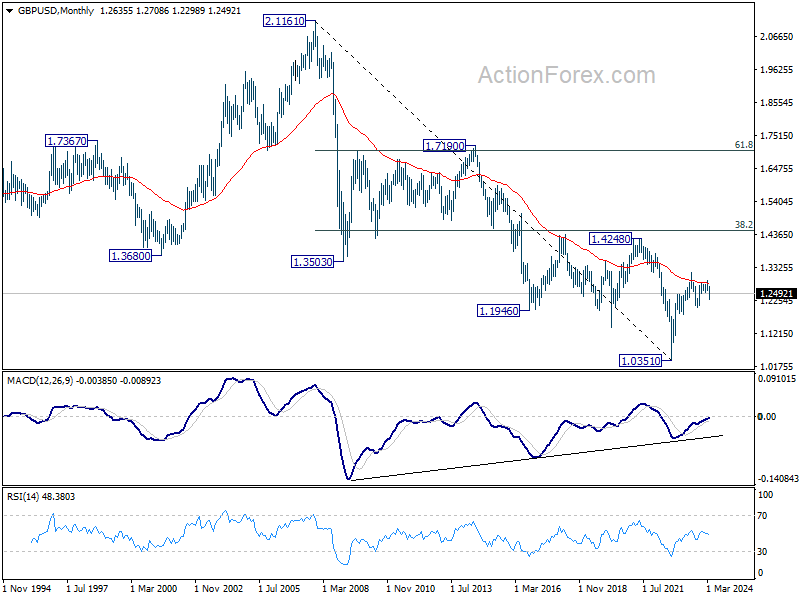
In the long term picture, a long term bottom should be in place at 1.0351 on bullish convergence condition in M MACD. But momentum of the rebound from 1.3051 argues GBP/USD is merely in consolidation, rather than trend reversal. Range trading is likely between 1.0351/4248 for some more time.
USD/CHF Weekly Outlook
USD/CHF breached 0.9151 resistance briefly but retreated back into established range. Initial bias remains neutral and more consolidations could be seen. On the upside, firm break of 0.9151 will resume the rally from 0.8332 and should target 0.9243 key resistance next. On the downside, break of 0.9085 will turn bias to the downside for deeper pullback.
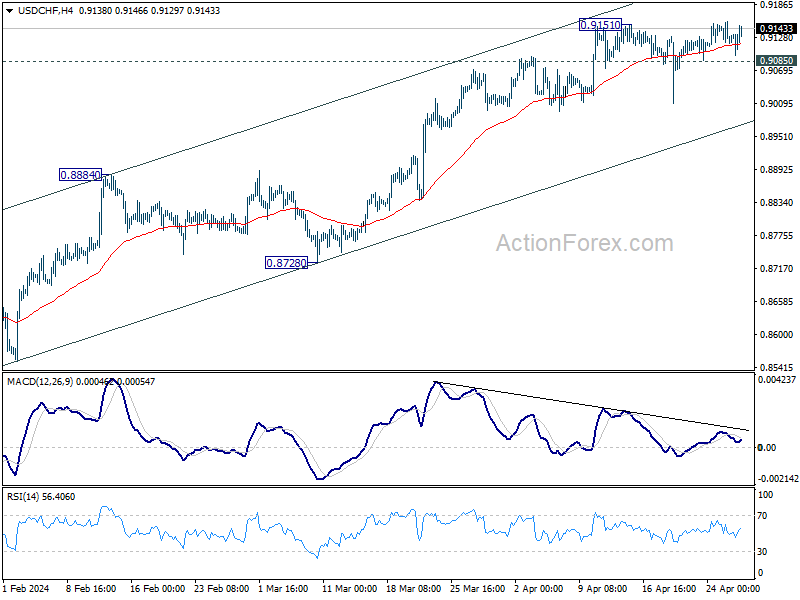
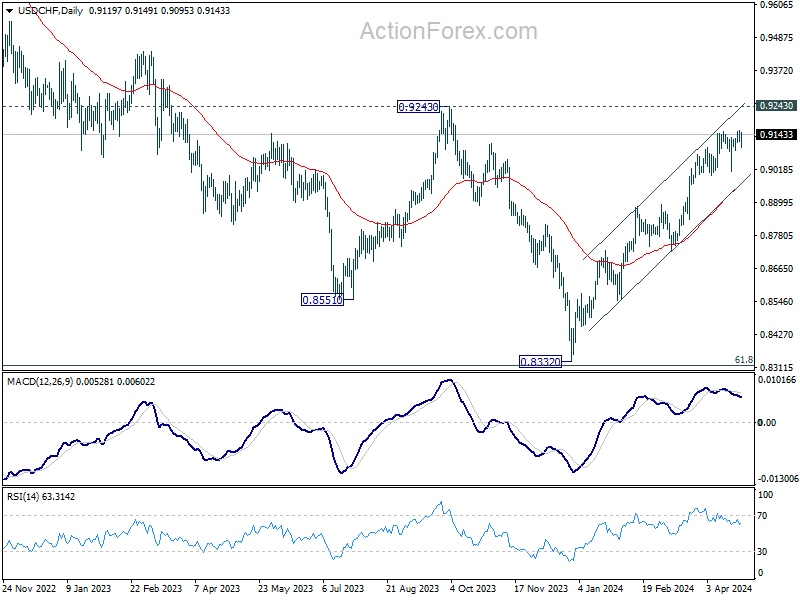
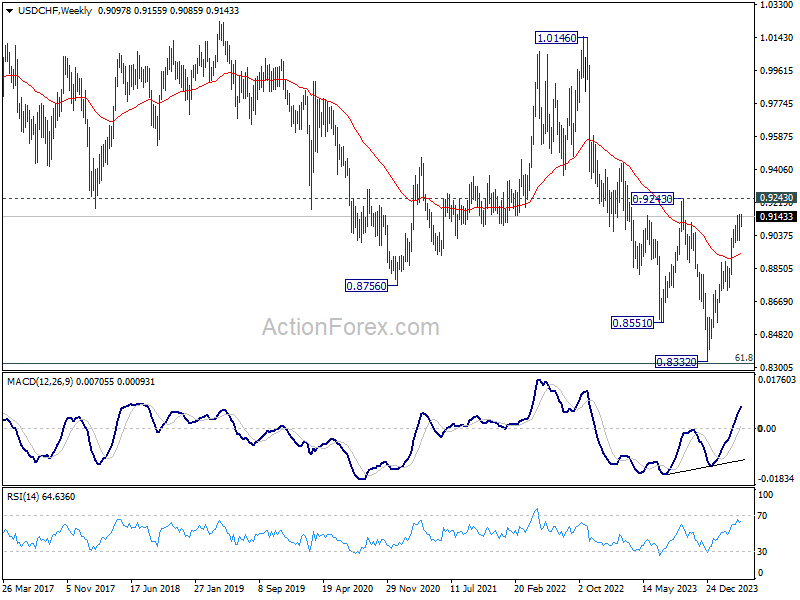
In the bigger picture, price actions from 0.8332 medium term bottom as tentatively seen as developing into a corrective pattern to the down trend from 1.0146 (2022 high). Further rise would be seen as long as 0.8884 resistance turned support holds. But upside should be limited by 0.9243 resistance, at least on first attempt. However, decisive break of 0.9243 will argue that the trend has already reversed and turn medium term outlook bullish.
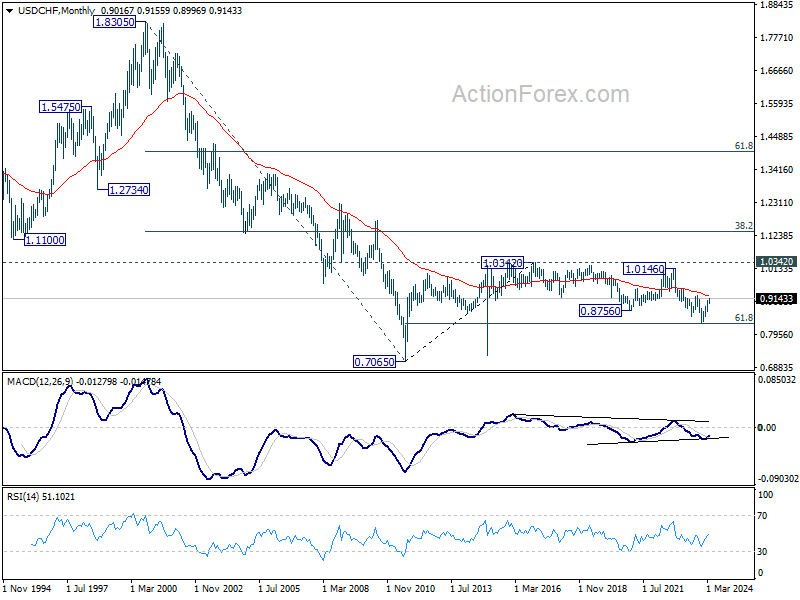
In the long term picture, price action from 0.7065 (2011 high) are seen as a corrective pattern to the multi-decade down trend from 1.8305 (2000 high). Strong rebound from 61.8% retracement of 0.7065 to 1.0342 (2016 high) will start the third leg as a medium term rally. But there will be no sign of long term reversal until firm break of 38.2% retracement of 1.8305 to 0.7065 at 1.1359.
AUD/USD Weekly Report
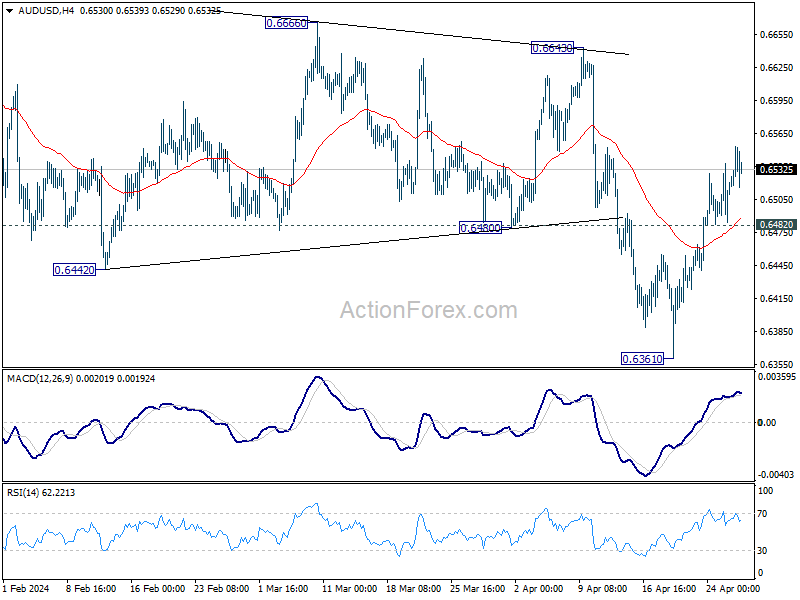
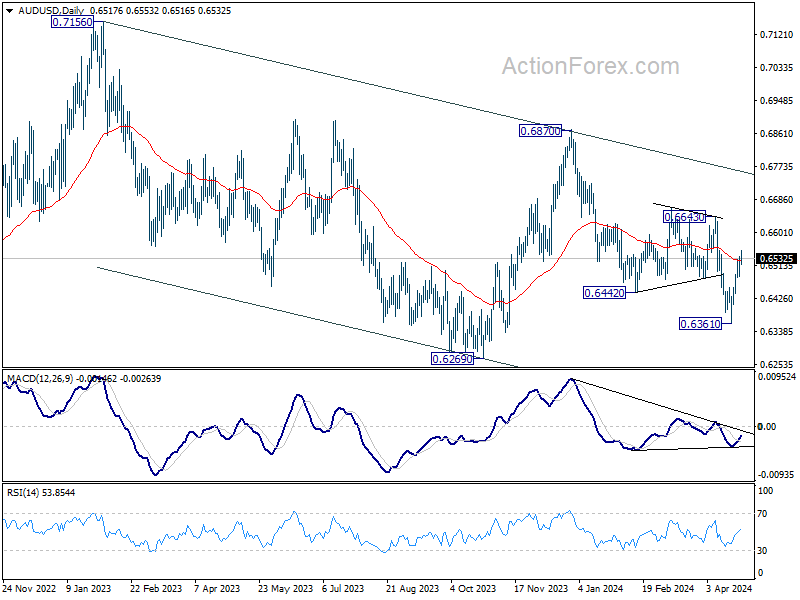
AUD/USD's rebound from 0.6361 extended higher last week and further rally is expected as long as 0.6482 support holds. Sustained break of 55 D EMA (now at 0.6527) will argue that fall from 0.6870 has completed, and bring further rally to 0.6643 resistance next. On the downside, though, break of 0.6482 minor support will turn bias back to the downside for retesting 0.6361 instead.
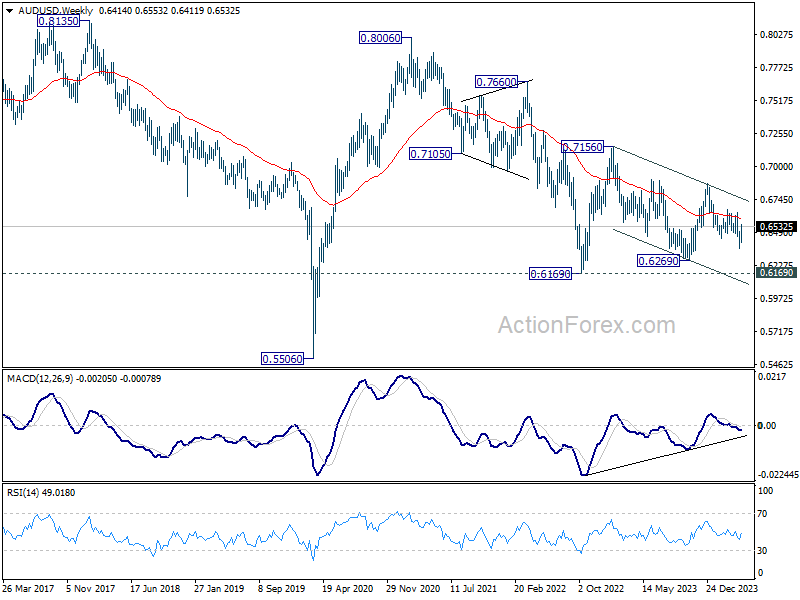
In the bigger picture, price actions from 0.6169 (2022 low) are seen as a medium term corrective pattern to the down trend from 0.8006 (2021 high). Fall from 0.7156 (2023 high) is seen as the second leg, which is still in progress. Overall, sideway trading could continue in range of 0.6169/7156 for some more time. But as long as 0.7156 holds, an eventual downside breakout would be mildly in favor.
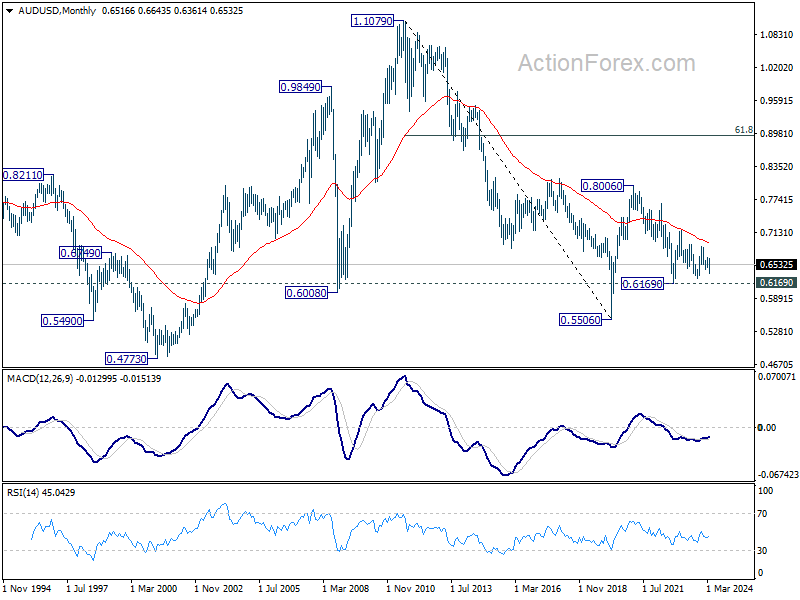
In the long term picture, the down trend from 1.1079 (2011 high) should have completed at 0.5506 (2020 low) already. It's unsure yet whether price actions from 0.5506 are developing into a corrective pattern, or trend reversal. But in either case, fall from 0.8006 is seen the second leg of the pattern. Hence, in case of deeper decline, strong support should emerge above 0.5506 to bring reversal.
USD/CAD Weekly Outlook
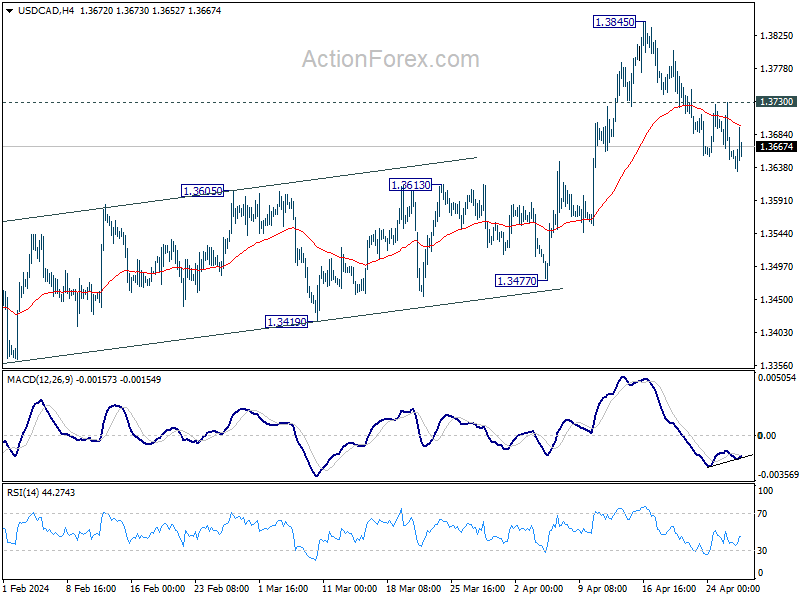
USD/CAD's fall from 1.3845 extended lower last week and further decline is in favor as long as 1.3730 minor resistance holds. Next target is 55 D EMA (now at 1.3599). On the upside, above 1.3730 minor resistance will turn bias back to the upside for retesting 1.3845 instead.
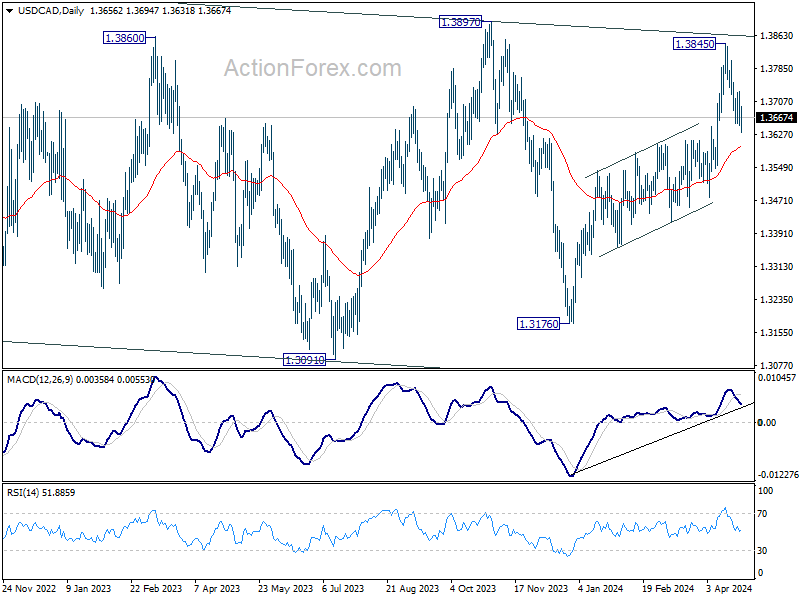
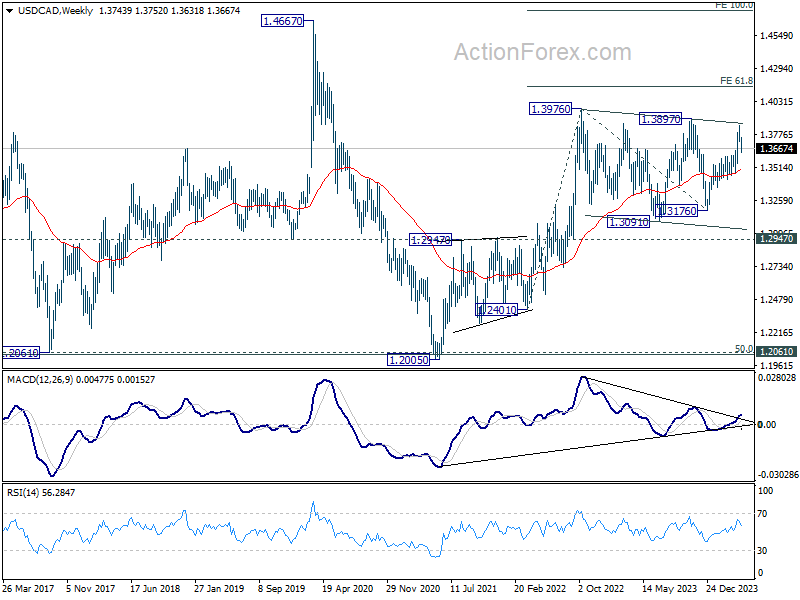
In the bigger picture, price actions from 1.3976 (2022 high) are viewed as a corrective pattern only. In case of another fall, strong support should emerge above 1.2947 resistance turned support to bring rebound. Firm break of 1.3976 will confirm up resumption of whole up trend from 1.2005 (2021 low). Next target is 61.8% projection of 1.2401 to 1.3976 from 1.3176 at 1.4149.
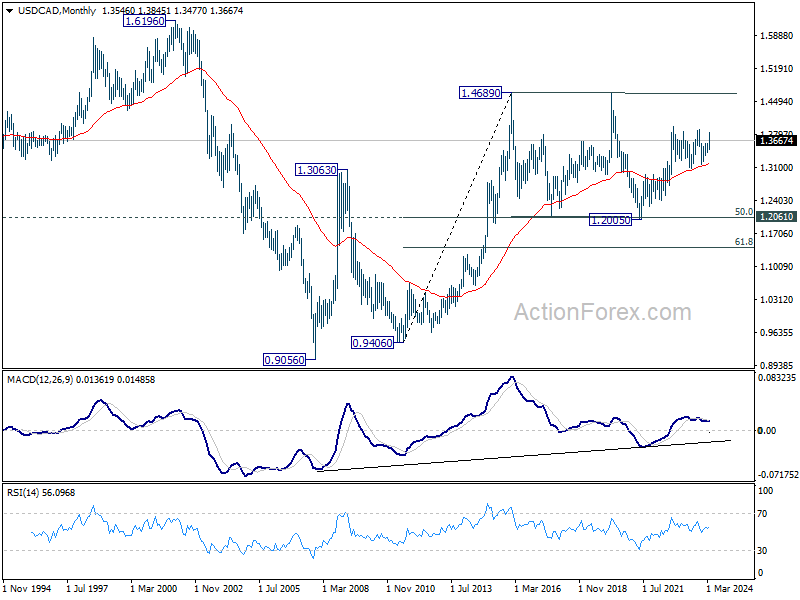
In the longer term picture, price actions from 1.4689 (2016 high) are seen as a consolidation pattern, which might have completed at 1.2005. That is, up trend from 0.9506 (2007 low) is expected to resume at a later stage. This will remain the favored case as long as 1.2947 resistance turned support holds.
GBP/JPY Weekly Outlook
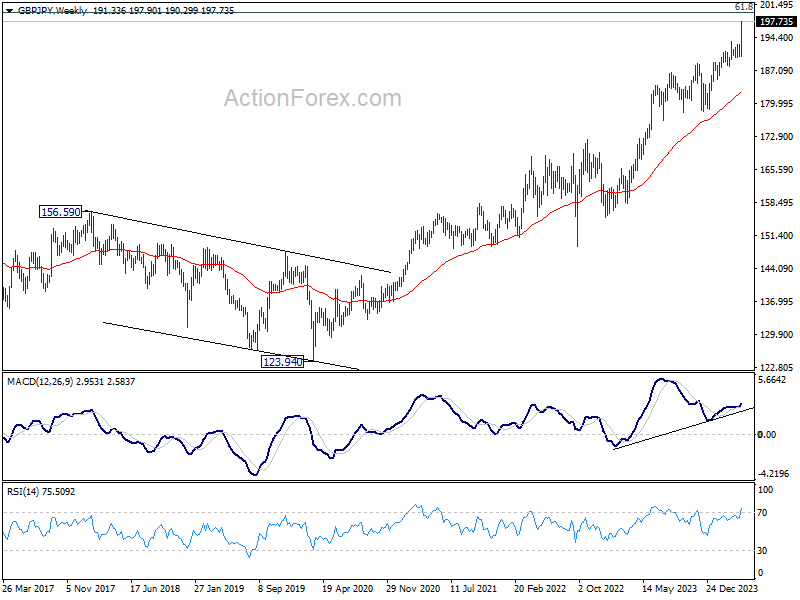
GBP/JPY's up trend resumed last week and accelerated to as high as 197.90. Initial bias remains on the upside this week. Next target is 198.89 projection level. On the downside, below 195.85 minor support will turn intraday bias neutral and bring consolidations. But pullback should be contained well above 193.51 resistance turned support to bring another rally.
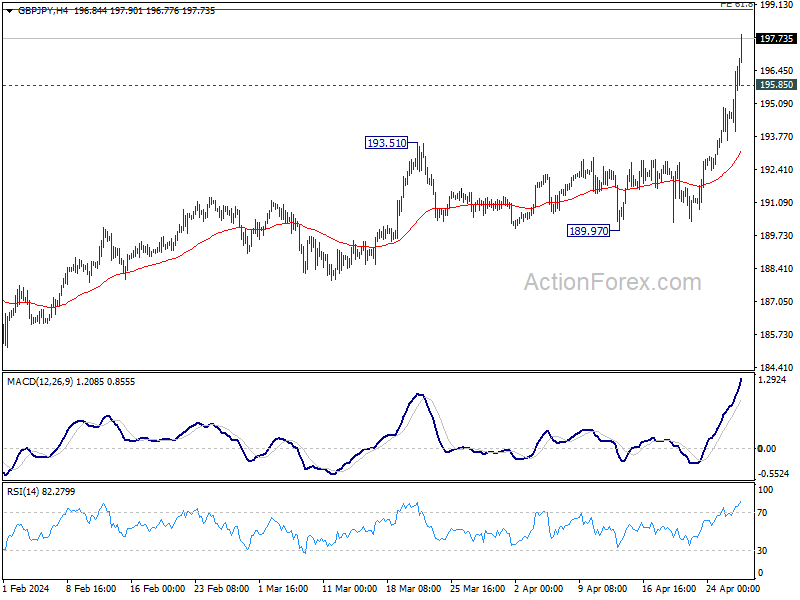
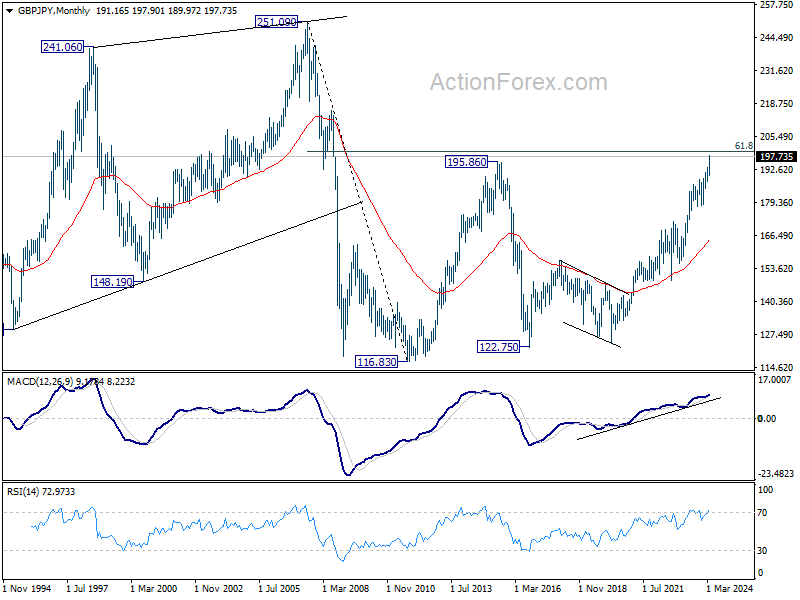
In the bigger picture, current rally is part of the up trend from 123.94 (2020 low), 195.86 long term resistance (2015 high) was already broken. Next target is 61.8% projection of 155.33 to 188.63 from 178.32 at 198.89 next. Break of 189.97 support is needed to be the first sign of medium term topping. Otherwise, outlook will remain bullish in case of retreat.
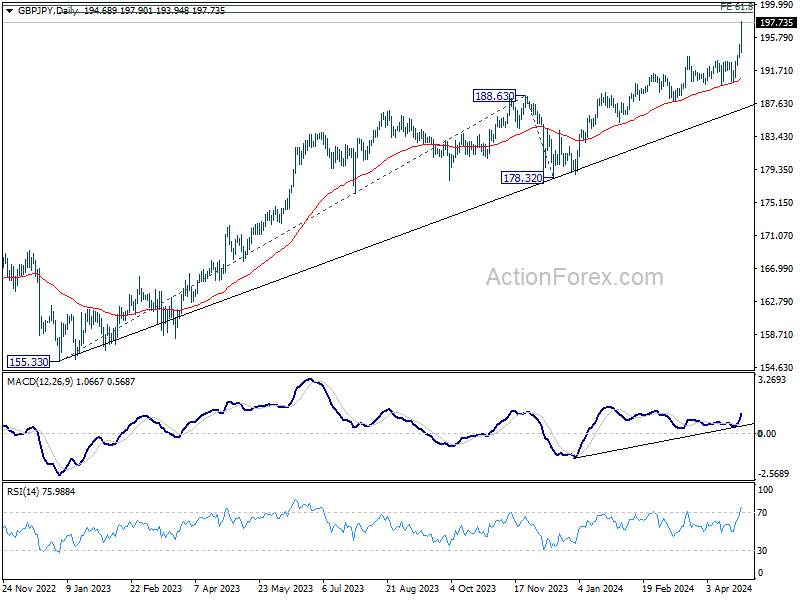
In the longer term picture, rise from 122.75 (2016 low) is seen as the third leg of the pattern from 116.83 (2011 low). Focus is now on 61.8% retracement of 251.09 (2007 high) to 116.83 at 199.80. Decisive break there would pave the way back to 251.09 in the long term.