

Sample Category Title
AUD/USD Daily Report
Daily Pivots: (S1) 0.6515; (P) 0.6535; (R1) 0.6554; More...
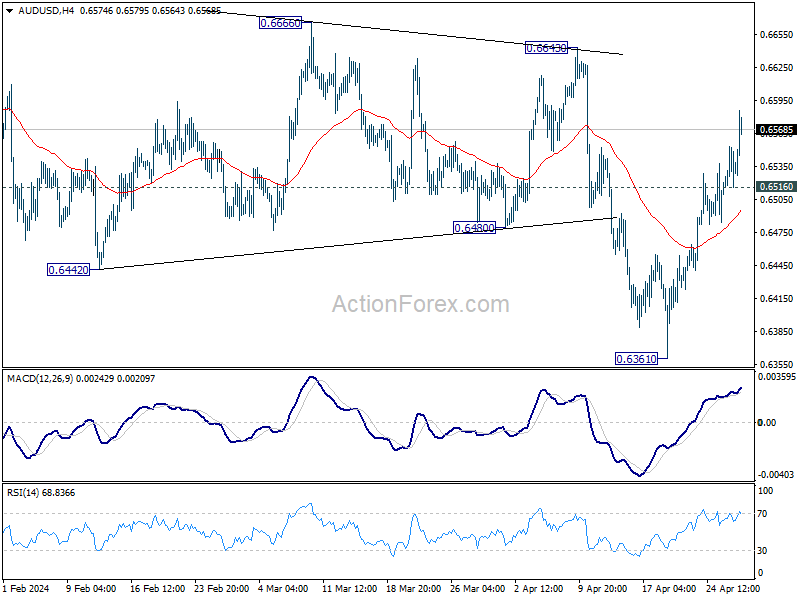
Intraday bias in AUD/USD remains on the upside as rise from 0.6361 short term bottom is in progress. Fall from 0.6870 might have completed at 0.6361 already. Further rally would be seen to 0.6643 resistance next. On the downside, below 0.6516 minor support will turn intraday bias neutral first.
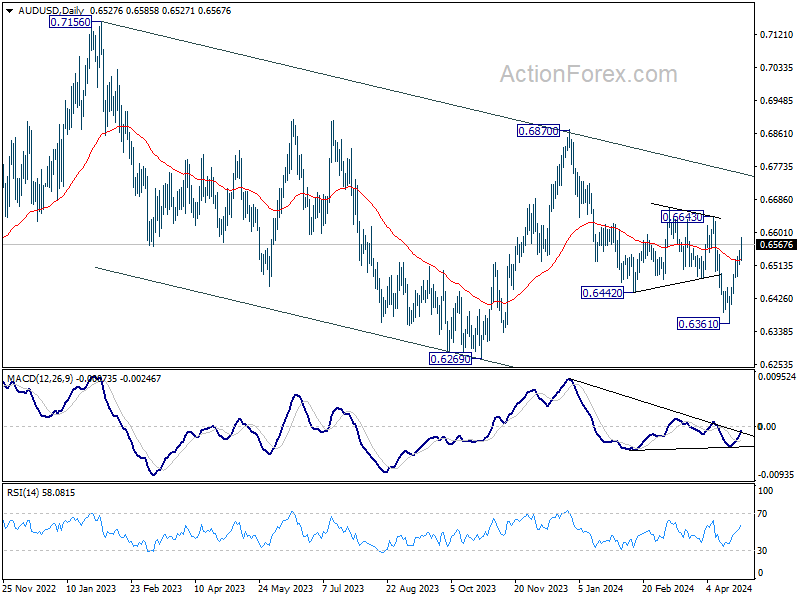
In the bigger picture, price actions from 0.6169 (2022 low) are seen as a medium term corrective pattern to the down trend from 0.8006 (2021 high). Fall from 0.7156 (2023 high) is seen as the second leg, which is still in progress. Overall, sideway trading could continue in range of 0.6169/7156 for some more time. But as long as 0.7156 holds, an eventual downside breakout would be mildly in favor.
EUR/USD Daily Outlook
Daily Pivots: (S1) 1.0660; (P) 1.0707; (R1) 1.0739; More...
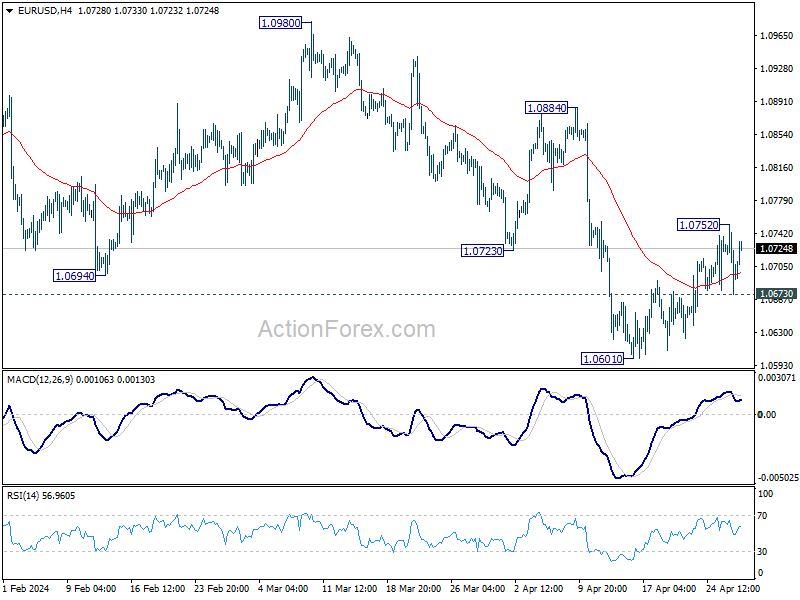
Intraday bias in EUR/USD remains neutral for the moment. On the upside, above 1.0752 will resume the rebound to 55 D EMA (now at 1.0780). On the downside, break of 1.0673 minor support will turn intraday bias to the downside for retesting 1.0601 low.
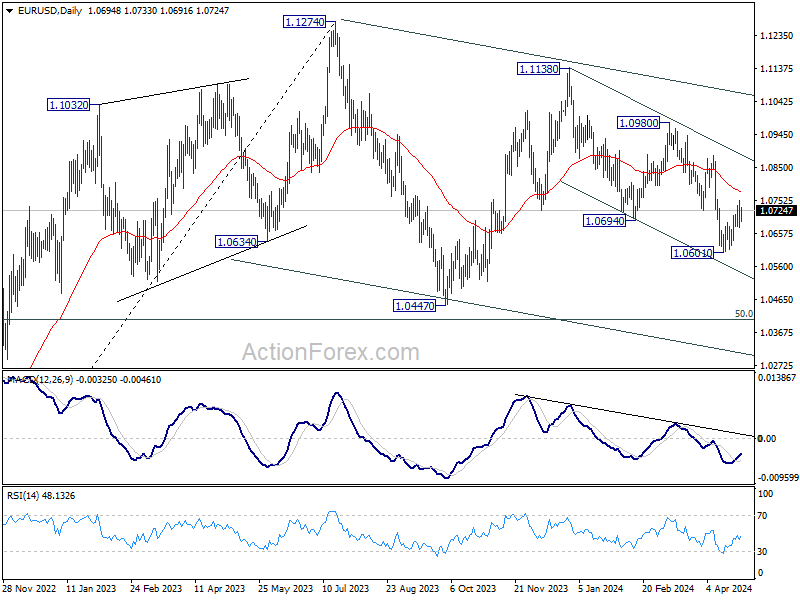
In the bigger picture, price actions from 1.1274 are viewed as a corrective pattern to rise from 0.9534 (2022 low). Current fall from 1.1138 is seen as the third leg. While deeper decline is would be seen to 1.0447 and possibly below, strong support should emerge from 61.8% retracement of 0.9534 to 1.1274 at 1.0199 to complete the correction.
GBP/USD Daily Outlook
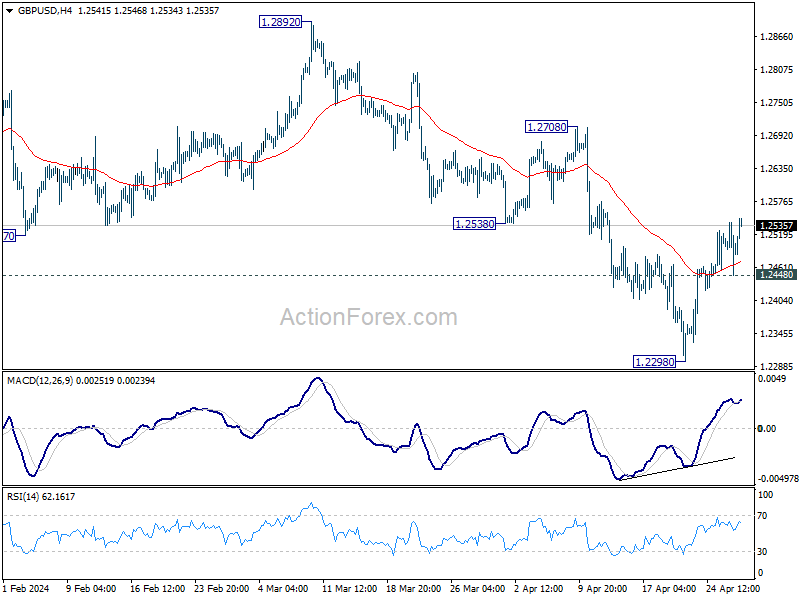
Daily Pivots: (S1) 1.2448; (P) 1.2495; (R1) 1.2540; More...
GBP/USD's rebound form 1.2298 is resuming and intraday bias is back on the upside. Further rally would be seen to 55 D EMA (now at 1.2582). Sustained break there will argue that fall from 1.2892 has completed already, and bring further rise to this resistance. Nevertheless, on the downside, break of 1.2448 minor support will bring retest of 1.2298 low instead.
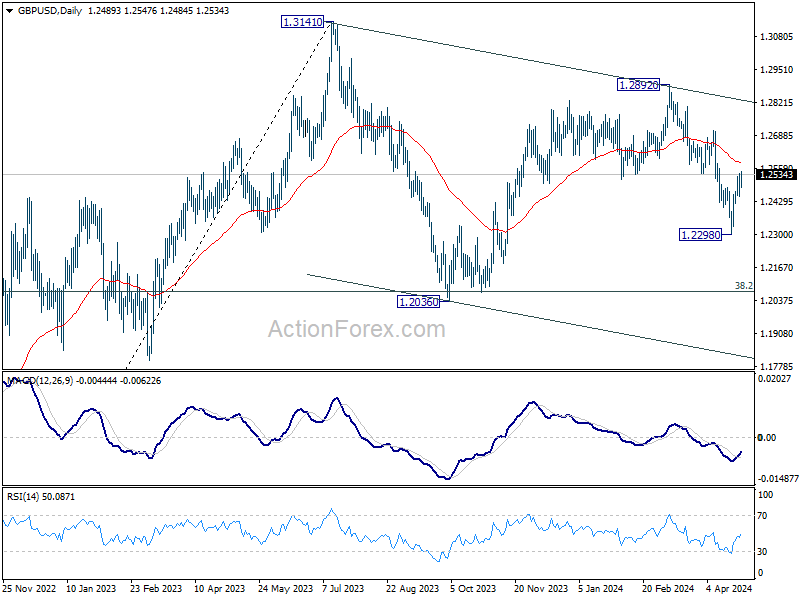
In the bigger picture, price actions from 1.3141 medium term top are seen as a corrective pattern to up trend from 1.0351 (2022 low). Fall from 1.2892 is seen as the third leg. Deeper decline would be seen to 1.2036 support and possibly below. But strong support should emerge from 61.8% retracement of 1.0351 to 1.2452 at 1.1417 to complete the correction.
USD/CHF Daily Outlook
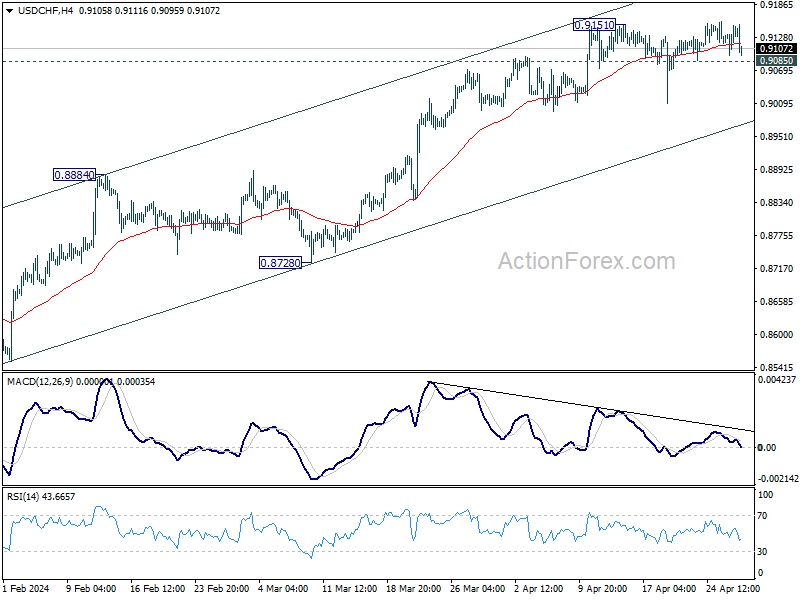
Daily Pivots: (S1) 0.9111; (P) 0.9130; (R1) 0.9165; More....
Intraday bias in USD/CHF remains neutral for the moment, and more consolidations could be seen. On the upside, firm break of 0.9151 will resume the rally from 0.8332 and should target 0.9243 key resistance next. On the downside, break of 0.9085 will turn bias to the downside for deeper pullback.
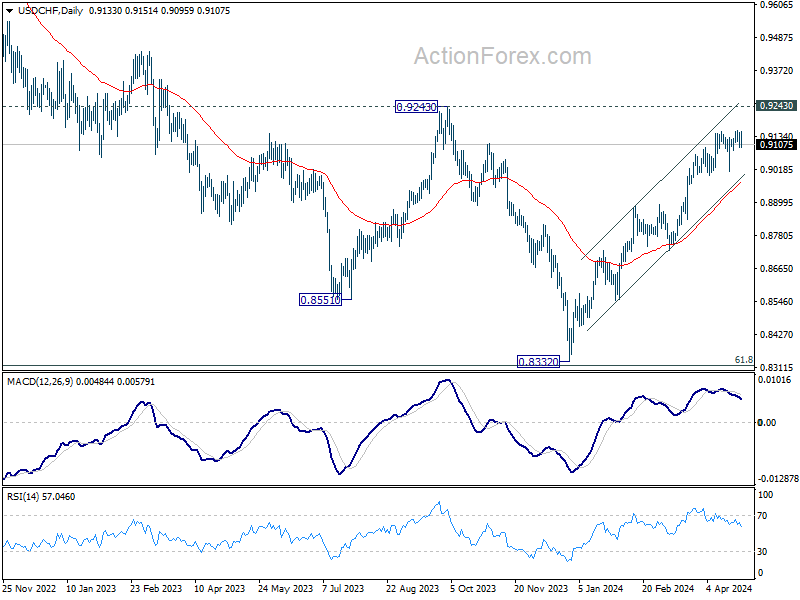
In the bigger picture, price actions from 0.8332 medium term bottom as tentatively seen as developing into a corrective pattern to the down trend from 1.0146 (2022 high). Further rise would be seen as long as 0.8884 resistance turned support holds. But upside should be limited by 0.9243 resistance, at least on first attempt. However, decisive break of 0.9243 will argue that the trend has already reversed and turn medium term outlook bullish.
USD/JPY Daily Outlook
Daily Pivots: (S1) 156.06; (P) 157.26; (R1) 159.53; More...
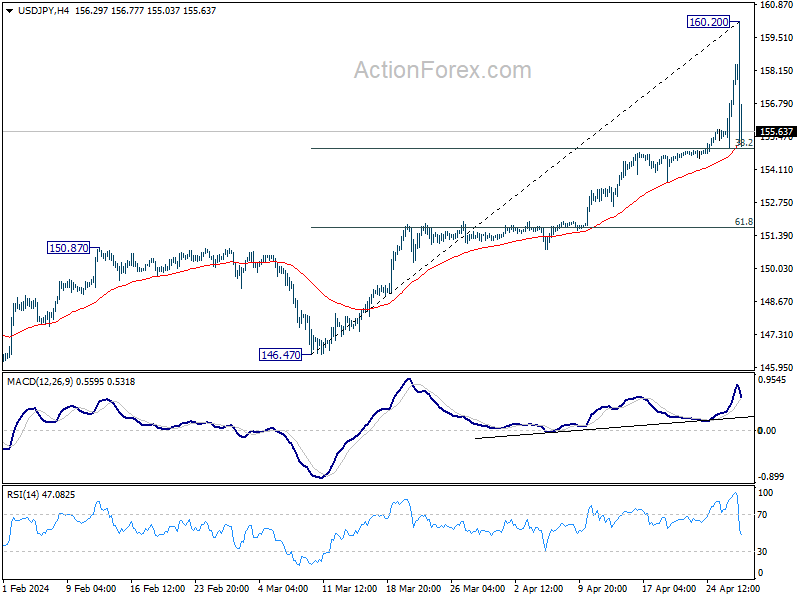
Yen's steep retreat today suggests that a short term top is already in place 160.20, close to 160 psychological level. Intraday bias is turned neutral for consolidations first. Some support might come from 38.2% retracement of 146.47 to 160.20 at 154.95 to bring recovery. But break of 160.20 is not envisaged for now. However, firm break of 154.95 will turn bias to the downside for deeper correction to 55 D EMA (now at 151.80).
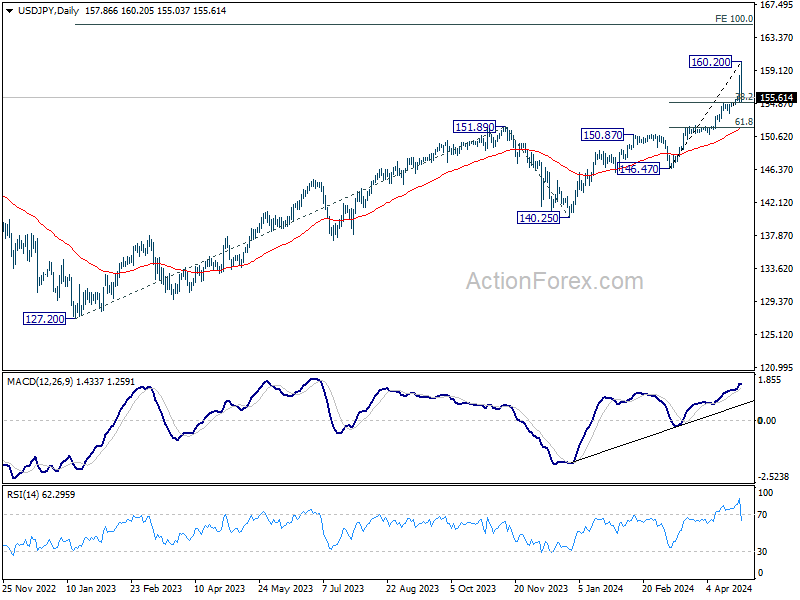
In the bigger picture, current rise from 140.25 is seen as the third leg of the up trend from 127.20 (2023 low). Next target is 100% projection of 127.20 to 151.89 from 140.25 at 164.94. Outlook will remain bullish as long as 150.87 resistance turned support holds, even in case of deep pullback.
Yen Rebounds Vigorously Post-160 Breach as Traders Take Profits
Japanese Yen mounted a strong comeback in Asian session today after initial dip through 160 psychological support against Dollar. While the moves are exaggerated by today's thin trading volumes due to public holiday in Japan, the strong rebound is marked by widespread squaring of short positions. Traders are clearly on guard against intervention by Japanese authorities and opt for taking profits first. For now, there is no definitive signal of trend reversal yet. But Yen will likely enter a period of consolidation as the market anticipates the next significant move.
On the economic front, today's calendar is relatively light, featuring only German CPI flash and Eurozone Economic Sentiment Indicator. However, the week ahead is packed with significant events and data releases that are likely to move global markets. The focal point will undoubtedly be FOMC rate decision, but other crucial data such as US ISM indexes and Non-Farm Payrolls, Eurozone CPI flash, Canadian GDP, Australian retail sales, New Zealand employment, and China's PMIs will also command attention.
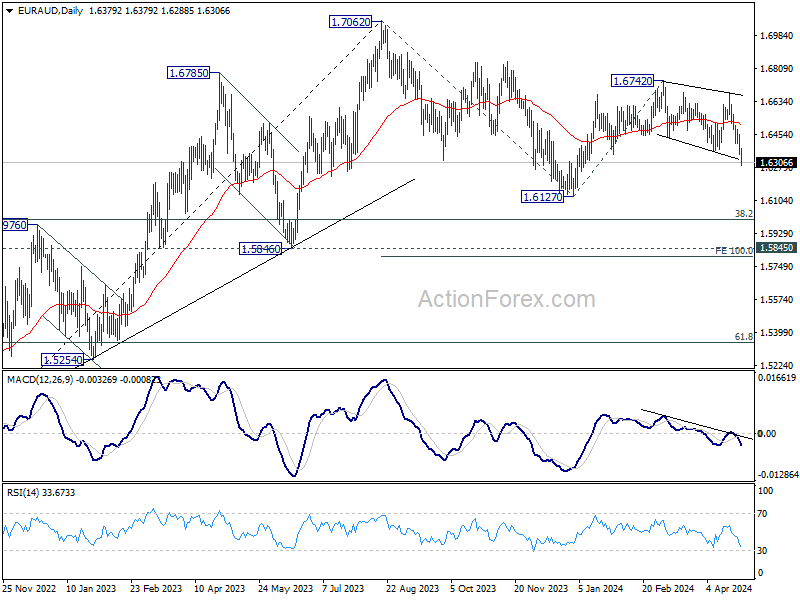
Technically, Australian Dollar's rally is gaining momentum today. EUR/AUD's decline is accelerating to 1.6288 so far. Current fall from 1.6742 is seen as the third leg of the pattern from 1.7062, targeting 1.6127 support, or even further to 100% projection of 1.7062 to 1.6127 from 1.6742 at 1.5807.
In Asia, at the time of writing, Hong Kong HSI is up 1.29%. China Shanghai SSE is up 0.80%. Singapore Strait Times is down -0.23%. Japan is on holiday.
Intense Focus on FOMC Meeting Amid Speculations of Hawkish Shifts by Powell
All eyes are on a series of high-stakes economic updates this week, with a central focus on FOMC meeting. Markets broadly expects that federal funds rates will hold steady at the current range of 5.25-5.50%. Given that the next set of economic projections and dot plot won't be available until June, the focus will intensely pivot towards FOMC's statement and particularly to Chair Jerome Powell's press conference following the meeting.
Market participants are buzzing with speculation that Powell might adopt a more hawkish tone than previously observed. This shift is anticipated due to recent economic data that suggest stalling in the disinflationary process, a trend that complicates Fed's pathway to easing monetary policy. Analysts are considering several possible outcomes. At the very least, Powell could indicate a consensus among FOMC members supporting fewer than three rate cuts this year. In a more pronounced hawkish shift, he might acknowledge the possibility of no rate cut in 2024 or even hint at the potential necessity for another rate hike if inflationary pressures do not subside adequately.
In addition to FOMC, the US economic calendar is packed with market-moving data releases too, including consumer confidence, ISM manufacturing and services indexes, and the critical non-farm payroll figures. 's
Across the Atlantic, Eurozone will also be under scrutiny with the release of its CPI flash estimate and preliminary GDP figures for Q1. While these figures are unlikely to derail ECB provisional plans for a rate cut in June, they are essential for gauging the trajectory of policy easing beyond this point.
In Canada, the spotlight will be on the upcoming GDP release, following recent BoC summary of deliberations that revealed a clear division among officials regarding the timing of the first rate cut. The decision in June will likely depend on forthcoming economic and inflation data, making this GDP release particularly significant.
Globally, other important economic data points include Swiss CPI, retail sales from Australia, employment figures from New Zealand, and notably, China's PMI data. The latter will be especially significant as stronger figures could confirm that China's recovery is on a firmer footing, uplifting regional market sentiment.
Here are some highlights for the week:
- Monday: Germany CPI flash
- Tuesday: Japan industrial production, retail sales, unemployment rate, housing starts; New Zealand ANZ business confidence; Australia retail sales; China NBS PMIs, Caixin PMI manufacturing; France GDP flash; Germany import prices, retail sales, GDP flash; Swiss KOF economic barometer; UK M4 money supply, mortgage approvals; Eurozone CPI flash, GDP flash; Canada GDP; US employment cost index, house price index; Chicago PMI, consumer confidence.
- Wednesday: New Zealand employment; Japan PMI manufacturing PMI final; UK PMI manufacturing final; US ADP employment; ISM manufacturing, construction spending; Canada PMI manufacturing; FOMC rate decision.
- Thursday: New Zealand building permits; Japan monetary bas, consumer confidence, BoJ minutes; Australia building permits, goods trade balance; Swiss CPI, retail sales; Eurozone PMI manufacturing final; Canada trade balance; US jobless claims, non-farm productivity, trade balance, factory orders.
- Friday: France industrial production; UK PMI services final; Eurozone unemployment rate; US non farm payrolls, ISM services.
USD/JPY Daily Outlook
Daily Pivots: (S1) 156.06; (P) 157.26; (R1) 159.53; More...
Yen's steep retreat today suggests that a short term top is already in place 160.20, close to 160 psychological level. Intraday bias is turned neutral for consolidations first. Some support might come from 38.2% retracement of 146.47 to 160.20 at 154.95 to bring recovery. But break of 160.20 is not envisaged for now. However, firm break of 154.95 will turn bias to the downside for deeper correction to 55 D EMA (now at 151.80).
In the bigger picture, current rise from 140.25 is seen as the third leg of the up trend from 127.20 (2023 low). Next target is 100% projection of 127.20 to 151.89 from 140.25 at 164.94. Outlook will remain bullish as long as 150.87 resistance turned support holds, even in case of deep pullback.
Economic Indicators Update
| GMT | Ccy | Events | Actual | Forecast | Previous | Revised |
|---|---|---|---|---|---|---|
| 09:00 | EUR | Eurozone Economic Sentiment Indicator Apr | 96.3 | |||
| 09:00 | EUR | Eurozone Industrial Confidence Apr | -8.8 | |||
| 09:00 | EUR | Eurozone Services Sentiment Apr | 6.3 | |||
| 09:00 | EUR | Eurozone Consumer Confidence Apr F | -14.7 | -14.7 | ||
| 12:00 | EUR | Germany CPI M/M Apr P | 0.60% | 0.40% | ||
| 12:00 | EUR | Germany CPI Y/Y Apr P | 2.20% |
AUD/JPY jumps on both Yen weakness and Aussie strength
Japanese Yen's decline continued in today's Asian session, with USD/JPY breaching 160 mark amid notable absence of comments from Japanese officials, as the country is on holiday. While some profit-taking has occurred due to concerns in guard of intervention, traders seem poised to push the pair beyond 160 if Japan remains inactive.
Simultaneously, Australian Dollar rises broadly, supported by ongoing rebound in Hong Kong stocks and growing domestic debates over whether RBA should implement another rate hike. With the current interest rate at 4.35%, some analysts believe it may not be sufficient to adequately address inflationary pressures.
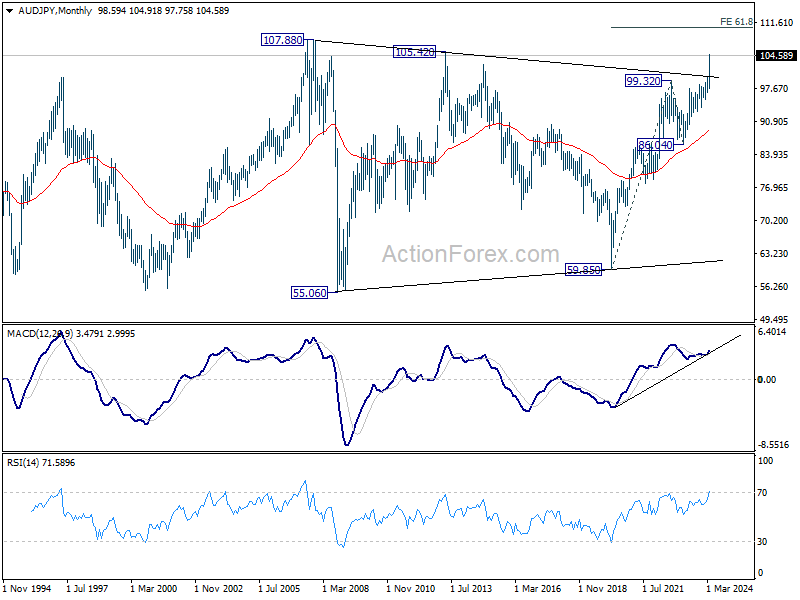
AUD/JPY is currently the top mover for April, up more than 5.7%. Technically, a focus now is whether 100% projection of 86.04 to 97.66 from 93.00 at 104.62 would cap upside in the near term. Break of 102.98 support will suggest that near term consolidation has started. Nevertheless, decisive break of 104.62 will pave the way to 138.2% projection at 109.05.
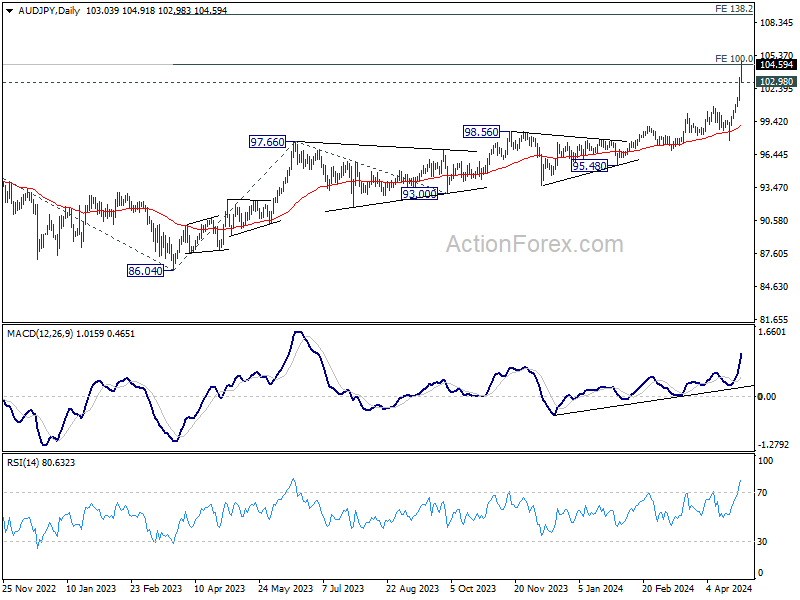
In the long term picture, momentum in AUD/JPY remains strong as seen in M MACD. The strong break of trend line resistance is another bullish sign. AUD/JPY might be ready to break out of from range through 107.88 (2007 high) to 61.8% projection of 59.85 to 99.32 from 86.04 at 110.43.
EUR/USD Eyes Recovery But Faces Uphill Task
Key Highlights
- EUR/USD started a recovery wave from the 1.0600 zone.
- A key bullish trend line is forming with support at 1.0680 on the 4-hour chart.
- GBP/USD is eyeing an upside break above the 1.2550 resistance zone.
- Gold prices are consolidating near the $2,320 zone.
EUR/USD Technical Analysis
The Euro extended its decline below the 1.0650 level against the US Dollar. EUR/USD tested the 1.0600 zone before the bulls appeared.
Looking at the 4-hour chart, the pair traded as low as 1.0598 and recently started a recovery wave. There was a move above the 1.0650 and 1.0680 resistance levels. The pair even tested the 50% Fib retracement level of the downward move from the 1.0885 swing high to the 1.0598 low.
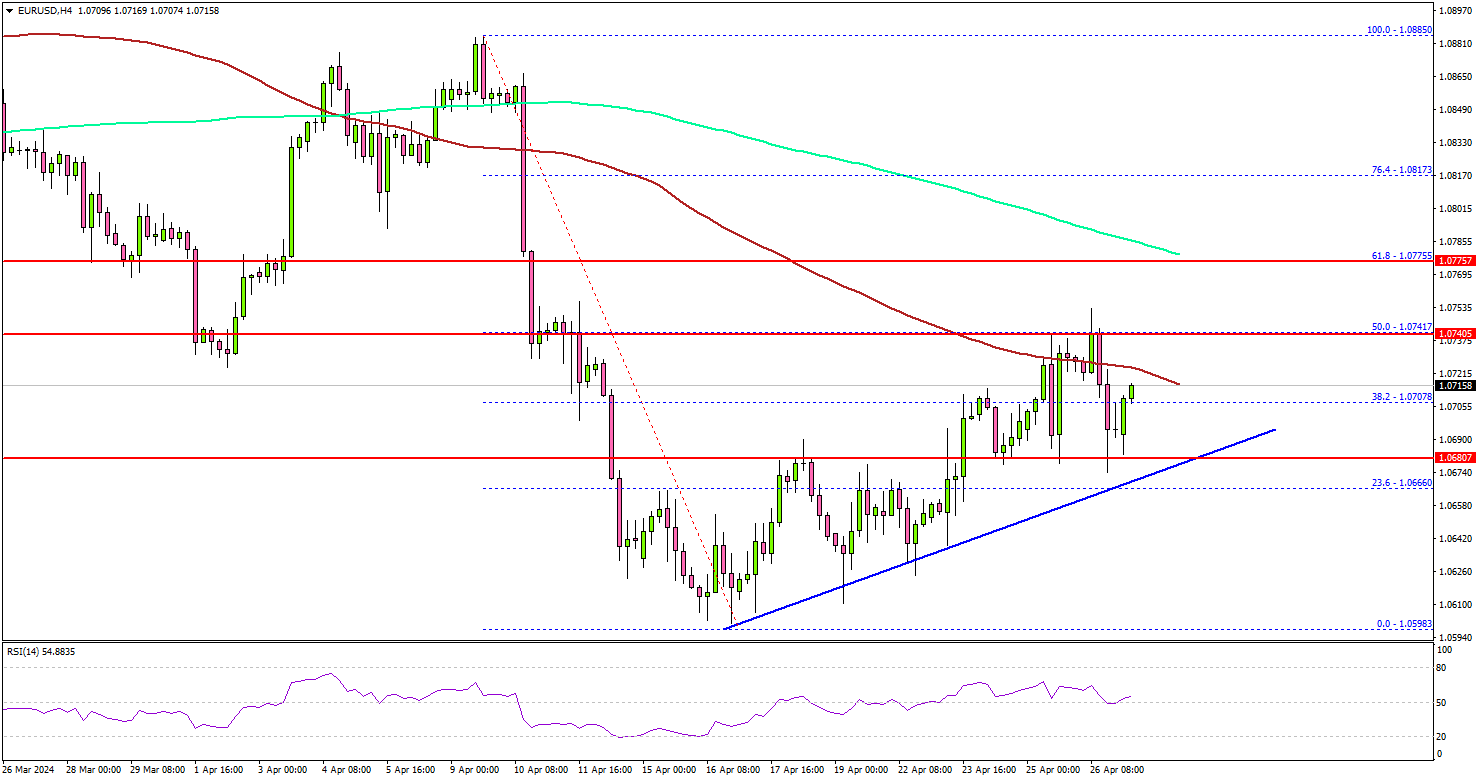
However, the bears seem to be active near the 1.0740 level. EUR/USD is now consolidating near the 100 simple moving average (red, 4-hour).
Immediate resistance is near the 1.0740 level. The first key resistance is near the 1.0775 zone and the 200 simple moving average (green, 4-hour). It is close to the 61.8% Fib retracement level of the downward move from the 1.0885 swing high to the 1.0598 low.
A clear move above the 1.0775 resistance could send the pair further higher. In the stated case, EUR/USD bulls could even aim for a move toward 1.0850.
Immediate support is near the 1.0680 level. There is also a key bullish trend line forming with support at 1.0680 on the same chart. The next major support is at 1.0620. If there is a downside break below the 1.0620 support, the pair might test 1.0600. The main support is now forming at 1.0580. Any more losses might send the pair toward 1.0520.
Looking at Gold, the price extended losses and it seems like the bears are active near the $2,350 resistance zone.
Economic Releases
- Euro Zone Economic Sentiment Indicator for April 2024 – Forecast 98.1, versus 96.3 previous.
- German Consumer Price Index for April 2024 (YoY) (Prelim) – Forecast +2.2%, versus +2.2% previous.
USDJPY Wave Analysis
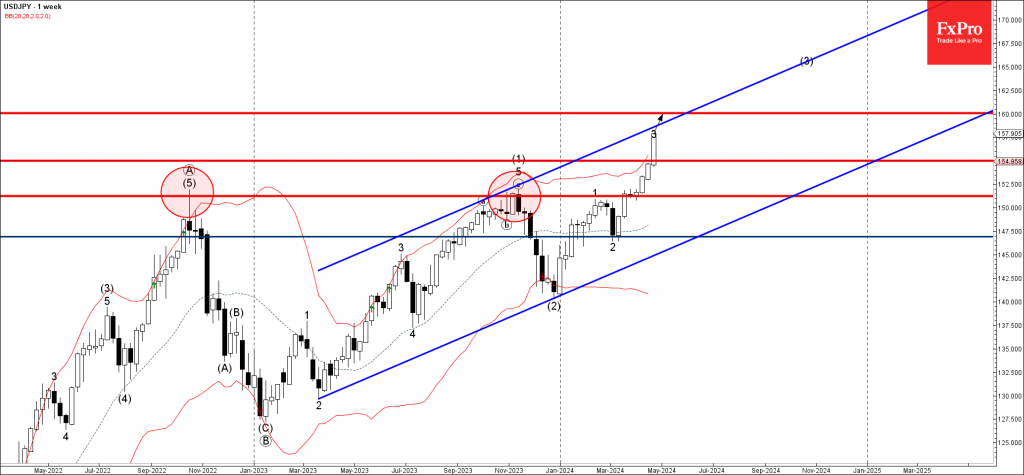
- USDJPY broke key resistance level 155.00
- Likely to rise to resistance level 160.00
USDJPY currency pair recently broke the key resistance level 155.00, which led to the acceleration of the active impulse waves 3 and (3).
The pair earlier broke the major resistance level 151.25 (which has been reversing the pair from 2022) – which was taken as the major buy signal by the FX traders.
Give the strongly bearish yen sentiment, USDJPY currency pair can be expected to rise further to the next resistance level 160.00, target for the completion of wave 3.
EURJPY Elliott Wave Analysis: How to Ride the Bullish Wave
Hello traders. Welcome to this technical blog post where we will delve into the EURJPY currency pair. By the end of this post, you should have a clearer understanding of the path EURJPY Elliott wave analysis is following and how you can participate in the upcoming significant movement on this pair. So, please join me on this journey.
If you’ve been keeping up with us on any of our social media platforms or reading our blog posts, you’ve likely come across our bullish outlook for Yen pairs, as illustrated in our posts, charts, or videos. We cover a total of 78 instruments, including 7 Yen pairs, among which EURJPY is included.
EURJPY Elliott Wave Analysis – 25th April Weekly Chart Update
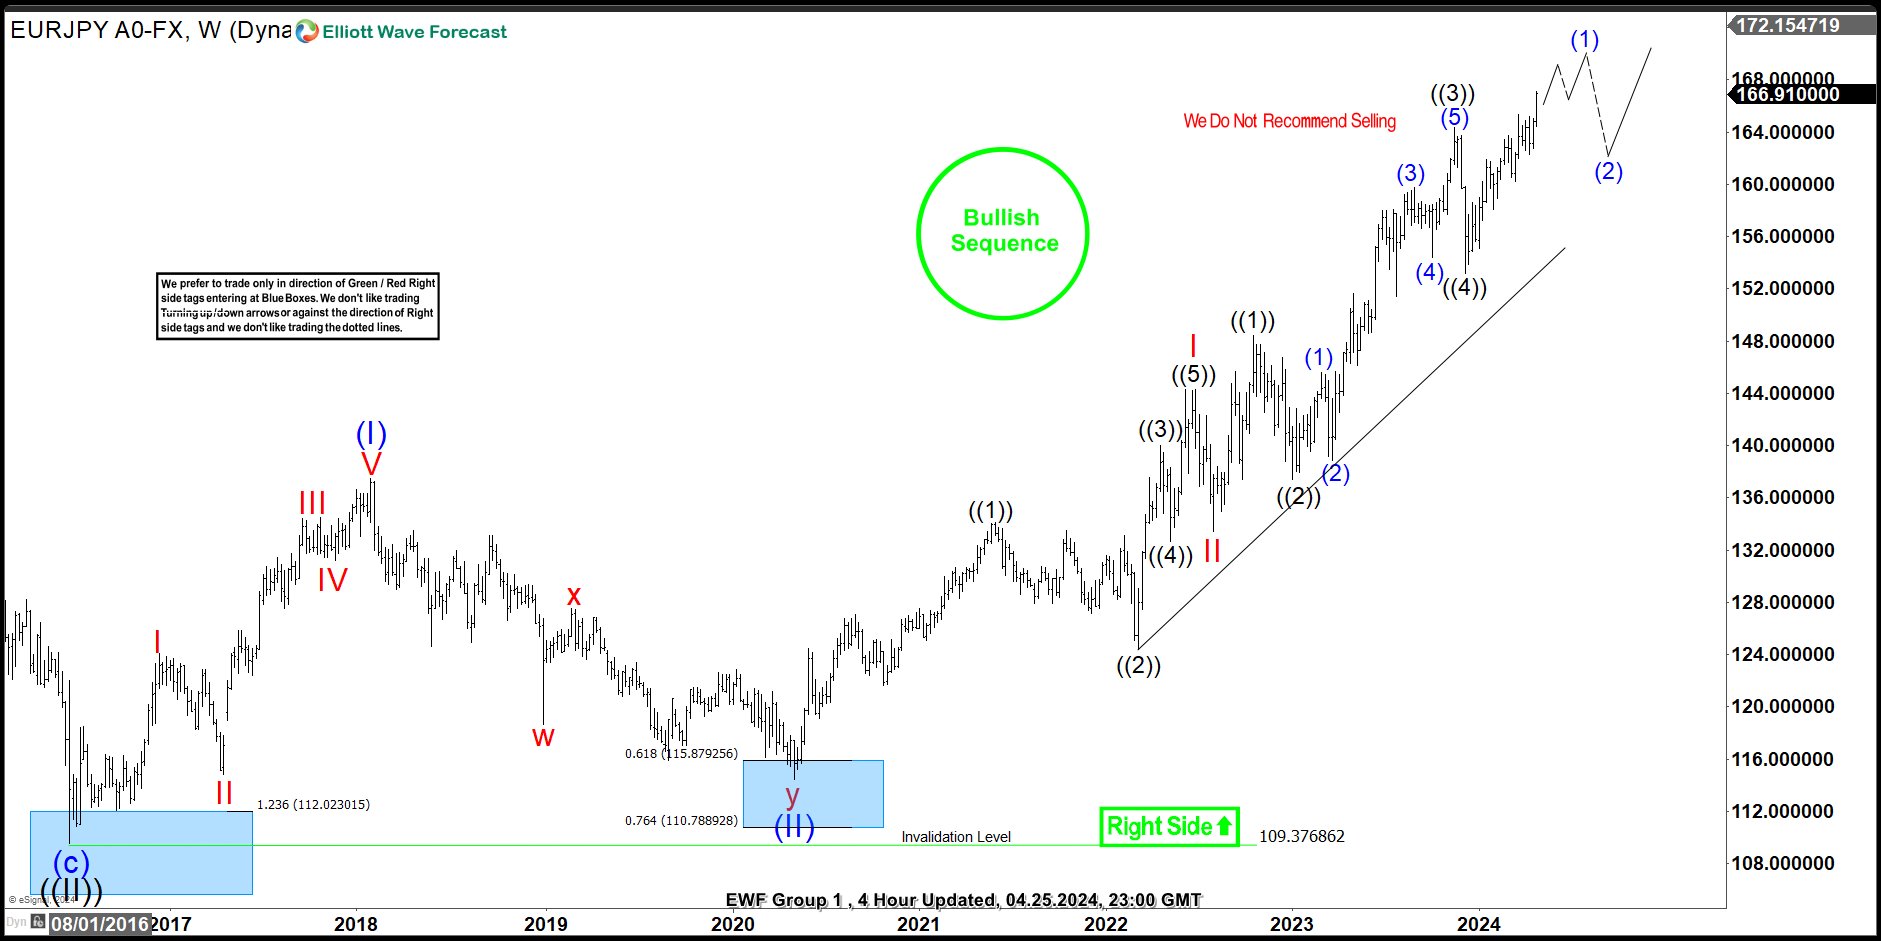
Above is the weekly chart we shared with members on 04.25.2024, illustrating a long-term bullish sequence on EURJPY. The chart depicts a super cycle degree impulse wave pattern that initiated in June 2016, following the conclusion of the grand super cycle degree wave ((II)). Consequently, we find ourselves in wave ((III)) of the super cycle degree, with the current position being within wave (III) of the super cycle degree. Looking further, we’re currently in wave III of (III) of ((III)). Based on this analysis, the long-term trend strongly favors the upside.
EURJPY Elliott Wave Analysis – 25th April Daily Chart Update
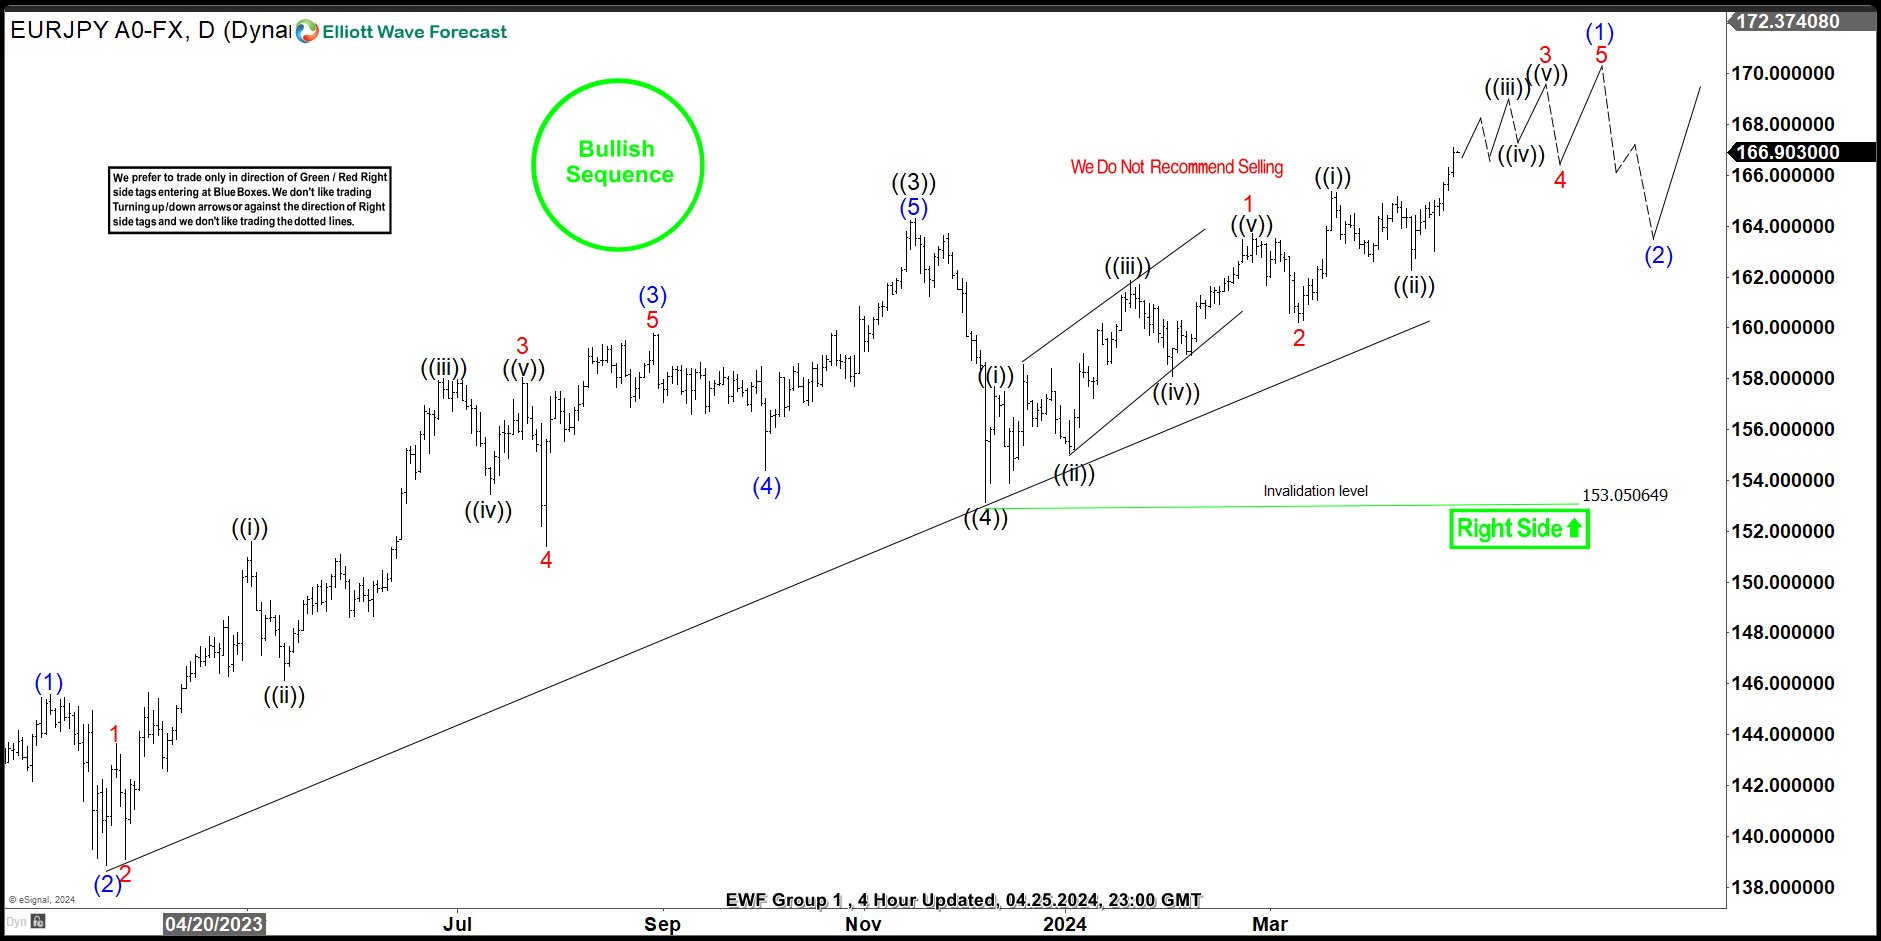 Now, let’s examine the EURJPY daily chart as of the close of the trading day on 04.25.2024. The chart above illustrates the sub-waves of wave III. Wave II of (III) concluded at the low in August 2022, and we’re now in III of (III). Additionally, wave III is in its 5th wave – wave ((5)) of III. However, wave ((5)) may have considerable room to ascend before completion, currently progressing in wave (1) of ((5)), which commenced in December 2023. Therefore, throughout 2024 thus far, we’ve maintained a bullish stance on EURJPY. Within wave (1) of ((5)), we’ve been scouting for opportunities to buy pullbacks in 3, 7, or 11 swings, such as the following setup shared with members on 04.13.2024
EURJPY Elliott Wave Analysis – 13th April H4 Update
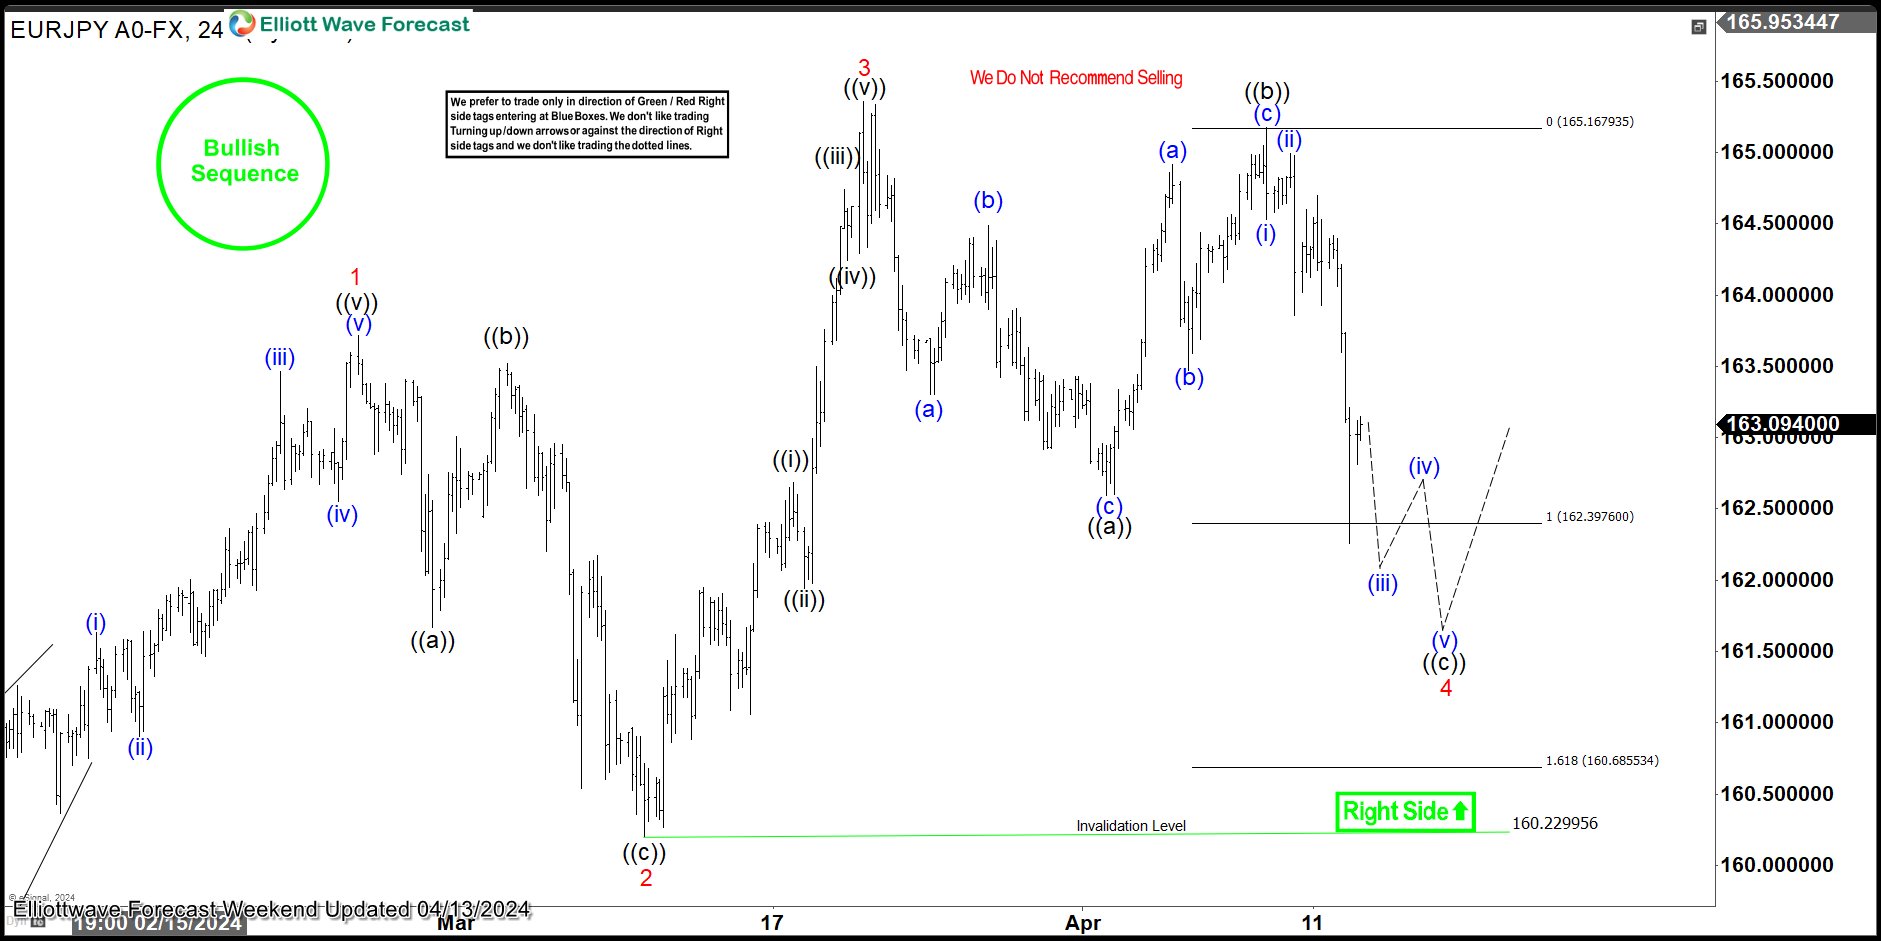
On 04.13.2024, we shared the H4 chart above with group 1 members. We expected wave 4 of (1) to end between 162.397-160.685 before starting an upward move to finish wave 5 of (1) in a diagonal pattern. As predicted, the price action matched our expectations. The rally we anticipated began right at the upper limit of the extreme zone, hitting 162.24 precisely.
EURJPY Elliott Wave Analysis – 26th April H4 Update
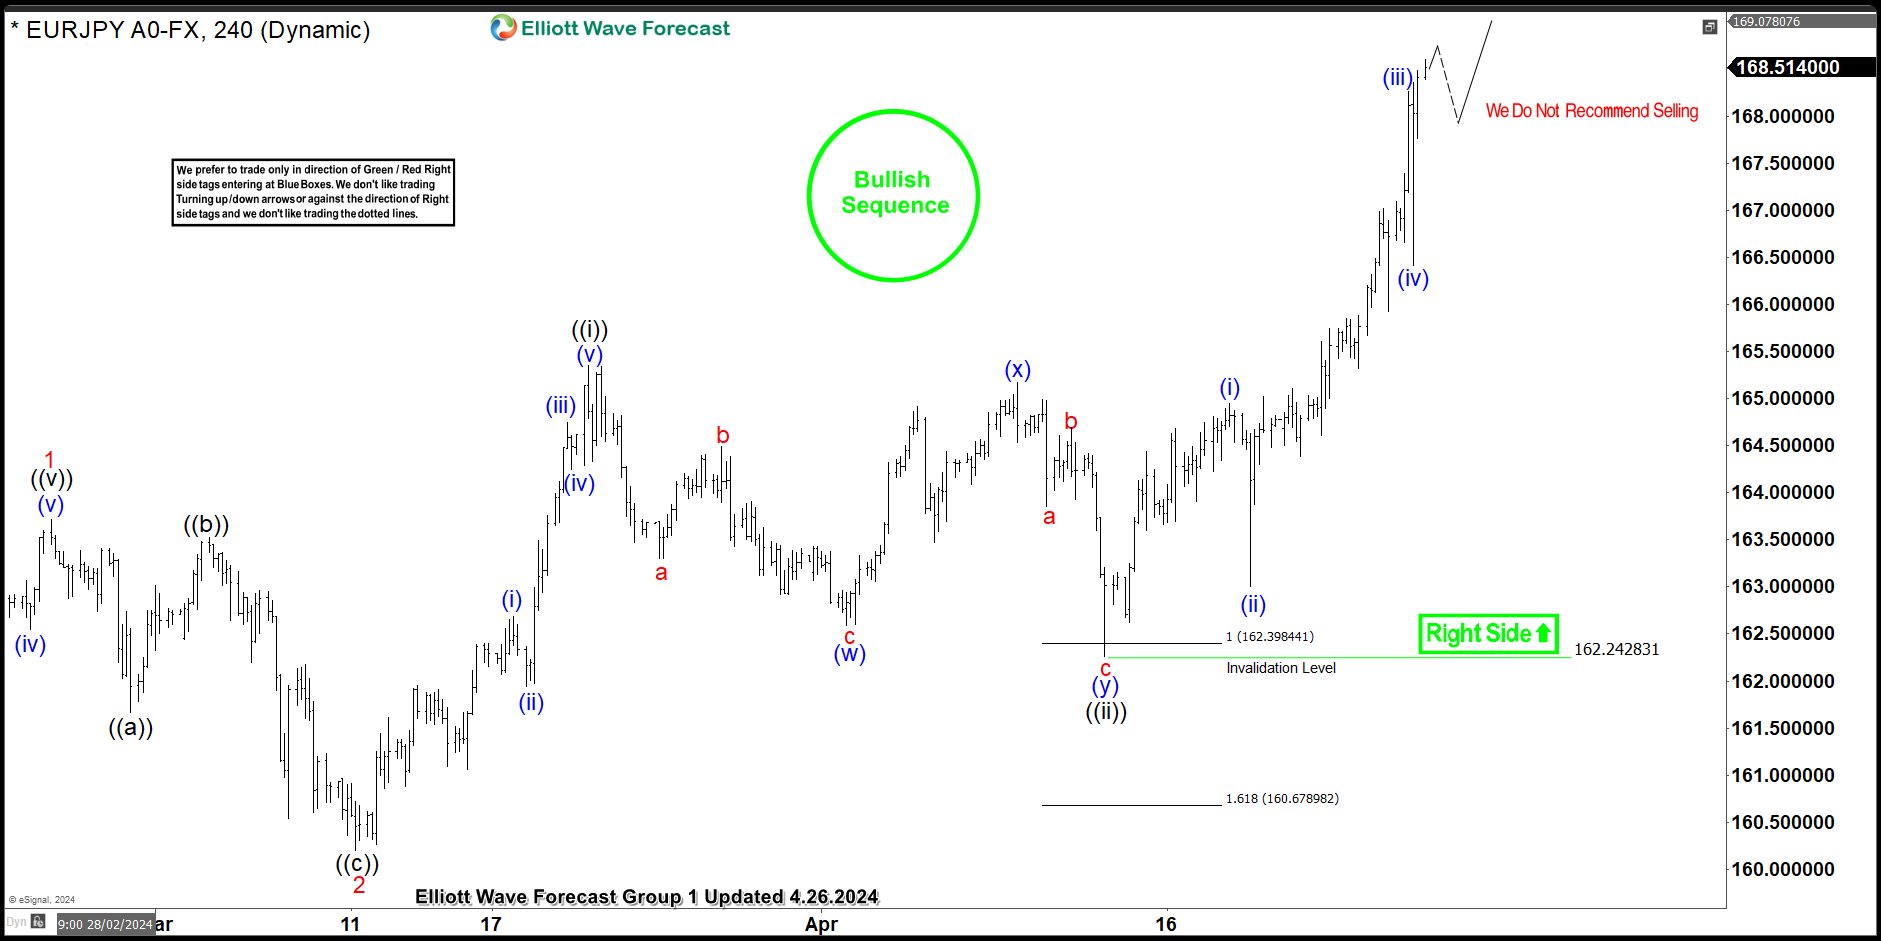
The subsequent H4 chart above, shared with members on 04.25.2024, reveals EURJPY’s advancement from 162.24 with an impulse. Though the H4 wave count has been adjusted to align with current price action, the outcome remains consistent to the upside. Presently, price is in wave (v) of ((iii)) of 3 of (1). With the long-term, medium-term, and short-term bullish sequences remaining intact, there is still considerable upside potential. Moving forward, our strategy remains unchanged. While we disregard selling, we will continue to seek LONG opportunities in pullbacks that conclude within the extreme zone. We will provide daily updates, sharing charts from 1-hour to 1-week with our members on this pair and the 77 other instruments we cover. Additionally, we’ll present trade opportunities in our live trading room. We’re available 24/5 to answer questions from Monday to Friday in our chat rooms.