

Sample Category Title
XAU/USD: Gold Steadies Near $2,400 Barrier
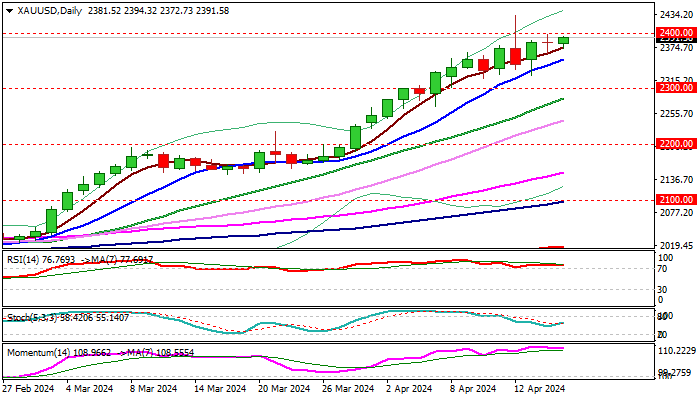
Gold regained traction after a $100 per ounce pullback from new record high last week and pressuring again psychological $2400 barrier.
Overall sentiment remains positive as geopolitical tensions and fears that the conflict in the Middle East can escalate, continue to fuel safe-haven demand and offset pressure on metal’s price from higher dollar.
Recent pullback, despite being sharp, was limited and contained by rising 10DMA (currently at $2351), keeping larger bulls intact.
On the other hand, overbought daily studies and RSI bearish divergence, continue to send warning signals, which should not be completely ignored and keep in play risk of deeper correction.
In such scenario, solid supports at $2300/$2283 (psychological / rising 20DMA) should keep the downside protected and mark a healthy correction before fresh push higher.
Break of the latest record high ($2431) to unmask next strong barrier at $2500.
Res: 2400; 2431; 2453; 2500.
Sup: 2374; 2351; 2320; 2300.
Cable Finds Some Support after UK CPI – Elliott Wave Analysis
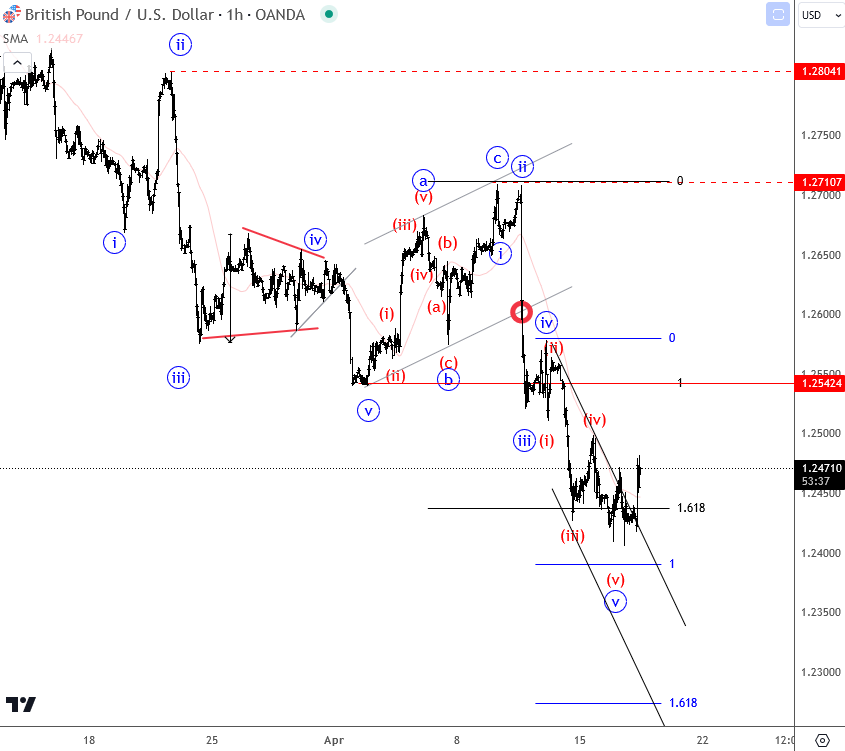
Cable found some footing and appears to be seeking stability after the latest inflation report. The CPI on a y/y basis was reported at 3.2%, a decrease from 3.4%. However, Cable is still ticking slightly upward because the forecast was 3.1%, and this miss has impacted sentiment. From an Elliott wave perspective, we see the price emerging from this hourly downtrend channel, suggesting there could be more gains. But for a confirmed change in trend, you'd want to see an impulsive movement, meaning five waves up from the lows and a push up to 1.2540. If Cable does gain strength, we might even turn bullish here, with potential long opportunities once a bottom is established.
Deeper projection, for further weakness would be near 1.235, then 1.23.
Bitcoin and Ethereum in Eye of Storm?
Market picture
The crypto market avoided sharp moves on Tuesday, showing low volatility over the 24 hours and remaining near $2.3 trillion. The Crypto Fear and Greed Index added 2 points to 67 (greed) by Wednesday.
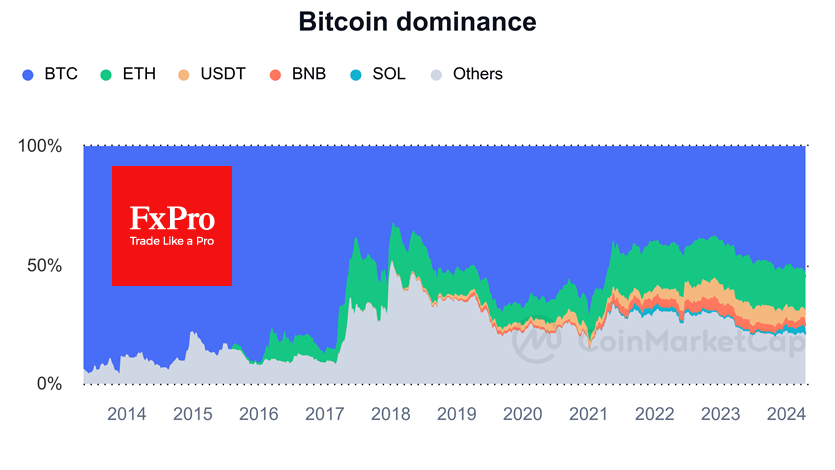
Bitcoin’s share of the entire crypto market capitalisation exceeded 54%, maintaining its upward trend since December 2022. This is the clear impact of the Bitcoin-ETF, but we also note the diminishing enthusiasm for altcoins.
The technical picture for Bitcoin is rather worrying, as we saw no rebound after the price drop on Friday and Saturday. On the contrary, the market seems to be getting used to current prices in anticipation of a halving.
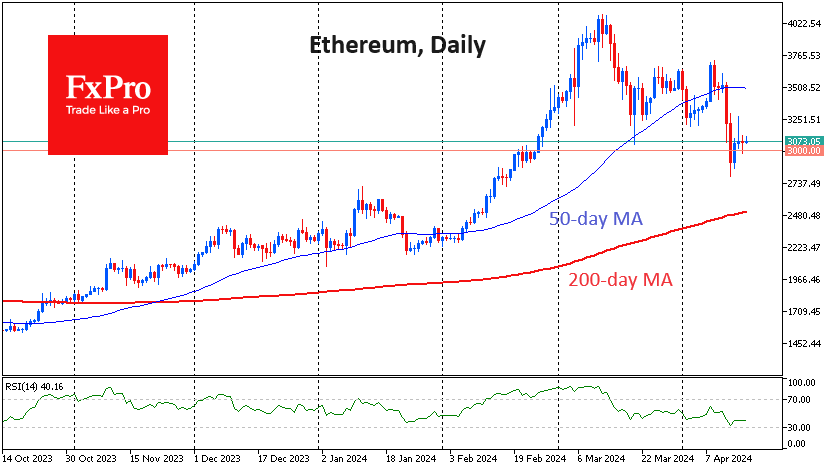
Similarly, Ethereum sold off powerfully at the end of last week from the 50-day MA. Now, the second largest cryptocurrency holds near the psychologically significant $3000 level.
The pattern of cryptocurrency behaviour this week indicates that we are more likely to be in the eye of the storm, i.e. a temporary lull between violent gusts of wind. If this prediction is correct, Bitcoin could fall towards $52-55K, and Ethereum – to $2500.
News background
The crypto market is “halfway to bitcoin euphoria,” according to CryptoQuant. New bitcoin miners, who have held their assets for less than 155 days, hold up to 9% of the circulating BTC volume and continue to build up inventories in anticipation of rising prices. The imbalance between BTC supply and demand will increase over the next six months, potentially driving prices higher.
Hong Kong-listed cryptocurrency ETFs will be “lucky” if they manage to raise $500 million in aggregate, Bloomberg said. The agency called Matrixport’s projected $25bn “insane”.
According to CoinGecko, there are more than 2.52 million crypto assets in existence today, which is 5.7 times the number at the end of 2021. The pace of new coins accelerated in 2024 when 0.54 million tokens have already been created, which means an average of 5,300 pieces launched per day.
Blockchain team The Open Network (TON) has announced the launch of the Memelandia hub for meme coin developers. The project is part of The Open League’s programme, which was created to support new meme coins and raise awareness of them.
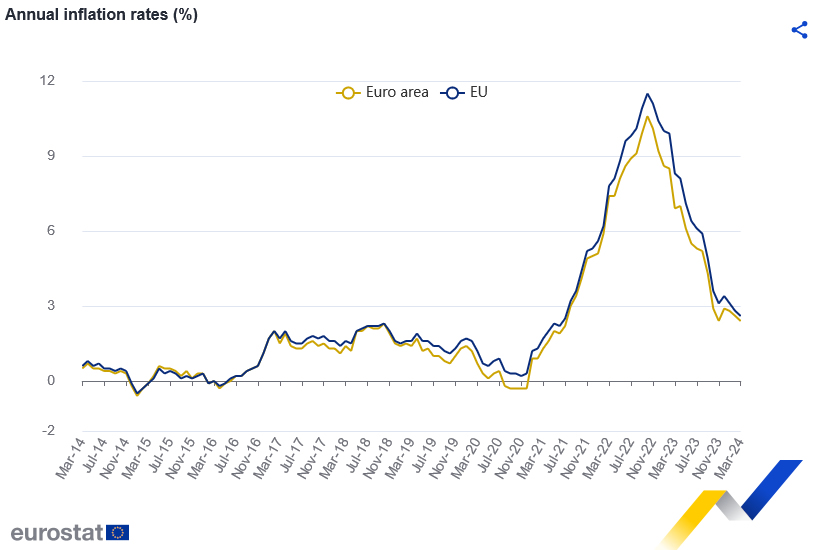
Eurozone CPI finalized at 2.4% yoy, core CPI at 2.9% yoy
Eurozone CPI was finalized at 2.4% yoy in March, down from February's 2.6% yoy. CPI core (energy, food, alcohol & tobacco) was finalized at 2.9% yoy, down from prior month's 3.1% yoy.
The highest contribution to annual Eurozone inflation rate came from services (+1.76 percentage points, pp), followed by food, alcohol & tobacco (+0.53 pp), non-energy industrial goods (+0.30 pp) and energy (-0.16 pp).
EU CPI was finalized at 2.6% yoy, down from prior month's 2.8% yoy. The lowest annual rates were registered in Lithuania (0.4%), Finland (0.6%) and Denmark (0.8%). The highest annual rates were recorded in Romania (6.7%), Croatia (4.9%), Estonia and Austria (both 4.1%). Compared with February, annual inflation fell in thirteen Member States, remained stable in four and rose in ten.
EURJPY Found Buyers After 3 Waves Pull Back
Greetings fellow traders. In this technical article we’re going to take a quick look at the Elliott Wave charts of EURJPY, published in members area of the website. As many of you already know, we’ve been leaning towards long positions in YEN pairs. EURJPY recently pulled back in a 3-wave pattern, with buyers stepping in right at the equal legs zone. Let’s break down our Elliott Wave forecast further in this article.
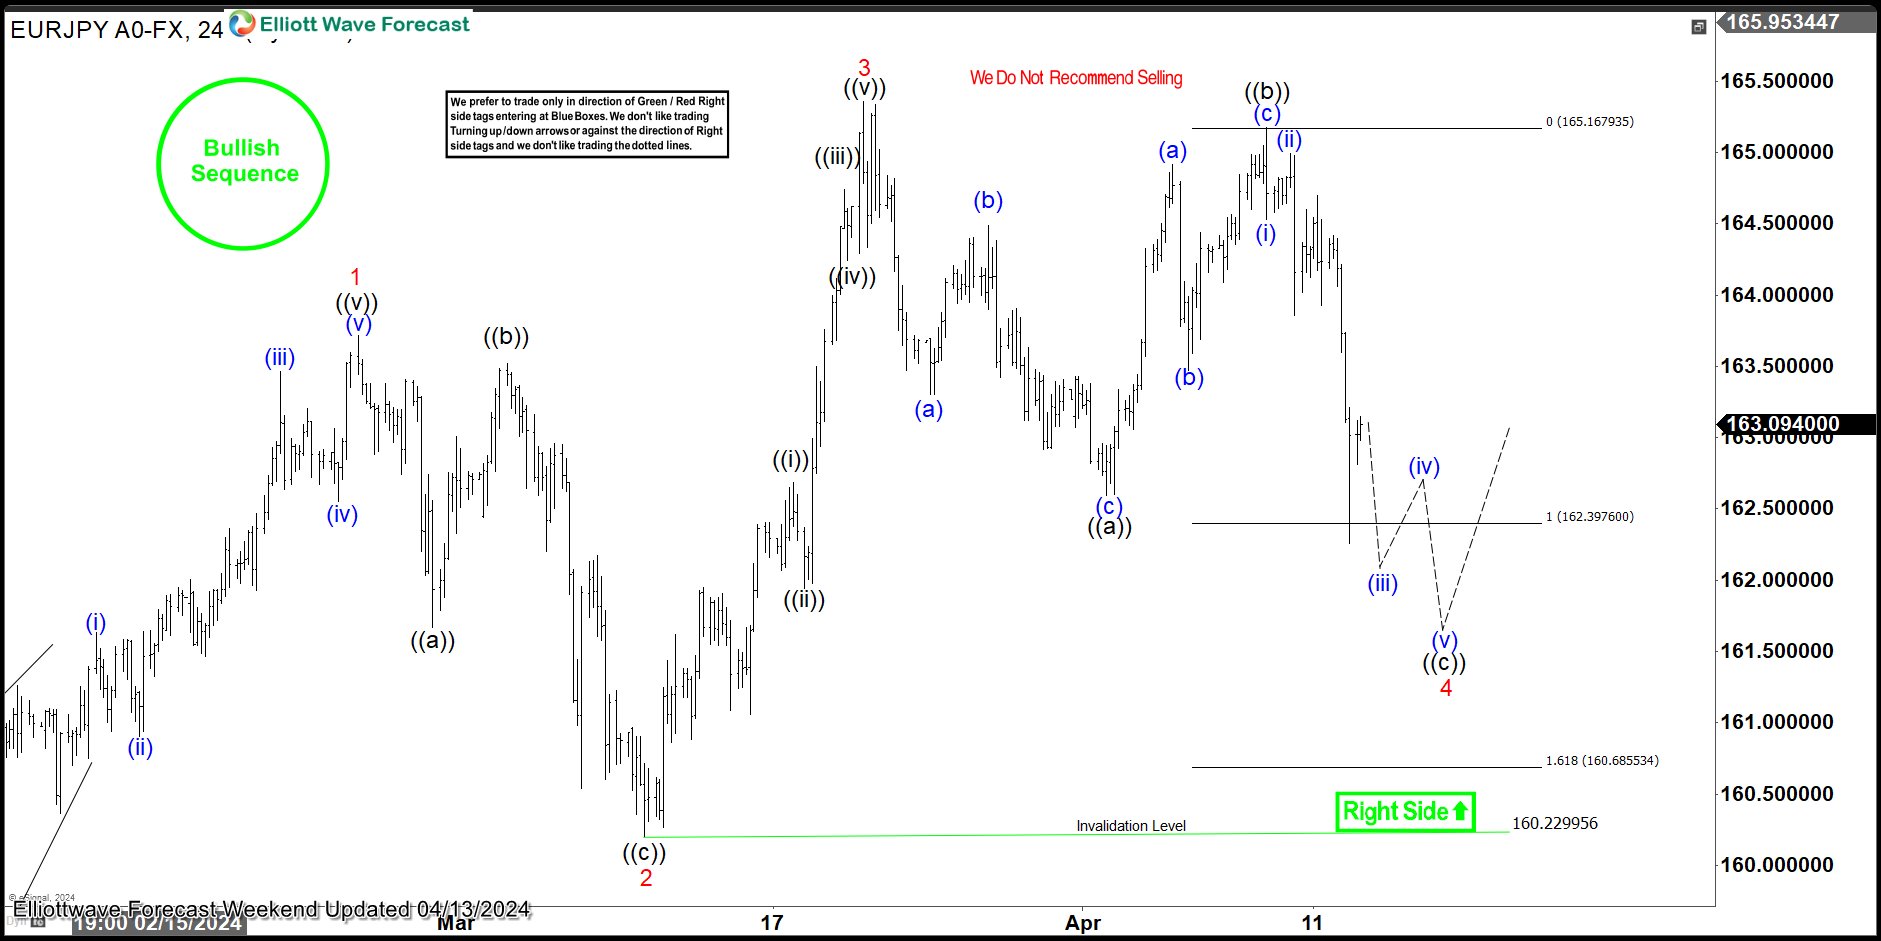
EURJPY H4 Weekend Update 04.13.2024
The current view suggests that the EURJPY pair is undergoing a 4 red pullback, which is correcting the cycle from the 160.229 low. This pullback appears to be forming an Elliott Wave Flat pattern. Notably, the price has already reached the extreme zone within the range of 162.397-160.685. We anticipate potential buyer activity in this area, which could lead to a further rally towards new highs, or at the very least, trigger a three-wave bounce.
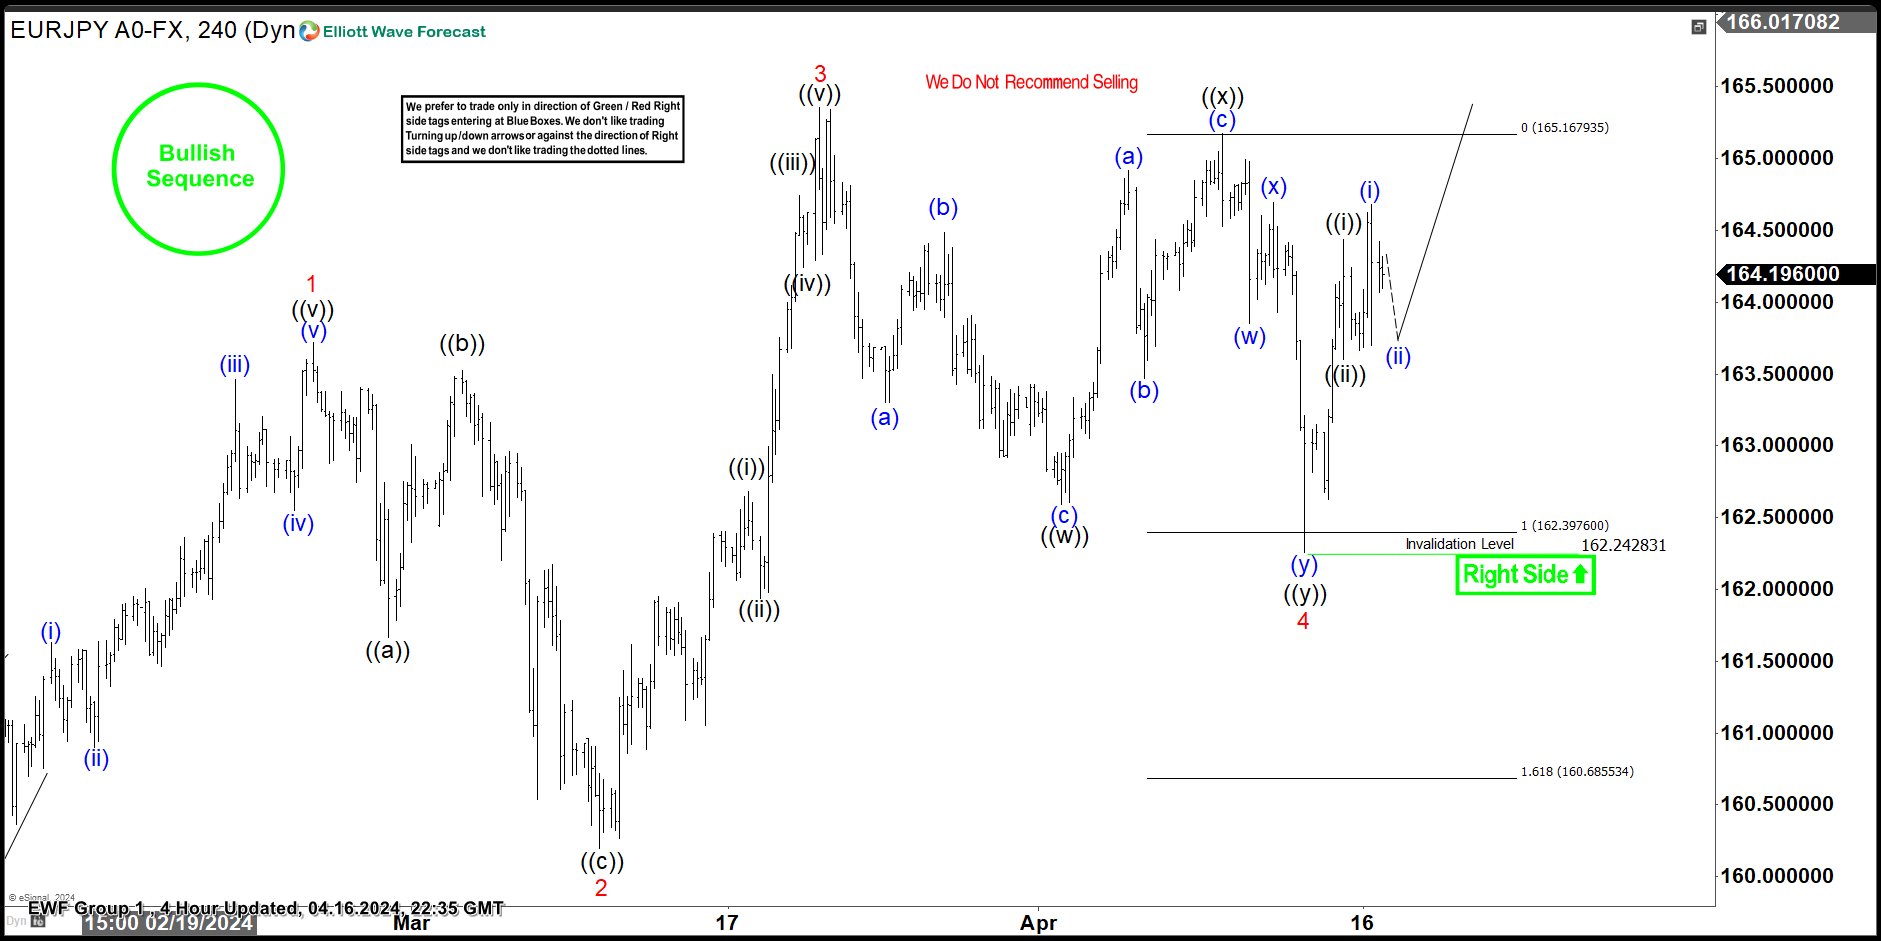
EURJPY H4 Update 04.16.2024
EURJPY has shown a favorable response from the Equal Legs-Buyers zone, as anticipated. We consider the wave 4 red pullback completed at the 162.2428 low. Confirmation of the next leg up will come with a break of the 3 red peak. We advise against selling the pair during any suggested pullback and favor the long side.
USDJPY on the Verge of Hitting 155.00 Milestone
- Overbought signals persist as USDJPY approaches the 155.00 level
- Bullish trend expected to hold strong above 151.00
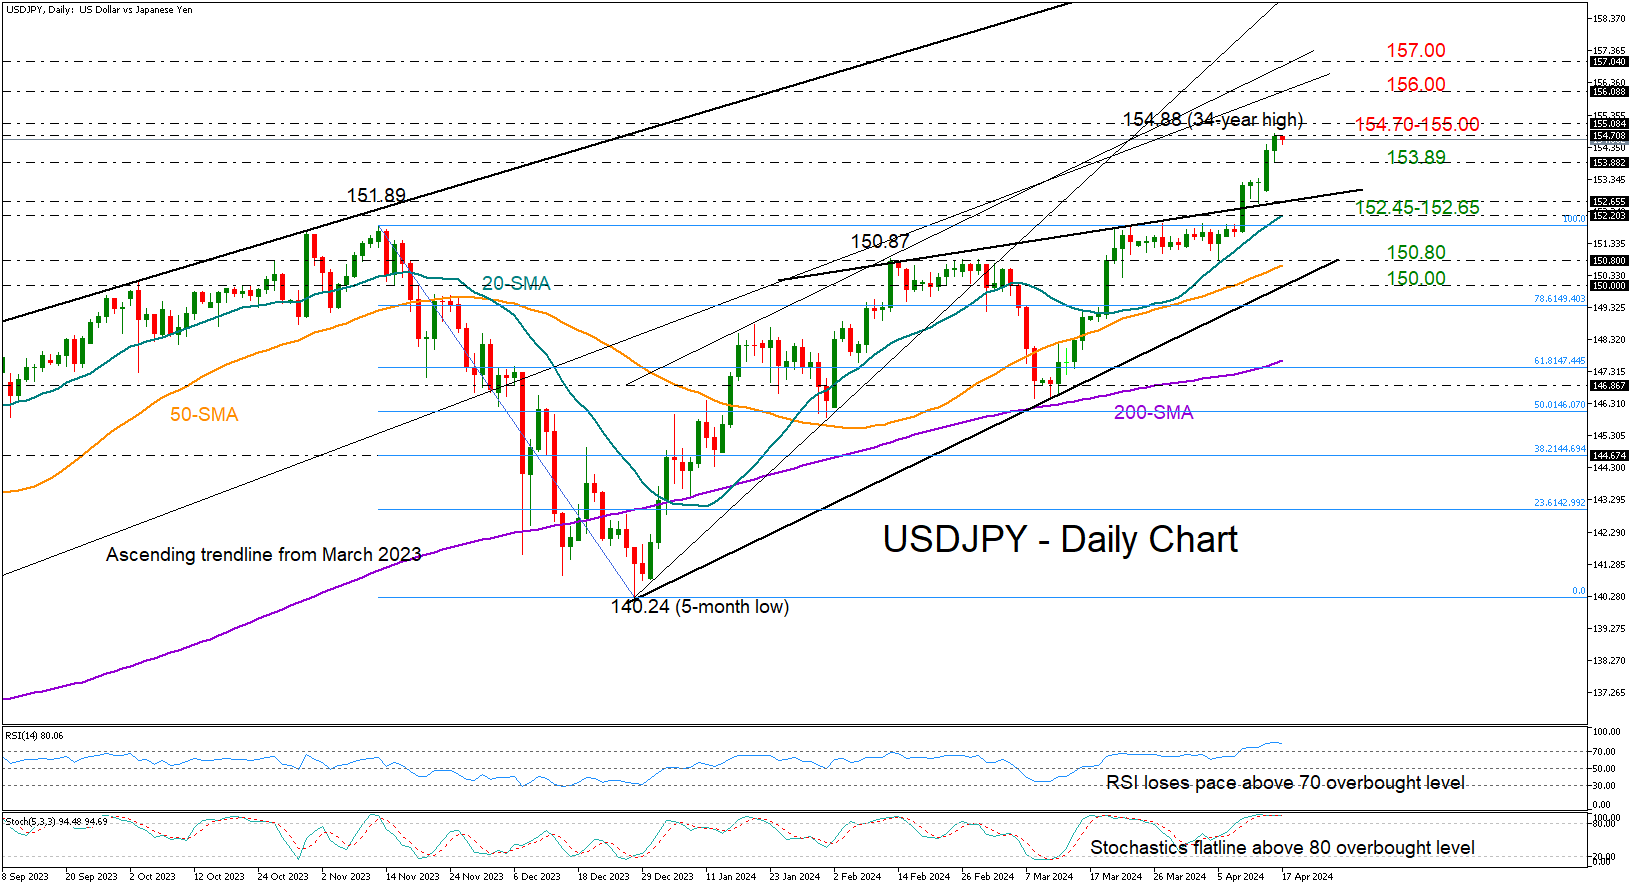
After an explosive bullish session on Monday, USDJPY is now a short distance below the 155.00 psychological level, recording its sixth consecutive week of gains and reaching its highest level since May 1990.
The RSI and the stochastic oscillator are currently losing momentum in the overbought region, flagging a potential slowdown in the market. Due to the substantial price increase in the past week, Japan may consider intervening in the FX market.
However, the daily chart continues to show a strong positive trend, indicating a potential upward continuation.
Beyond the 155.00 number, the pair could experience resistance near the trendline zone of 156.00-157.00, a break of which could cause an acceleration towards the 159.10 territory. The latter overlaps with the 161.8% Fibonacci extension of the November-December downleg.
On the downside, traders might initially pay attention to Tuesday’s low of 153.89. A step below that floor could motivate an extension towards the broken resistance line at 152.65, and the 20-day simple moving average (SMA) at 152.45. Should the sell-off strengthen below 150.80-151.00, the short- and medium-term outlook would shift to neutral, potentially leading to a target around the ascending trendline at 150.00 taken from December’s lows.
Overall, the risk of Japan intervention and the persisting overbought conditions in the market could lead to a loss of impetus for USDJPY in the upcoming sessions. Still, any slowdown would not affect the positive trend in USDJPY unless the bears sink the price below 150.80.
Brent crude prices dip amid concerns over global demand
Brent crude oil prices decreased slightly on Wednesday, falling to 89.50 USD per barrel. The decline is primarily attributed to concerns over global oil demand, particularly given the economic indicators coming out of China, the world's largest energy importer. Although China's GDP grew faster than expected in Q1 2024, other critical economic parameters such as property investment, retail sales, and industrial production remain subdued, dampening overall demand prospects.
According to the American Petroleum Institute (API), US crude oil inventories have risen more than expected, adding to the complexities. While such an increase in inventories typically might bolster oil prices, the prevailing anxiety over global demand continues to exert downward pressure.
Political developments in the Middle East also remain a focal point for the oil markets. A high-level meeting involving Western nations and Israel was postponed to Wednesday, with efforts expected to focus on averting a significant escalation in regional conflicts. Given the region's important global oil supply, such disputes are crucial for the oil sector.
Later today, the US Department of Energy is scheduled to release updated statistics on crude oil and petroleum product inventories for the week, which could influence market volatility.
Technical analysis of Brent
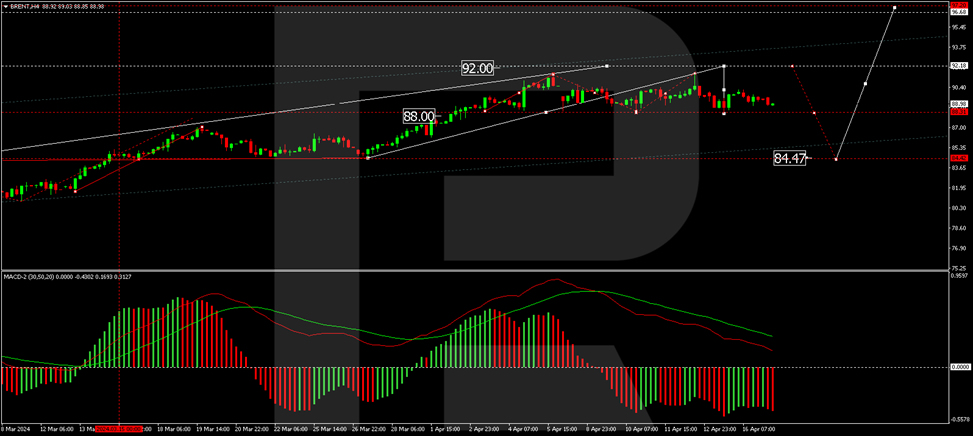
On the H4 chart, Brent crude has formed a consolidation range around the 88.30 USD level, indicating a lack of a clear trend. If there is an upward breakout from this range, a rise to 92.00 USD could be anticipated. This could be followed by a potential correction to 84.50 USD and further growth to 94.00 USD, potentially extending to 97.00 USD. The MACD indicator supports this scenario, with the signal line nearing zero and expected to rebound upwards, suggesting continued growth.
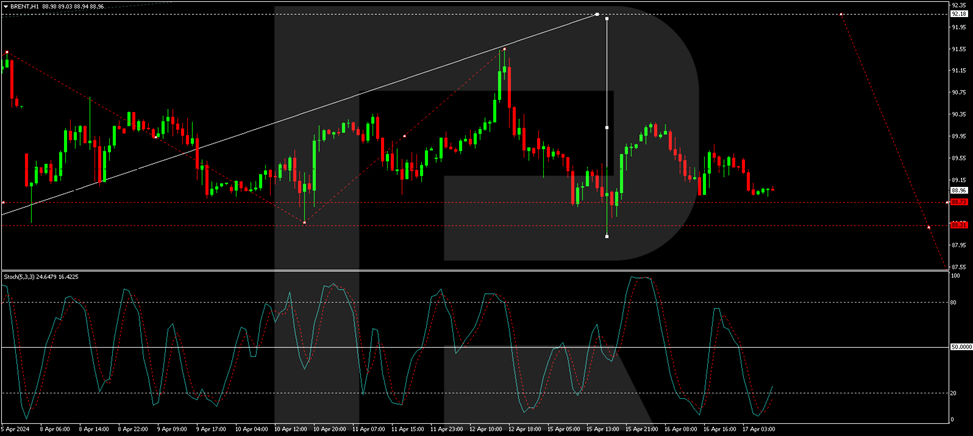
On the H1 chart, a growth impulse to 90.20 USD has been completed, and a corrective movement to 88.80 USD is underway. Once this correction is completed, a new growth wave towards 92.00 USD is anticipated, likely followed by a new corrective phase. The Stochastic oscillator, positioned below 20, prepares for a rebound, supporting the likelihood of further upward movement.
USD/JPY Analysis: Prospect of a Breakout of the Level of 155 Yen per Dollar
The USD/JPY rate has consistently reached new highs since 1990, approaching the psychological level of 155 yen per US dollar. The Japanese currency has already fallen about 9% against the dollar this year.
This is supported by Jerome Powell, who suggested yesterday that US interest rates are likely to remain high for longer. He refused to give any guidance on when interest rates might be cut, greatly dimming investors' hopes for significant easing this year.
Market participants now expect a 40 basis point rate cut in 2024, significantly lower than the 160 basis point easing they were counting on at the start of the year, according to FedWatch.
At the same time, traders are focused on whether Japanese monetary authorities will intervene to support the currency as it deteriorates rapidly. Officials have stepped up warnings of possible intervention, although analysts also say fighting the dollar's strong bullish trend will be difficult and costly. Japanese Finance Minister Shunichi Suzuki said on Tuesday he was closely monitoring the yen's exchange rate against the US dollar today and would take "strengthened response measures if necessary."
“Today, intervention can only help slow or contain the pace of depreciation, but cannot reverse the trend,” Kenneth Broux, head of exchange rate research at Societe Generale, told Reuters. Japan last intervened in the foreign exchange market in 2022, spending an estimated USD 60 billion to defend the yen.
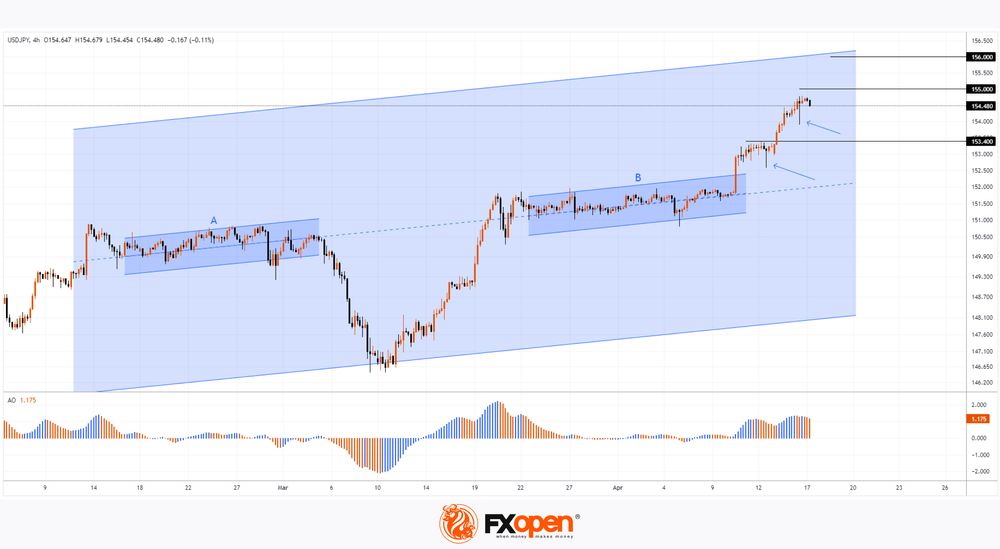
Technical analysis of the USD/JPY chart shows that the market is moving in an uptrend, judging by the fact that the Awesome indicator is above the zero line.
Wherein:
→ long lower shadows on the candles (shown by arrows) indicate the strength of demand;
→ if we take consolidation zones A and B as the basis for constructing the median of the ascending trend channel, and the March minimum as the basis for constructing its lower border, then the target of the unfolding growth may be the level of 156 yen per US dollar, where the upper border of the channel lies;
→ in case of a rollback, the USD/JPY price may be supported by the former resistance at 153.400.
Trade over 50 forex markets 24 hours a day with FXOpen. Take advantage of low commissions, deep liquidity, and spreads from 0.0 pips. Open your FXOpen account now or learn more about trading forex with FXOpen.
This article represents the opinion of the Companies operating under the FXOpen brand only. It is not to be construed as an offer, solicitation, or recommendation with respect to products and services provided by the Companies operating under the FXOpen brand, nor is it to be considered financial advice.
EUR/USD Nosedives While USD/JPY Extend Rally
EUR/USD started another decline and traded below 1.0700. USD/JPY surged and broke the 154.00 resistance zone.
Important Takeaways for EUR/USD and USD/JPY Analysis Today
- The Euro started a fresh decline below the 1.0695 support zone.
- There was a break above a key bearish trend line with resistance at 1.0630 on the hourly chart of EUR/USD at FXOpen.
- USD/JPY climbed higher above the 153.40 and 154.25 levels.
- There is a connecting bullish trend line forming with support at 154.25 on the hourly chart at FXOpen.
EUR/USD Technical Analysis
On the hourly chart of EUR/USD at FXOpen, the pair struggled to clear the 1.0870 resistance zone. The Euro started a fresh decline and traded below the 1.0755 support zone against the US Dollar, as mentioned in the previous analysis.
The pair even declined below 1.0695 and tested the 1.0600 zone. A low was formed near 1.0601 and the pair is now correcting losses. There was a break above a key bearish trend line with resistance at 1.0630.
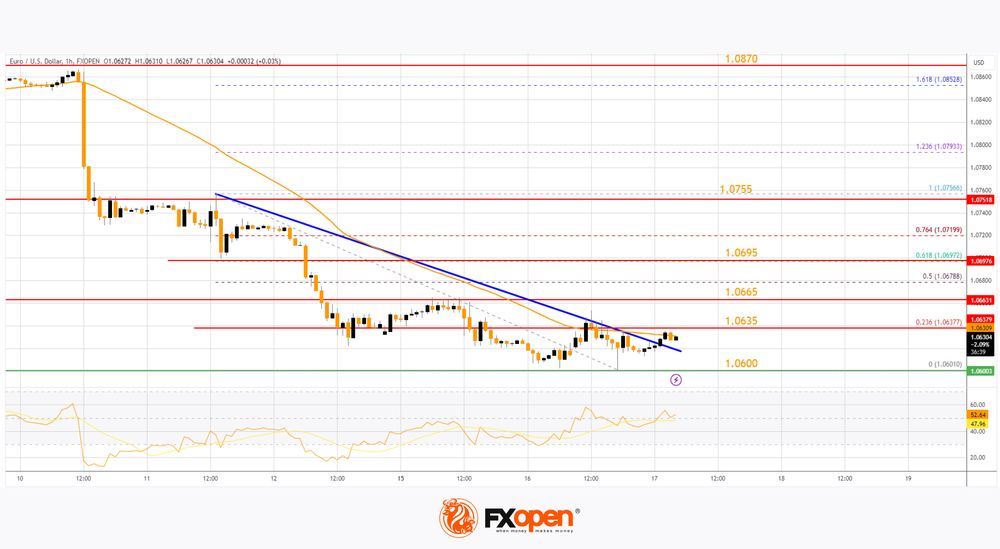
On the upside, the pair is now facing resistance near the 23.6% Fib retracement level of the recent decline from the 1.0755 swing high to the 1.0601 low at 1.0635. The next key resistance is near the 1.0665 level.
The main resistance is 1.0695 or the 61.8% Fib retracement level of the recent decline from the 1.0755 swing high to the 1.0601 low. A clear move above the 1.0695 level could send the pair toward the 1.0755 resistance.
An upside break above 1.0755 could set the pace for another increase. In the stated case, the pair might rise toward 1.0870. If not, the pair might resume its decline. The first major support on the EUR/USD chart is near 1.0600.
The next key support is at 1.0580. If there is a downside break below 1.0580, the pair could drop toward 1.0565. The next support is near 1.0550, below which the pair could start a major decline.
USD/JPY Technical Analysis
On the hourly chart of USD/JPY at FXOpen, the pair started a strong increase from the 152.60 zone. The US Dollar gained bullish momentum above 153.40 against the Japanese Yen.
It even cleared the 50-hour simple moving average and 154.00. The current price action above the 154.00 level is positive. A high is formed at 154.78 and the pair might continue to rise. Immediate resistance on the USD/JPY chartis near 154.80.
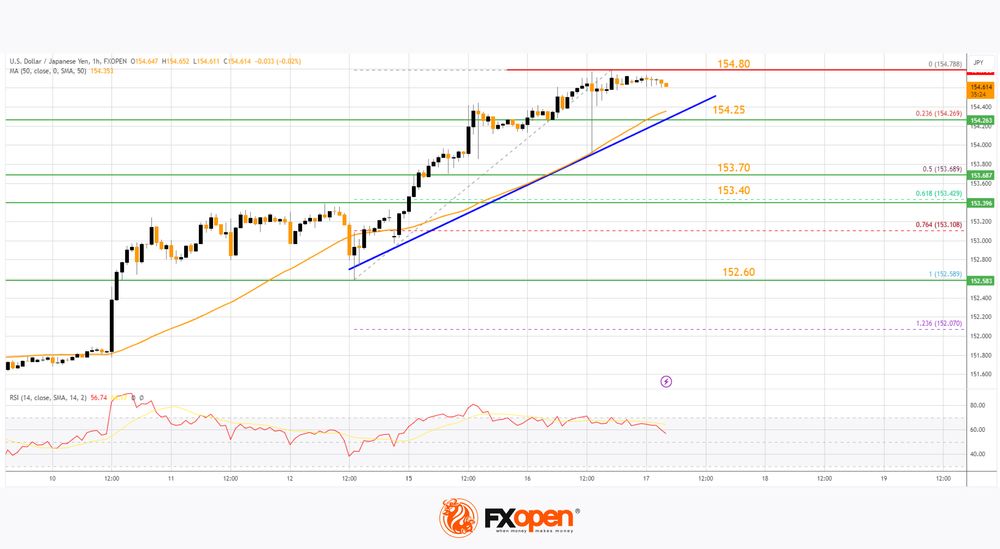
The first major resistance is near 155.00. If there is a close above the 155.00 level and the RSI stays moves 50, the pair could rise toward 155.50. The next major resistance is near 156.20, above which the pair could test 158.00 in the coming days.
On the downside, the first major support is near the 23.6% Fib retracement level of the upward move from the 152.58 swing low to the 154.78 high at 154.25. There is also a connecting bullish trend line forming with support at 154.25.
The next major support is visible near the 50% Fib retracement level of the upward move from the 152.58 swing low to the 154.78 high at 153.70. If there is a close below 153.70, the pair could decline steadily.
In the stated case, the pair might drop toward the 152.60 support zone. The next stop for the bears may perhaps be near the 150.00 region.
Trade over 50 forex markets 24 hours a day with FXOpen. Take advantage of low commissions, deep liquidity, and spreads from 0.0 pips. Open your FXOpen account now or learn more about trading forex with FXOpen.
This article represents the opinion of the Companies operating under the FXOpen brand only. It is not to be construed as an offer, solicitation, or recommendation with respect to products and services provided by the Companies operating under the FXOpen brand, nor is it to be considered financial advice.
NZDUSD Bounces Off 5-Month Low
- NZDUSD posts some gains after negative days
- Immediate resistance at 0.5940
- Stochastics and RSI tick higher
NZDUSD rebounded off the five-month low of 0.5858 after three straight negative days with the technical oscillators confirming that an upside recovery may be on the cards. The RSI is pointing north near the 30 level, while the stochastic posted a bullish crossover within its %K and %D lines.
Immediate resistance is coming from the 0.5940 barrier ahead of the 20-day simple moving average (SMA) at 0.5980. If traders continue to buy the pair, then the 200-day SMA at 0.6050 and the 50-day SMA at 0.6065, which stands near the medium-term downtrend line may halt bullish actions.
Alternatively, a successful decline beneath the five-month low could send the price to the next bottom of 0.5770, registered back on October 26.
To sum up, NZDUSD has been trading within a descending tendency since the end of December and only a jump above the downtrend line may switch the bias to a more neutral one.