Sample Category Title
EUR/USD Starts Recovery, USD/CHF Could Extend Gains
EUR/USD is attempting a recovery wave from the 1.0725 zone. USD/CHF climbed higher above 0.9070 and might extend gains in the near term.
Important Takeaways for EUR/USD and USD/CHF Analysis Today
- The Euro declined toward 1.0725 before it started a recovery wave against the US Dollar.
- There was a break above a key bearish trend line with resistance at 1.0765 on the hourly chart of EUR/USD at FXOpen.
- USD/CHF climbed higher above the 0.9035 and 0.9070 resistance levels.
- There was a break above a major bearish trend line with resistance at 0.9035 on the hourly chart at FXOpen.
EUR/USD Technical Analysis
On the hourly chart of EUR/USD at FXOpen, the pair extended the decline below the 1.0785 support zone. The Euro even declined below 1.0750 before the bulls appeared against the US Dollar, as mentioned in the previous analysis.
The pair traded as low as 1.0724 and recently started a recovery wave. There was a move above the 1.0745 resistance zone. Besides, there was a break above a key bearish trend line with resistance at 1.0765.
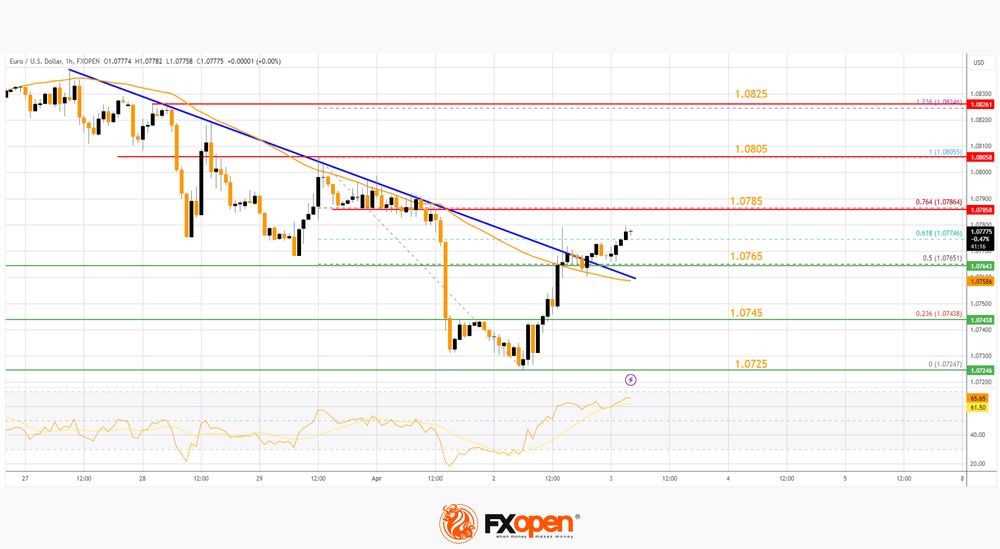
The bulls pushed the pair above the 50-hour simple moving average and the 50% Fib retracement level of the downward move from the 1.0805 swing high to the 1.0724 low.
Immediate resistance on the EUR/USD chart is near the 1.0785 zone. It is close to the 76.4% Fib retracement level of the downward move from the 1.0805 swing high to the 1.0724 low. The first major resistance is near the 1.0805 level.
An upside break above the 1.0805 level might send the pair toward the 1.0825 resistance. The next major resistance is near the 1.0850 level. Any more gains might open the doors for a move toward the 1.0920 level.
Immediate support on the downside sits at 1.0765. The next major support is the 1.0745 zone. A downside break below the 1.0745 support could send the pair toward the 1.0725 level. Any more losses might send the pair to 1.0650.
USD/CHF Technical Analysis
On the hourly chart of USD/CHF at FXOpen, the pair started a decent increase from the 0.9005 support. The US Dollar climbed above the 0.9035 resistance zone against the Swiss Franc.
There was a break above a major bearish trend line with resistance at 0.9035. The bulls were able to pump the pair above the 50-hour simple moving average and 0.9070. Finally, the pair tested the 0.9090 zone.
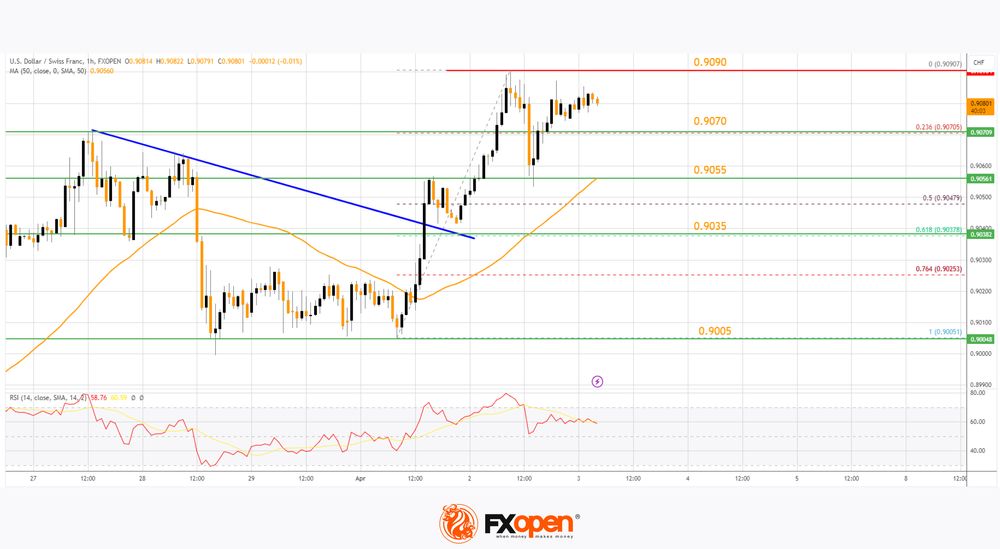
A high was formed near 0.9090 before there was a minor pullback. The pair declined below the 23.6% Fib retracement level of the upward move from the 0.9005 swing low to the 0.9090 high.
On the downside, immediate support on the USD/CHF chart is near the 0.9070 zone. The first major support is near the 50-hour simple moving average at 0.9055. A downside break below 0.9055 might spark bearish moves. The next major support is near the 61.8% Fib retracement level of the upward move from the 0.9005 swing low to the 0.9090 high at 0.9035.
Any more losses may possibly open the doors for a move toward the 0.9005 level in the near term. On the upside, the pair is now facing resistance near 0.9090.
The next major resistance is at 0.9120. The main resistance is now near 0.9140. If there is a clear break above the 0.9140 resistance zone and the RSI climbs above 65, the pair could start another increase. In the stated case, it could test 0.9200.
Trade over 50 forex markets 24 hours a day with FXOpen. Take advantage of low commissions, deep liquidity, and spreads from 0.0 pips. Open your FXOpen account now or learn more about trading forex with FXOpen.
This article represents the opinion of the Companies operating under the FXOpen brand only. It is not to be construed as an offer, solicitation, or recommendation with respect to products and services provided by the Companies operating under the FXOpen brand, nor is it to be considered financial advice.
Gold Price XAU/USD Sets Another All-Time High
The XAU/USD gold chart today indicates that the price of the metal has exceeded USD 2,250 per ounce.
Causes:
→ Geopolitical tensions. Military conflicts in Ukraine and the Middle East do not subside, the threat of terrorist attacks is growing, and new hot spots may appear on the world map.
→ Concerns about a new round of inflation due to rising commodity prices.
In both cases, gold acts as a safe-haven asset.
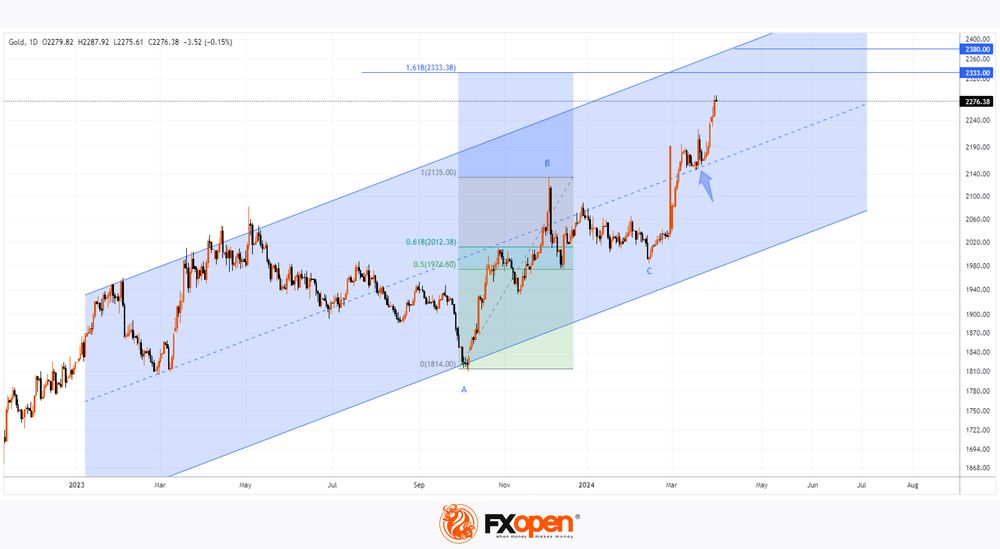
Since the beginning of 2024, the price of XAU/USD has risen by 12%. How much longer can the rally last?
In terms of technical analysis of the gold price, there are two tools to take into account:
→ ascending channel (shown in blue). Today XAU/USD is in its upper half, the price has tested (shown by the arrow) the support of the median line. And from the first days of April it has been demonstrating dynamics that direct it towards the upper border of the channel.
→ Fibonacci proportions. If we take the A→B impulse as 100%, then the decrease in B→C finds support in the zone of levels 0.5-0.618, which confirms the relevance of using proportions. Then the target for impulse price growth from point C may be the level of 1.618.
Thus, these technical analysis tools for the XAU/USD chart indicate that the price of gold may rise to the 2,333-2,380 zone if the current bullish sentiment continues.
Start trading commodity CFDs with tight spreads. Open your trading account now or learn more about trading commodity CFDs with FXOpen.
This article represents the opinion of the Companies operating under the FXOpen brand only. It is not to be construed as an offer, solicitation, or recommendation with respect to products and services provided by the Companies operating under the FXOpen brand, nor is it to be considered financial advice.
XAU/USD: Healthy Correction Likely to Precede Fresh Push Higher
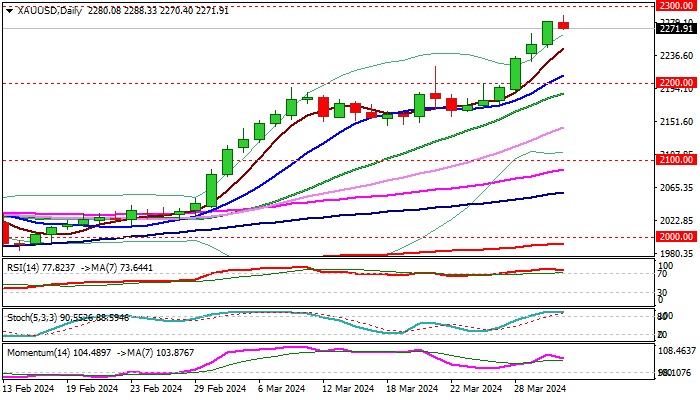
Gold edges lower from new record high ($2288) in early Wednesday, as bulls show signs of fatigue after advancing over 5% in a steep acceleration in past six days.
Although the metal resumed the uptrend in early April, after an impressive 9.3% rally in March, remaining strongly underpinned by growing signals of Fed’s first rate cut in June and geopolitical tensions, corrective action in the near term cannot be ruled out.
Profit taking after latest rally may spark fresh dips, as stretched technical studies on all larger timeframes (day / week / month) have already sent initial warnings that bulls may face increased headwinds on approach to psychological $2300 resistance.
Larger picture remains firmly bullish, adding to scenario of a healthy correction, which will give bulls space to consolidate before broader uptrend resumes.
Initial supports lay at 2222 (former top/daily Tenkan-sen)) and $2211 (rising 10DMA) with extended pullback expected to find firmer ground at $2200/$2180 zone (psychological/20DMA) to keep bulls intact.
Res: 2288; 2300; 2359; 2400.
Sup: 2222; 2211; 2200; 2187.
ECB’s Holzmann: No fundamental objection to rate cut in Jun
In an interview with Reuters, ECB Governing Council member Robert Holzmann said that an interest rate cut in April is "not on my radar". Instead, he highlighted June as a critical time for evaluating the bank's next steps, emphasizing a commitment to data-driven decision-making regarding monetary easing.
"If the data allows it, a decision will be made," he noted. "I don't have an in-principle objection to easing in June, but I'd like to see the data first and I want to stay data-dependent."
An intriguing aspect of Holzmann's perspective is his consideration of Fed's actions in relation to ECB's. He mentioned, "If by June the data supports a strong case for a cut, and we're a week before the Fed makes its decision, then it's quite likely we'll proceed, hoping the Fed follows suit." However, if Fed doesn't come along, "then it may reduce the economic impact of our move."
Notably, Holzmann's remarks signal a significant shift, especially considering his reputation as one of the more conservative voices within ECB, typically resistant to premature discussions of rate reductions. For him, the shift appears to be influenced by an increasingly benign inflation outlook. Also there were signs of economic fragility within Eurozone, which has been hovering on the brink of recession for multiple quarters.
GBPUSD Battles With 200-Day SMA
- GBPUSD drops below uptrend line
- Price remains within sideways channel
- MACD and RSI indicate neutral-to-bearish bias
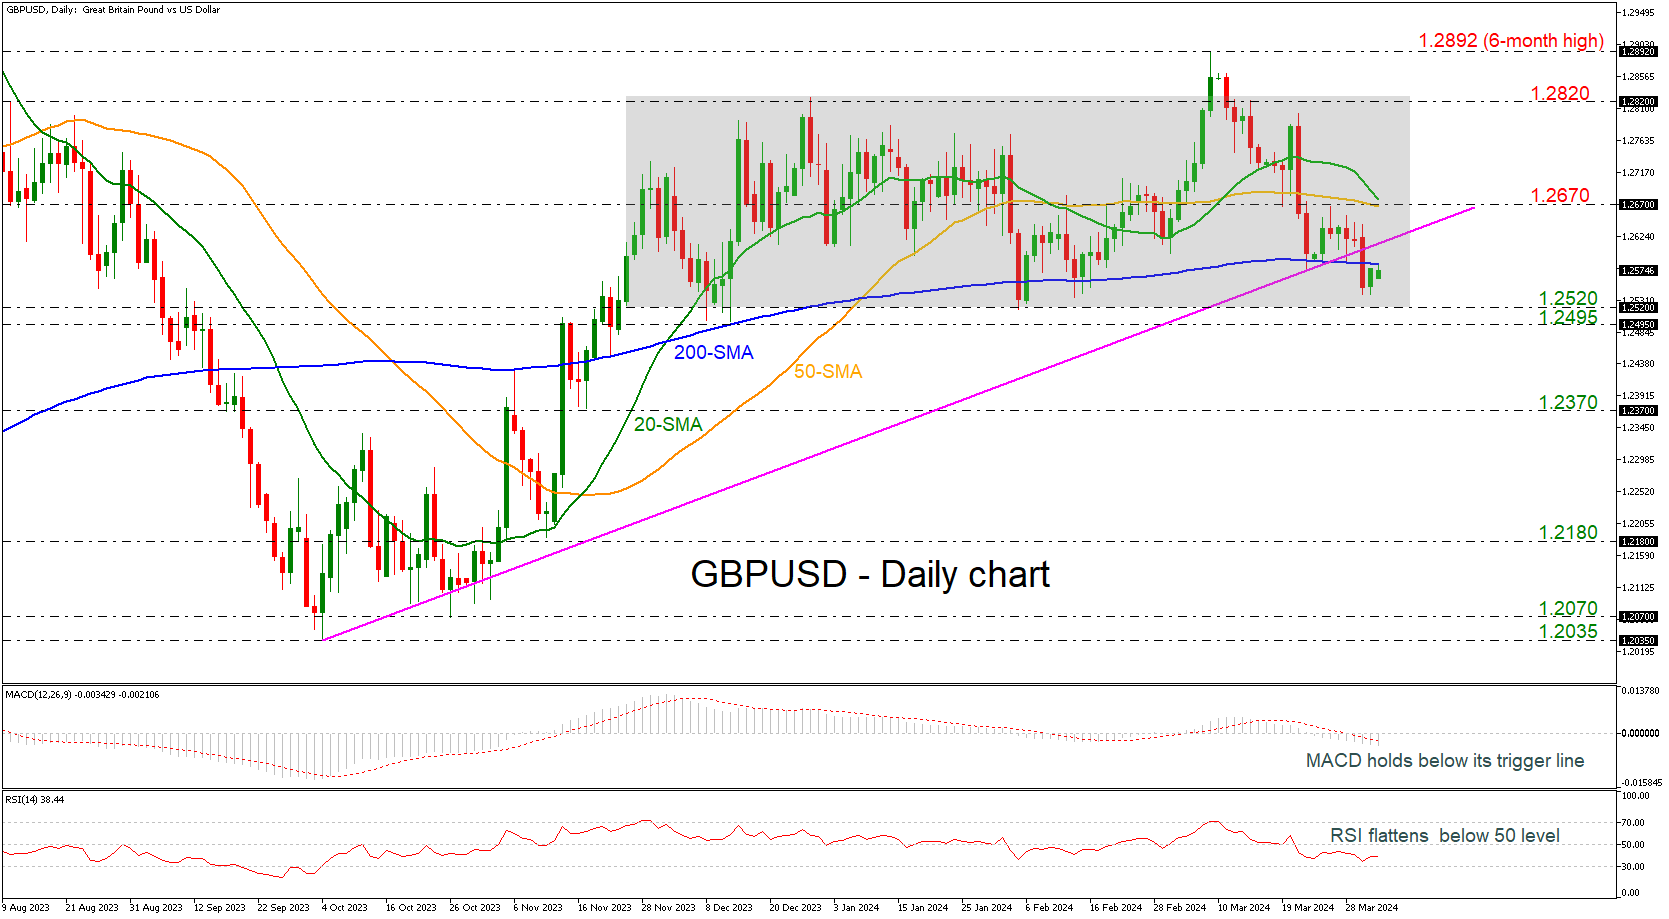
GBPUSD dropped beneath the long-term ascending trend line and the 200-day simple moving average (SMA. Nevertheless, it has not escaped the consolidation area of 1.2520-1.2820, which has confined the price action since November 24. Currently, the pair is trying to recoup some of the previous days’ losses, but the momentum is still weak.
In case of a sell-off beneath the lower boundary of the range and the 1.2495 support line, the market outlook will switch to a more negative one, challenging the 1.2370 barricade.
The technical oscillators are confirming the neutral-to-bearish outlook as the MACD is extending its negative movement beneath its trigger and zero lines, while the RSI is moving horizontally beneath the neutral threshold of 50.
In the positive scenario, a successful jump above the 200-day SMA could open the way for a retest of the mid-level of the channel at 1.2670, which overlaps with the upcoming bearish crossover within the 20- and the 50-day SMAs. Even higher, the upper boundary of the range at 1.2820 may halt upside pressure.
To sum up, GBPUSD lacks a clear direction in the medium-term timeframe and a bearish tendency in the longer timeframe cannot be not excluded.
Stars Aligned for Dollar Yesterday, But Greenback Succumbed
Markets
German Bunds opened softer yesterday in a catch-up move with the US Treasury sell-off on (Easter) Monday. Selling pressure remained until the start of US trading despite lower-than-expected German CPI data and a slight fall in short-term (1-yr) inflation expectations in an ECB Survey. Both cement the case for a (discounted) June ECB rate cut. Sluggish growth and disinflation momentum create a window of opportunity for the ECB, but it risks closing rapidly as we believe that the Fed will err on the side of “higher for longer” at least until after the Summer break while European inflation dynamics (Y/Y) will accelerate again in H2. Therefore we think that EMU money markets are still positioned too aggressively when it comes to making monetary policy even less restrictive after June (leaning to a cumulative 100 bps of rate cuts this year). Rising oil prices initially extended the Bund sell-off with Brent crude rising to $89/b for the first time since end October. Dynamics changed in the run-up to the US opening bell with US equity futures sinking after a significant decline in Tesla sales volumes. A few hours earlier, BYD delivered a similar message. The move pulled European equity benchmarks from small gains to closing losses in the direction of 1%. Key US markets opened with similar losses and hovered around opening levels for much of the remaining session. This bout of risk aversion helped core bonds off intraday lows and outweighed US JOLTS job openings (stable at 8.75mn). Daily changes on the German yield curve (compared with Thursday’s close) yesterday ranged between -1 bp (2-yr) and +12.3 bps (30-yr). US yields fluctuated between -1.6 bps (2-yr) and +4.7 bps (30-yr). Stars aligned for the dollar yesterday (stock & bond sell off; higher oil prices), but the greenback succumbed. The dollar failed to cling to Monday’s post-ISM gains. The trade-weighted dollar (DXY) threw the towel after failing to break 105 resistance (YTD high). EUR/USD set a new short term low at 1.0725, without testing the 1.0695 YTD low.
Asian risk sentiment is negative this morning with similar losses to 1% and slightly more. The Taiwan earthquake had only a minor additional effect. The eco calendar contains EMU CPI numbers (risks for lower outcome) and US ADP employment & services ISM. The latter will be pivotal for trading with US rates and USD still close to resistance levels. Fed Chair Powell speaks on the economic outlook after European close in what’s today’s final potential game changer. Will he stick with the balanced approach after the March policy decision (giving equal weight to a weakening labour market & disinflation) in determining the right timing of making policy less restrictive?
News & Views
Minutes of the March CNB meeting confirmed that price stability in the country had been restored, allowing the central bank to continue reducing rates cautiously. To maintain inflation at the target level, it is necessary to keep policy tight until core inflation is fully under control. A cautious approach allows the CNB to interrupt or halt the policy decline in rates at restrictive levels if necessary. Governor Michl assesses that the neutral policy rate is higher than in the past. Risks remain modestly inflationary, including a slower decline in still elevated inflation expectations. Given a tight labour market, this can translate into stronger wage demands. The recent deeper than expected decline in headline inflation was mainly due to lower food prices. Some members see the continuing rise in services prices as a ground for caution. MPC members are mixed on the CZK-weakening of late. Jan Kubicek indicated that the FX rate is fostering monetary policy easing for the first time since quite some time. Eva Zamrazoliva on the other hand didn’t see current FX level as a significant risk to meeting the inflation target longer term. A majority continues to favour 50 bps rate cut steps due to upside inflation risks. Jan Frait and Tomas Holub dissented (75 bps).
The Chinese Caixin services PMI rose from 52.5 to 52.7 in March. The pace of activity accelerated as new business rose at the quickest pace year to date. Business confidence also improved further, but this wasn’t able to avoid an ongoing contraction employment. Input cost inflation in the sector slowed and this also filtered through into selling prices. The above-50 reading marked the 15th consecutive monthly expansion. Still the level of expansion remains below the longer run average. Combined with a further expansion in the manufacturing sector (51.1), the gain in the services sector also raised the composite index from 52.5 to 52.7.
The ‘Two or Three’ Cut Debate Heats Up
Mood was down in Asia today as the strongest earthquake in 25 years led to halted operations in TSM and United Microelectronics.
Elsewhere, major stock and bond markets in Europe and the US were painted in the red yesterday as well; rising oil and commodity prices fueled inflation expectations while further strength in the US economic data boosted worries that the Federal Reserve (Fed) may not cut the interest rates as much as wished this year. Yesterday’s data showed faster-than-expected recovery in factory orders, though job openings fell more than expected.
The market now prices less than three rate cuts from the Fed this year, below the three rate cuts plotted by the Fed members at last month’s FOMC meeting. And even though Fed’s Mary Daly and Loretta Mester said that three rate cuts look appropriate this year – God knows why – Mester added that ‘it’s a close call’ on whether fewer rate cuts will be needed. She was certainly referring to robust economic data and up-ticking inflation!
The US 2-year yield extended to 4.73% yesterday, the 10-year yield spiked to 4.40%, the S&P 500 tipped a toe below the 5200 level but managed to close above this psychological mark. Nasdaq closed near 1% lower and volatility rose. The US dollar index however retreated despite the positive pressure on yields.
Today, investors have their eyes set on the ISM non-manufacturing index and the latest ADP data. The US economy is expected to have added nearly 150K new private jobs in March. Friday’s jobs data should split hairs between those anticipating three rate cuts and those banking on just two. A strong set of jobs figures – that would add more spice to strong US growth and picking inflation - should further soften the Fed doves’ hand, weigh on equity and bond valuations and keep the US dollar sustained against most majors, starting with the euro.
The EURUSD rebounded before hitting 1.0740 yesterday as the US dollar fell sharply despite supportive economic data. But the data released in Europe confirmed that inflation in Germany cooled for a third straight month and today’s aggregate Eurozone inflation is expected to show further easing. The headline inflation is expected to ease from 2.6% to 2.5% and core inflation from 3.1% to 3%.
Unlike the strong US growth and rising US inflation since the start of the year, the persistent slowdown in European inflation and gloomy Eurozone economies justify a European Central Bank (ECB) rate cut and should continue to weigh on the EURUSD. Across the Channel, Cable saw support near 1.2550 on a broadly softer US dollar, but the data fueled the Bank of England (BoE) rate cut hopes: inflation in British stores dropped to the lowest level in more than two years.
Overall, the US is isolated on an island with a surprisingly strong economic data and rising inflation. But the dollar inflation could easily spill over to the rest of the world if the US dollar gained strength backed by a significant retreat in dovish Fed expectations.
FTSE 100 in a good place to catch up with the rest of Western indices
The FTSE 100 benefited from rising oil & commodity prices and softer sterling to extend gains past the 8000p psychological mark. The FTSE 100 will likely see more tailwinds if oil and commodity prices pick up momentum and the British blue-chip index could be a good hedge against rising inflation worries.
Across the Atlantic, the moodiness in US stocks since the quarter started is mostly due to a retreat in Fed expectations because of strong data, but note that strong economy per se is not a reason to be sad about. This is why the S&P 500 could temper the significant retreat in Fed cut expectations since the start of the year. If the US earnings continue to satisfy, the US stock markets may avoid a significant meltdown.
Oops
Tesla released the first quarter deliveries report yesterday and the numbers were hard to swallow. Analysts were expecting around 6% drop in deliveries last quarter compared to a year earlier, but the deliveries fell 8.5%. Inventories rose and the inventory build-up will be another major headwind to the cashflow. As such, Tesla closed the session almost 5% lower and will hardly reverse losses when the 50% annual sales growth narrative continues to fade away. Tesla’s PE ratio is still around 63 giving it a large room for extending losses.
Elsewhere, Rivian built and sold more EVs than expected but shares plunged more than 5% on overall gloomy outlook for the EV sector.
All Eyes on Euro Area Inflation
In focus today
In the US, March ADP private sector employment and ISM Services are due for release. Yesterday's labour market data supported the notion of labour markets gradually becoming more balanced. Hence, it will be interesting to see if today's data corroborates this view.
In the euro area, today's focus is on euro area inflation for March. We expect inflation to come in at around 2.4% y/y which is slightly below the consensus forecast of 2.5% due to the recent downside surprises in the four biggest economies. Inflation is likely to decline due to falling food inflation and core goods. Service inflation is still sticky which means core inflation will likely tick down only marginally to 3.0% from 3.1% in February. The likely decline in inflation is good news for the ECB but the sticky underlying service inflation and uncertainty regarding high wage growth means we only foresee the first rate cut in June. The euro area unemployment rate for February is also released, which we expect remained stable at 6.4%, highlighting a continued strong labour market.
Economic and market news
What happened overnight
In China, similar to the NBS Services PMI, the Caixin Services PMI edged up to 52.7 in March, propelled by new business increasing at the fastest pace in three months. Coupled with the strong manufacturing PMIs of late, this supports the narrative of the Chinese economy gaining momentum in Q1.
In Taiwan, the island experienced its most powerful earthquake in nearly 25 years, leading to damaged buildings, the suspension of rail traffic, and the necessity to evacuate semiconductor manufacturing plants. Shares of Taiwan Semiconductor Manufacturing Co. were down 1.4% in early trade.
What happened yesterday
In the US, February JOLTS Job Openings came in very close to expectations at 8.76m (cons: 8.75m), while the January print was revised down to 8.75m. Supply of workers ticked higher in February, seeing the ratio of job openings to unemployed job seekers dropping to 1.36 from 1.43. While this is close to the lowest levels seen post-pandemic, it remains above pre-pandemic averages. Other indicators painted a bit of a mixed picture, as involuntary layoffs ticked somewhat higher, though from a low level, while hiring also was slightly higher despite weaker signals from leading surveys such as the NFIB. Bottom line, yesterday's data releases broadly support the narrative of labour markets gradually balancing.
Moreover, Fed's Mester (voting member) was on the wire, stating that she still believes the Fed is on track to cut rates this year but underscored the necessity for more data before confirming such a move is possible. Fed's Daly (voting member) also made public remarks, noting that three rate cuts this year are a "very reasonable" baseline, though nothing is guaranteed.
In the euro area, Banca d'Italia's nowcast model, EuroCOIN, which estimates quarterly growth in the euro area, rose markedly in March, turning positive for the first time since February 2023. This raises questions about the pace of cuts following June.
German HICP inflation declined slightly more than expected in March to 2.32% y/y from 2.74% in February. The decline was driven by lower food, core goods and energy. German core CPI declined to 3.25% in March from 3.37%, while core services inflation rose once again to 3.7%. Hence, service inflation is still sticky in Germany, but this was somewhat expected due to the timing of Easter. The seasonally adjusted series show core inflation at 0.16% m/m s.a. as service inflation was 0.29% m/m s.a.
In commodities, brent crude briefly crossed the USD89/bbl mark as oil supply faced pressure due to Ukrainian attacks on Russian energy facilities, along with escalating tensions in the Middle East, while demand is supported by stronger global growth expectations. Moreover, OPEC+ is scheduled to convene today, though Reuters suggests that any recommendations for oil output policy changes at the meeting are unlikely.
Equities: Global equities were down for the second day in a row as the "overheating" fear took over. With manufacturing outlook improving, oil and commodity prices rising, the higher-for-longer narrative is challenged by a too hot economy that will keep central banks sidelined, and the tight policy will continue. This looks very much like the situation we had in most of Q3 last year. For equities this means energy and materials are the relative winners while long duration growth stocks and small caps are suffering. In US yesterday, Dow -1.0%, S&P 500 -0.7%, Nasdaq -1.0% and Russell 2000 -1.80%. Asian markets are broadly lower this morning and the same goes for European and US futures.
FI: The main event in the European markets today is the release of the European inflation data for February, where we expect to see a decline after a string of national inflation data came in modestly lower than the consensus forecast. The slight decline in the national inflation data including Germany had limited impact on the European yields and rates yesterday, where 10Y German government bond yields ended some 10bp higher relative to the level before Easter. However, much of the impact came from the 10Y Treasury yield that has risen some 15bp relative to level before Easter due to the stronger than expected ISM data released on Monday.
The stronger US data have dampened the rate cut expectations in the US and again the markets are looking towards "higher for longer" regarding monetary policy. Two Fed Officials said yesterday that they still expect three rates cuts in 2024. We have more speeches from Federal Reserve officials today including Fed Chairman Powell as well as the ISM service data ahead of the labour market report on Friday.
FX: Oil prices continue to climb higher and yesterday Brent crude rose to the highest level since October last year, which also contributed to sending NOK FX higher despite the sour risk sentiment. The broadly stronger USD over Easter retreated slightly in yesterday's session, with EUR/USD hovering around 1.0750. Today, focus turns to euro area inflation data with inflation data from Germany out yesterday pointing to a print below the consensus expectation. CHF continues to trade on the backfoot in line with our expectation after the SNB initiated its cutting cycle in March.
GBP/JPY Daily Outlook
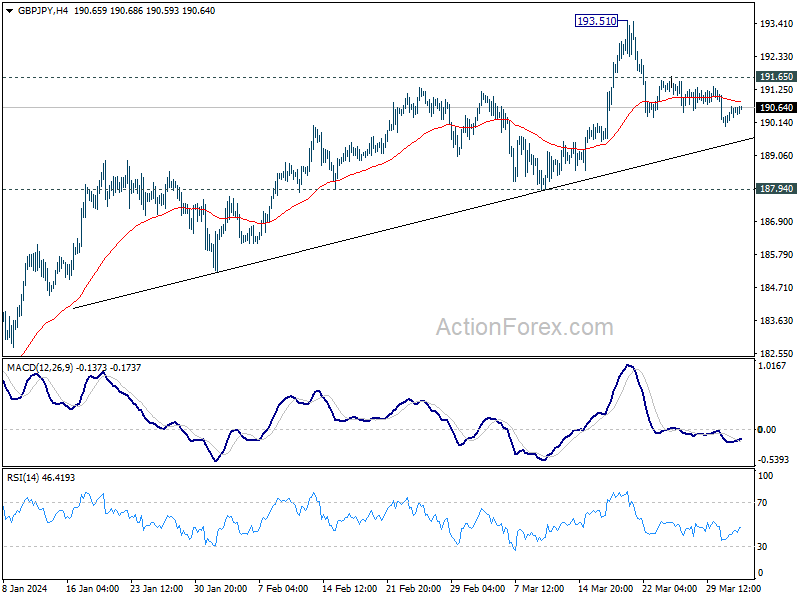
Daily Pivots: (S1) 190.21; (P) 190.46; (R1) 190.88; More.....
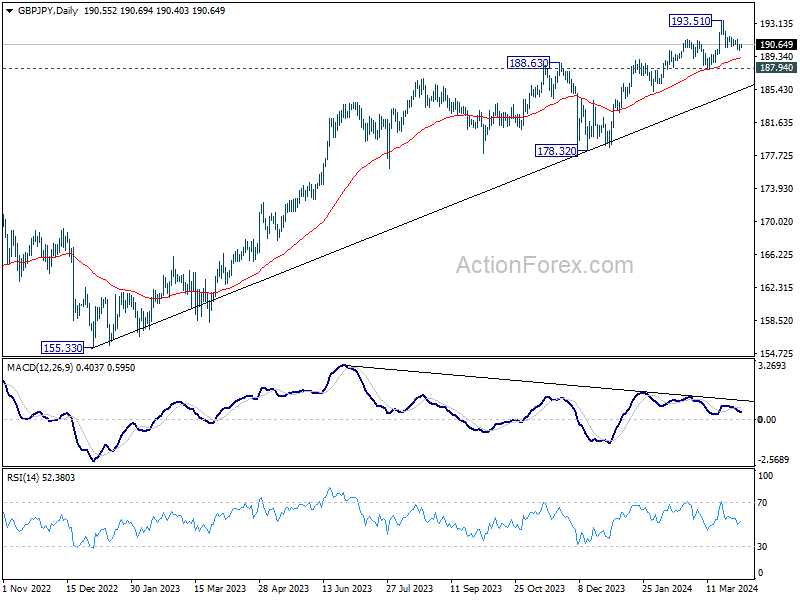
Further decline is expected in GBP/JPY with 191.65 minor resistance holds. Fall from 193.51 would target 187.94 structural support. On the upside, break of 191.65 minor resistance will turn bias back to the upside for retesting 193.51.
In the bigger picture, current rally is part of the up trend from 123.94 (2020 low), and is in progress for long term resistance (2015 high). Break of 187.94 support is needed to be the first sign of medium term topping. Otherwise, outlook will remain bullish in case of retreat.
EUR/JPY Daily Outlook
Daily Pivots: (S1) 162.77; (P) 163.06; (R1) 163.49; More...
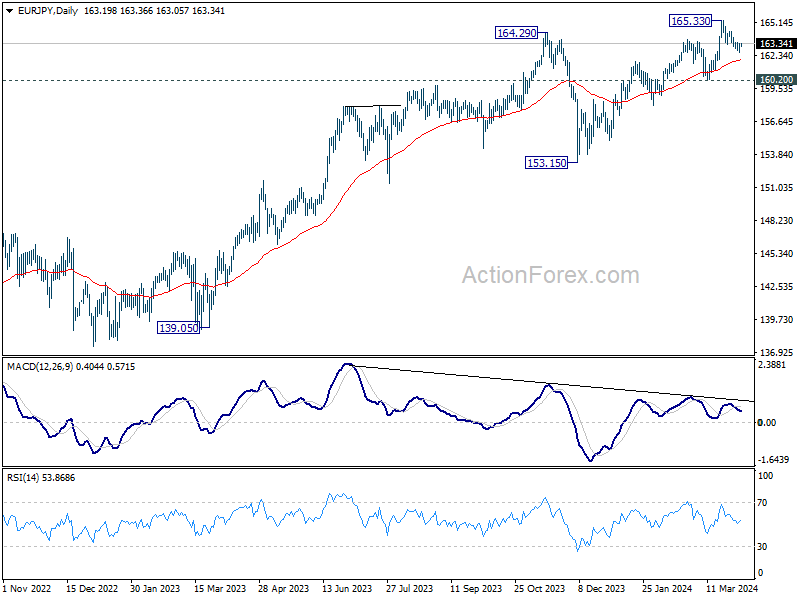
Intraday bias in EUR/JPY is turned neutral gain with current recovery. On the downside, below 162.59 will resume the fall from 165.33 to 160.20 structural support next. On the upside, however, break of 164.40 minor resistance will bring retest of 165.33 instead.
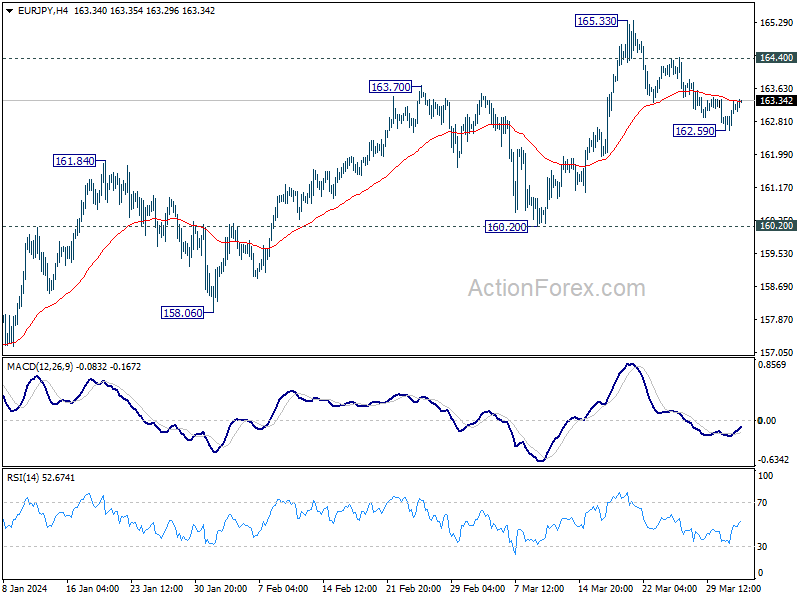
In the bigger picture, current rally is part of the up trend from 114.42 (2020 low), which is still in progress. Next target is 169.96 (2008 high). Break of 160.20 support is needed to be the first sign of medium term topping. Otherwise, outlook will stay bullish in case of retreat.