Sample Category Title
USD/JPY Mid-Day Outlook
Daily Pivots: (S1) 151.41; (P) 151.61; (R1) 151.75; More...
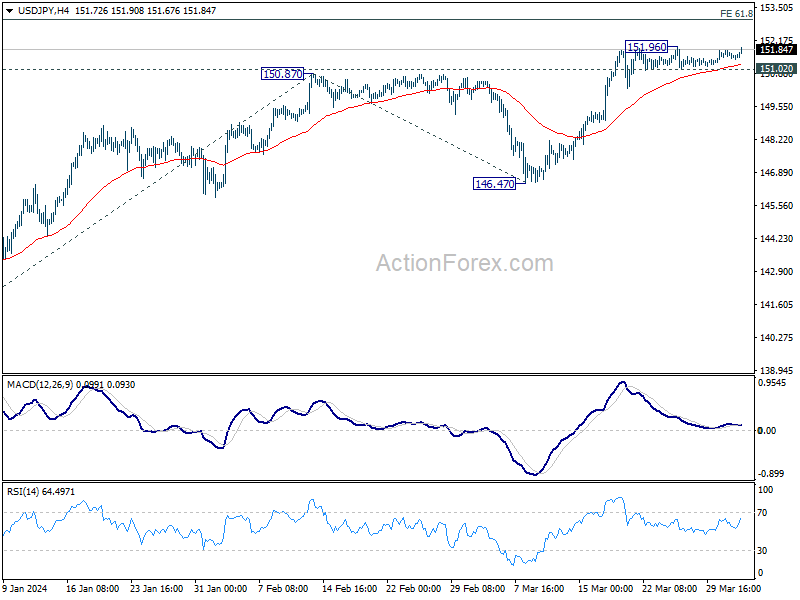
USD/JPY is staying in tight range below 151.96 and intraday bias remains neutral. On the downside, break of 151.02 support should confirm short term topping, and turn bias back to the downside for 55 D EMA (now at 149.43). Nevertheless, sustained break of 151.93 key resistance will confirm long term up trend resumption. Next near term target will be 61.8% projection of 140.25 to 150.87 from 146.47 at 153.03.
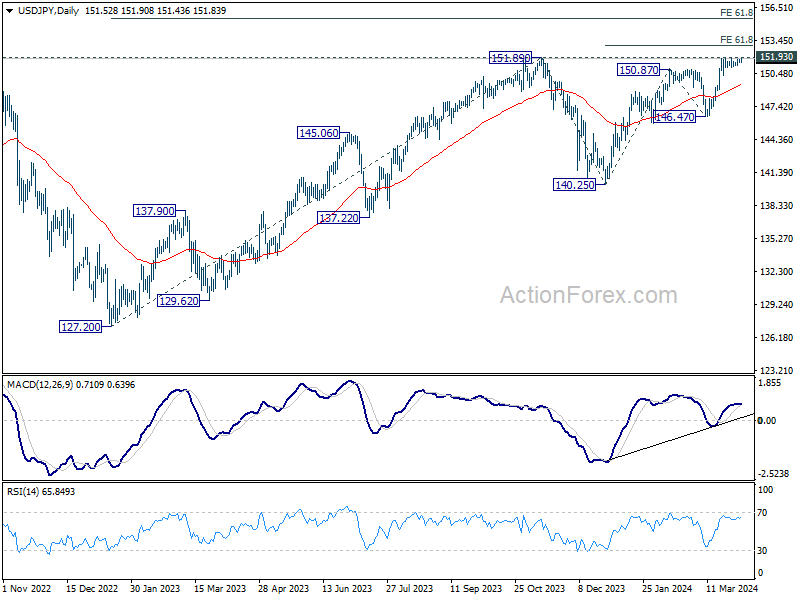
In the bigger picture, correction from 151.87 (2023) high could have completed at 140.25 already. Rise from 127.20 (2023 low), as part of the long term up trend, is probably ready to resume. Decisive break of 151.93 resistance (2022 high) will confirm this bullish case. Next medium term target will be 61.8% projection of 127.20 to 151.89 from 140.25 at 155.20. This will remain the favored case as long as 146.47 support holds, in case of another pullback.
Markets Unmoved by Eurozone CPI and US ADP Reports, Await Further Cues
The forex markets showed rather muted response to the latest batch of economic data released today. Euro has continued its near-term recovery, unaffected by Eurozone's lower than expected CPI flash data coming. This lack of response likely stems from the understanding that a slight miss in CPI figures does not significantly alter ECB plans for a rate cut in June, supported by a growing consensus within the bank. Notably, even the more conservative members of ECB Governing Council have signaled openness to adjusting rates in June, further cementing expectations.
On the other side of the Atlantic, Dollar has also remained stable despite stronger than expected ADP private job data, with marked acceleration in annual wage growth for job-changers. This tepid response suggests that traders are likely waiting for the more comprehensive non-farm payroll report before making any decisive bets. With Fed fund futures currently indicating less a 60% chance of Fed rate cut in June at this point, a strong set of NFP numbers could easily sway the balance.
As the week progresses, Australian Dollar and Dollar are currently the frontrunners, followed by Euro. Meanwhile, Swiss Franc, Sterling, and Yen are lagging behind, with Canadian and New Zealand Dollars occupying the middle ground.
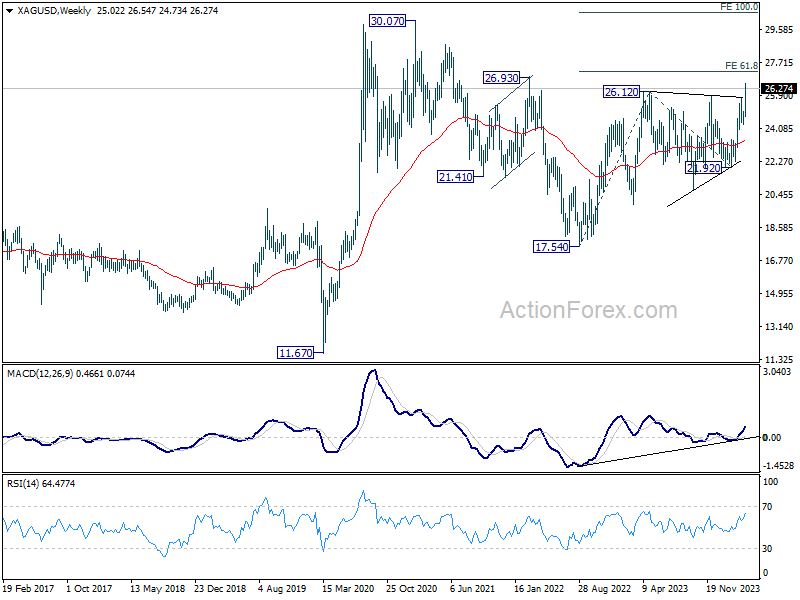
Technically, following Gold's record run, Silver also broke out from the range established since last May. Current up trend from 17.54 is extended to target 61.8% projection of 17.54 to 26.12 from 21.92 at 27.22 first. Sustained break there will pave the way to 100% projection at 30.05 in medium term, which is close to 2021 high.
In Europe, at the time of writing, FTSE is down -0.28%. DAX is up 0.18%. CAC is up 0.15%. UK 10-year yield is down -0.0130 at 4.072. Germany 10-year yield is down -0.006 at 2.397. Earlier in Asia, Nikkei fell -0.97%. Hong Kong HSI fell -1.22%. China Shanghai SSE fell -0.18%. Singapore Strait Times fell -0.77%. Japan 10-year JGB yield rose 0.0143 to 0.767.
US ADP jobs rises 184k, pay growth heating up
US ADP private employment grew 184k in March, above expectation of 150k. By sector, goods-producing jobs increased 42k while service-providing jobs increased 142k. By establishment size, small companies added 16k jobs, medium companies added 93k, large companies added 87k.
For job-stayers, year-over-year pay gains was unchanged at 5.1%. Annual pay growth for job changes accelerated sharply from 7.6% to 10.0%.
Nela Richardson, Chief Economist at ADP, said: "March was surprising not just for the pay gains, but the sectors that recorded them. The three biggest increases for job-changers were in construction, financial services, and manufacturing. Inflation has been cooling, but our data shows pay is heating up in both goods and services."
Eurozone CPI slows to 2.4% in Mar, core down to 2.9%, below expectations
Eurozone headline CPI slowed from 2.6% yoy to 2.4% yoy in March, below expectation of 2.5% yoy. CPI core (ex energy, food, alcohol & tobacco) slowed from 3.1% yoy to 2.9% yoy, below expectation of 3.0% yoy.
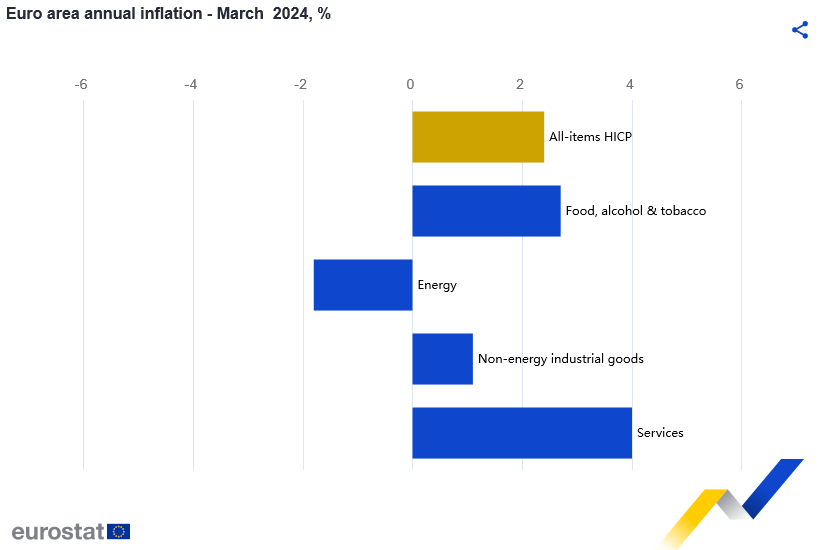
Looking at the main components services is expected to have the highest annual rate in March (4.0%, stable compared with February), followed by food, alcohol & tobacco (2.7%, down from 3.9%), non-energy industrial goods (1.1%, down from 1.6%) and energy (-1.8%, up from -3.7%).
ECB's Holzmann: No fundamental objection to rate cut in Jun
In an interview with Reuters, ECB Governing Council member Robert Holzmann said that an interest rate cut in April is "not on my radar". Instead, he highlighted June as a critical time for evaluating the bank's next steps, emphasizing a commitment to data-driven decision-making regarding monetary easing.
"If the data allows it, a decision will be made," he noted. "I don't have an in-principle objection to easing in June, but I'd like to see the data first and I want to stay data-dependent."
An intriguing aspect of Holzmann's perspective is his consideration of Fed's actions in relation to ECB's. He mentioned, "If by June the data supports a strong case for a cut, and we're a week before the Fed makes its decision, then it's quite likely we'll proceed, hoping the Fed follows suit." However, if Fed doesn't come along, "then it may reduce the economic impact of our move."
Notably, Holzmann's remarks signal a significant shift, especially considering his reputation as one of the more conservative voices within ECB, typically resistant to premature discussions of rate reductions. For him, the shift appears to be influenced by an increasingly benign inflation outlook. Also there were signs of economic fragility within Eurozone, which has been hovering on the brink of recession for multiple quarters.
Japan's PMI services finalized at 54.1, marked increase in cost burdens
Japan's PMI Services was finalized at 54.1 in March, a notable improvement from February's 52.9 and marking the most significant growth for the past seven months. PMI Composite also rose to 51.7 from the previous month's 50.6.
Usamah Bhatti, economist at S&P Global Market Intelligence, noted that near-term outlook for the service sector appears "robust", as outstanding business, a key indicator of future work, continues to rise at "near-record rates". Confidence regarding the 12-month future also remains strong among service providers.
However, the sector is not without its challenges, particularly on the price front. Businesses signaled "another marked increase in cost burdens," underlining ongoing inflationary pressures. These pressures are mirrored in the broader Japanese private sector, where cost inflation has hit a "five-month high".
Bhatti added that inflationary pressures, alongside BoJ's recent shift away from negative interest rates, "will likely remain a downside risk to the Japanese private sector economy in the coming months."
China's Caixin PMI services edges up to 52.7, matches expectations
China's Caixin PMI Services edged up slightly from 52.5 to 52.7 in March, matched expectations. PMI Composite, which tracks both manufacturing and service sectors, also increased from 52.5 to 52.7, indicating the most pronounced expansion of overall business activity since May 2023.
Wang Zhe, Senior Economist at Caixin Insight Group, highlighted the favorable economic performance in the early months of the year and the manufacturing sector's five-month run in expansionary territory. He stated, "This indicates a generally stable and positive economic recovery".
Despite these optimistic signs, the economist pointed out several challenges facing the Chinese economy. Wang Zhe identified persistent downward economic pressures, subdued employment levels, low prices, and insufficient effective demand as critical issues that have yet to be fully addressed.
USD/JPY Mid-Day Outlook
Daily Pivots: (S1) 151.41; (P) 151.61; (R1) 151.75; More...
USD/JPY is staying in tight range below 151.96 and intraday bias remains neutral. On the downside, break of 151.02 support should confirm short term topping, and turn bias back to the downside for 55 D EMA (now at 149.43). Nevertheless, sustained break of 151.93 key resistance will confirm long term up trend resumption. Next near term target will be 61.8% projection of 140.25 to 150.87 from 146.47 at 153.03.
In the bigger picture, correction from 151.87 (2023) high could have completed at 140.25 already. Rise from 127.20 (2023 low), as part of the long term up trend, is probably ready to resume. Decisive break of 151.93 resistance (2022 high) will confirm this bullish case. Next medium term target will be 61.8% projection of 127.20 to 151.89 from 140.25 at 155.20. This will remain the favored case as long as 146.47 support holds, in case of another pullback.
Economic Indicators Update
| GMT | Ccy | Events | Actual | Forecast | Previous | Revised |
|---|---|---|---|---|---|---|
| 00:30 | JPY | Services PMI Mar F | 54.1 | 54.9 | 54.9 | |
| 01:45 | CNY | Caixin Services PMI Mar | 52.7 | 52.7 | 52.5 | |
| 08:00 | EUR | Italy Unemployment Feb | 7.50% | 7.20% | 7.20% | 7.30% |
| 09:00 | EUR | Eurozone CPI Y/Y Mar P | 2.40% | 2.50% | 2.60% | |
| 09:00 | EUR | Eurozone CPI Core Y/Y Mar P | 2.90% | 3.00% | 3.10% | |
| 09:00 | EUR | Eurozone Unemployment Rate Feb | 6.50% | 6.40% | 6.40% | 6.50% |
| 12:15 | USD | ADP Employment Change Mar | 184K | 150K | 140K | 155K |
| 13:45 | USD | Services PMI Mar F | 51.7 | 51.7 | ||
| 14:00 | USD | ISM Services PMI Mar | 52.8 | 52.6 | ||
| 14:30 | USD | Crude Oil Inventories | -0.3M | 3.2M |
US ADP jobs rises 184k, pay growth heating up
US ADP private employment grew 184k in March, above expectation of 150k. By sector, goods-producing jobs increased 42k while service-providing jobs increased 142k. By establishment size, small companies added 16k jobs, medium companies added 93k, large companies added 87k.
For job-stayers, year-over-year pay gains was unchanged at 5.1%. Annual pay growth for job changes accelerated sharply from 7.6% to 10.0%.
Nela Richardson, Chief Economist at ADP, said: "March was surprising not just for the pay gains, but the sectors that recorded them. The three biggest increases for job-changers were in construction, financial services, and manufacturing. Inflation has been cooling, but our data shows pay is heating up in both goods and services."
EUR/USD Drifting as Eurozone Inflation Drops
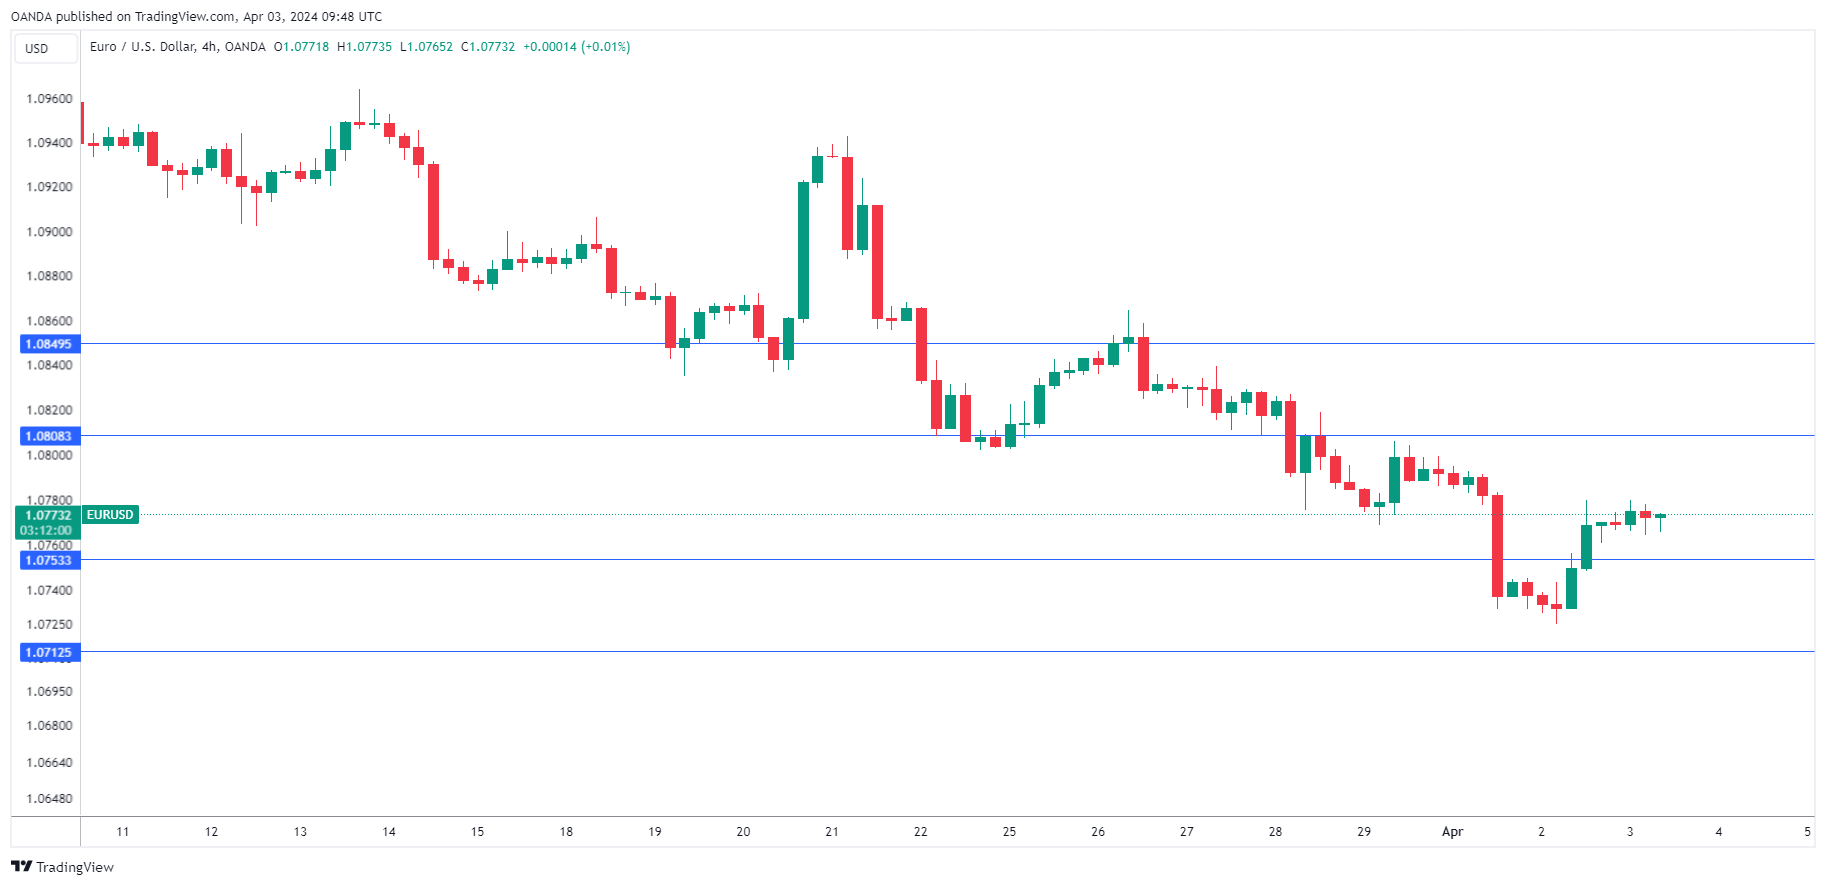
The euro is showing little movement on Wednesday. In the European session, EUR/USD is trading at 1.0777, up 0.05%.
Eurozone inflation ticks lower
Inflation in the eurozone continues to decline. March CPI eased to 2.4% y/y, down from 2.6% in February and below of the market estimate of 2.6%. This matched November’s 28-month low and was driven by the continued slowdown in food inflation. Monthly, CPI rose to 0.8%, up from 0.6% but below the forecast of 0.9%.
Core CPI also declined, with a reading of 2.9% y/y. This was below the February gain of 3.1% and just shy of the market estimate of 3.0%. Core CPI, which is considered more significant than the headline release, has declined for an eighth straight month and dropped to its lowest level since February 2022. Germany’s inflation report, which was released yesterday, also indicated that inflation dropped in March, with headline CPI easing to 2.2% and core CPI to 3.3%.
The drop in inflation is encouraging news for the ECB, which meets next week. The central bank must balance weak economic activity, which would support another pause, against falling inflation, which would support calls to lower rates.
The ECB is likely to maintain rates next week but there is a strong probability that it will press the rate-cut trigger at the June meeting. The ECB may want to prepare the markets for a shift in monetary policy and we could see some dovish signals at next week’s meeting, which might weigh on the euro.
In the US, today’s ADP employment report kicks off a host of employment releases, highlighted by nonfarm payrolls on Friday. The ADP report isn’t considered a reliable precursor to NFP, but investors are interested in any labour reports they can analyse ahead of the NFP release. ADP came in at 140,000 in February and is expected to rise slightly to 148,000 in March.
EUR/USD Technical
- EUR/USD is putting pressure on support at 1.0753. Below, there is support at 1.0712
- 1.0808 and 1.0849 are the next resistance lines
Silver Exits Long-Term Range
- Silver’s future prospects turn brighter after reaching a two-year peak
- A retreat fueled by profit-taking is a risk in the short term
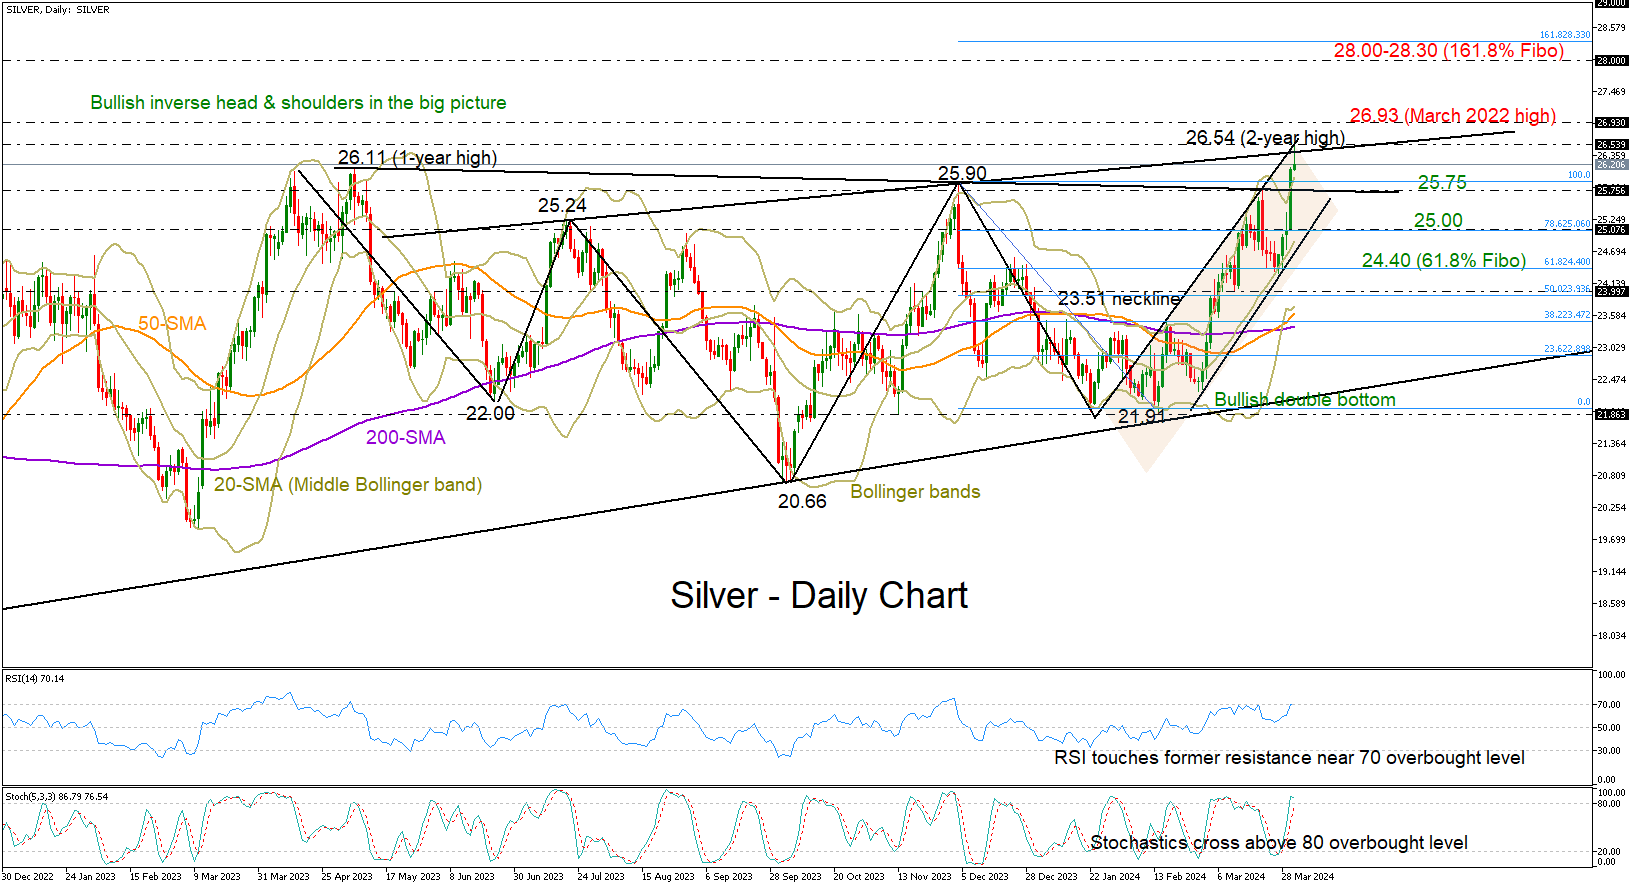
Silver advanced to a two-year high of 26.54 on Wednesday, finally breaking the wide consolidation phase that started in May 2023.
The spotlight is currently on the 2022 high of 26.93, however, Tuesday’s close above the upper Bollinger band implies a lack of strong bullish momentum. The RSI and the stochastic oscillator are also signaling a pause or a potential downside correction, as the indicators have entered their overbought areas.
On a positive note, the market appears to have finished forming an inverse head and shoulders pattern in the overall view, which is more apparent when looking at the weekly chart. Hence, there is a possibility of a bullish trend continuation, although a pullback in the upcoming sessions cannot be ruled out. Moreover, the ascent has reached the resistance trendline of a short-term bullish channel, increasing the odds of a bearish rotation.
Another significant rally to 28.00-28.30 could occur if the price easily runs through the 26.90 area. Even higher, the uptrend could stall somewhere between the 29.00 psychological mark and the 29.15 constraining zone taken from March 2013.
Should selling pressures resurface instead, the metal could seek support around the broken resistance line at 25.75. If there is another negative move there, the price could hit the channel’s bottom seen around 25.00, a break of which could motivate more downside towards the 24.40 base.
In brief, although the current bullish trend in silver may have limited potential for short-term improvement, long-term signals remain positive for a continuation higher.
Start of Correction, Or Support Already in Play?
Market picture
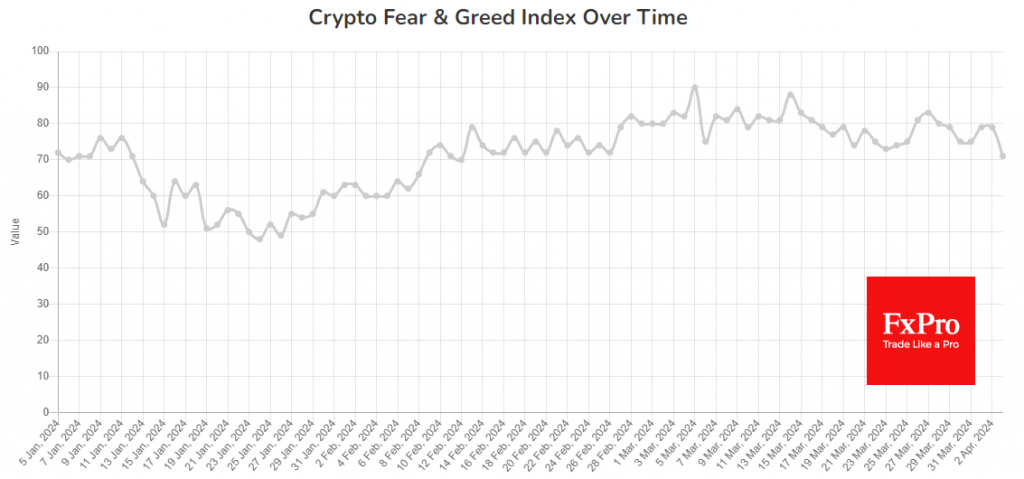
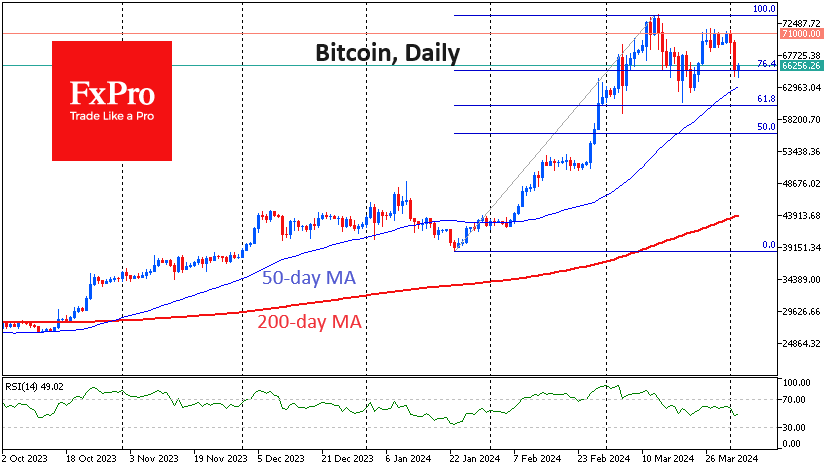
Crypto market capitalisation is down 1% in 24 hours but has seen a cautious rise from a low of $2.43 trillion to $2.51 trillion since the start of the day on Wednesday. The Cryptocurrency Fear and Greed Index has rolled back to 71 (“Greed”) after over a month of “Extreme Greed”. Technically, this sink looks like an invitation for a deeper dive.
Cryptocurrencies have sold off along with other risk assets. US Treasury yields have risen to their highest levels in months. Markets are scaling back expectations for Fed easing this year after strong economic data. However, a key confirmation or denial is yet to come in the form of Friday’s jobs report.
Bitcoin fell below $65K on Tuesday night and Wednesday morning, where buyers supported it. There’s a combination of the psychologically important round level for retail traders and the 76.4% retracement of the rise from the January lows. This support has not yet translated into a strong rebound, with the price hovering around $66.3K as active trading begins in Europe. Should the sell-off deepen, our focus will be on the ability to hold above $63K.
News background
According to Coinglass, liquidation in the futures market reached $456 million in the last 24 hours (the highest over the last 14 days). The bulk of this – $355 million – came from longs.
The speed of the decline was driven by large liquidations on exchanges such as Binance with many retail traders, causing the funding percentage of open-ended futures to fall from 77% to a low, according to QCP Asia.
According to The Block, bitcoin miners generated a record $2 billion in revenue in March, an all-time high. The volume of commissions in the revenue was $85.81 million. Galaxy Digital estimates that around 15-20% of the total computing power of the Bitcoin network will be unprofitable after being cut in half.
The Wall Street Journal described the Tether stablecoin as an “indispensable” tool for circumventing sanctions. According to the publication, the US Treasury Department is pushing Congress to pass legislation that would allow US regulators to monitor and block transactions involving dollar-linked cryptocurrencies.
USD/JPY Analysis: Calm Before the Storm?
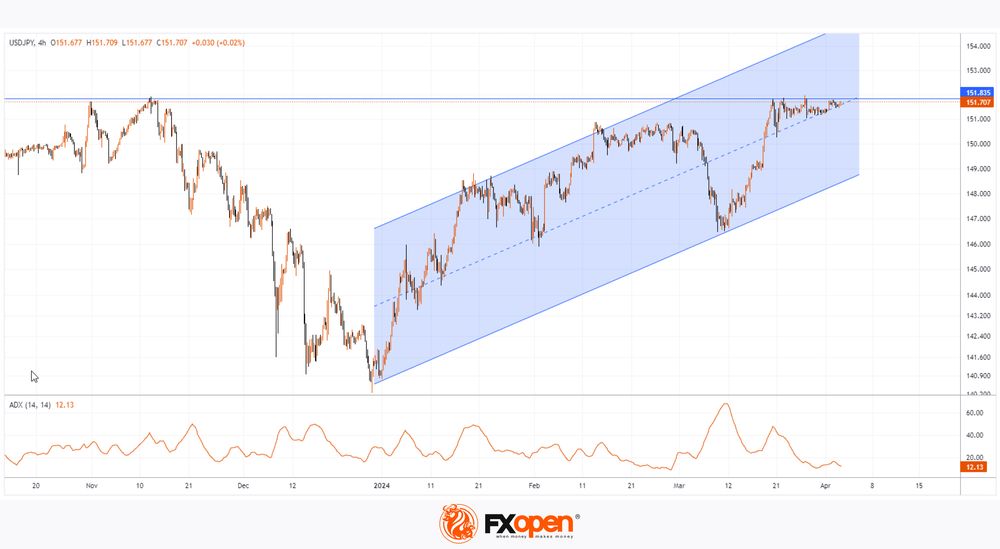
The USD/JPY chart today shows that the rate has stabilized at 152 yen per US dollar. But can we say that there is calm in the market?
Hardly.
First, it is important to note that in 2023 there was a sharp reversal of trend around the 152.00 level due to intervention by the Japanese authorities, which supported an excessively weak yen. Therefore, crossing this psychological threshold can serve as a trigger for a new intervention.
Secondly, Reuters writes about a growing volatility premium in the options market, which confirms the growing likelihood of a strong trend in the near future.
According to USD/JPY technical analysis:
→ ADX indicator is near its lows. When this situation was observed at the end of February, 2 sharp movements followed in March: a decline in USD/JPY to 146.6 and a subsequent recovery to 151.6.
→ the price of USD/JPY today is squeezed into a narrowing triangle between the level of 152.0 and the median line of the ascending channel. The price exiting the technical triangle may mean the beginning of a new trend.
Today, 2 important news are expected: after the publication of the ISM Services PMI index (at 17:00 GMT+3), a speech by the head of the Federal Reserve is expected (19:10 GMT+3). A piece of fundamental news could change the valuation of the US dollar and lead to a surge in volatility in the USD/JPY market - this should be given special attention, given the arguments presented.
Trade over 50 forex markets 24 hours a day with FXOpen. Take advantage of low commissions, deep liquidity, and spreads from 0.0 pips. Open your FXOpen account now or learn more about trading forex with FXOpen.
This article represents the opinion of the Companies operating under the FXOpen brand only. It is not to be construed as an offer, solicitation, or recommendation with respect to products and services provided by the Companies operating under the FXOpen brand, nor is it to be considered financial advice.
Gold Hits Record High; Silver Peaks on Fed Rate Cut Speculation
Gold prices have soared to an all-time high of 2288.00 USD per troy ounce, while silver reached its highest in two years, driven by speculation surrounding the US Federal Reserve's monetary policy. This surge followed comments from two Fed officials, Mary Daly of the FRB San Francisco and Loretta J. Mester of Cleveland. Both anticipate three rate cuts by the Fed in 2024, although they emphasised there is no immediate need for these adjustments.
The anticipation of a more accommodative monetary policy has been the primary driver behind gold's significant 11% price increase this year, demonstrating substantial gains for what is typically considered a conservative investment. However, this optimism is somewhat tempered by the current US economic data, which presents a complex backdrop for the timing of these expected rate cuts.
Investors and market watchers are now eagerly awaiting remarks from the US Fed Chair Jerome Powell, who is expected to provide further insights into the Federal Reserve's monetary policy outlook soon.
Precious metals traditionally benefit in low-interest-rate environments since they do not offer yields like interest-bearing assets. This dynamic underscores the current rally in gold and silver prices.
Technical analysis of XAU/USD
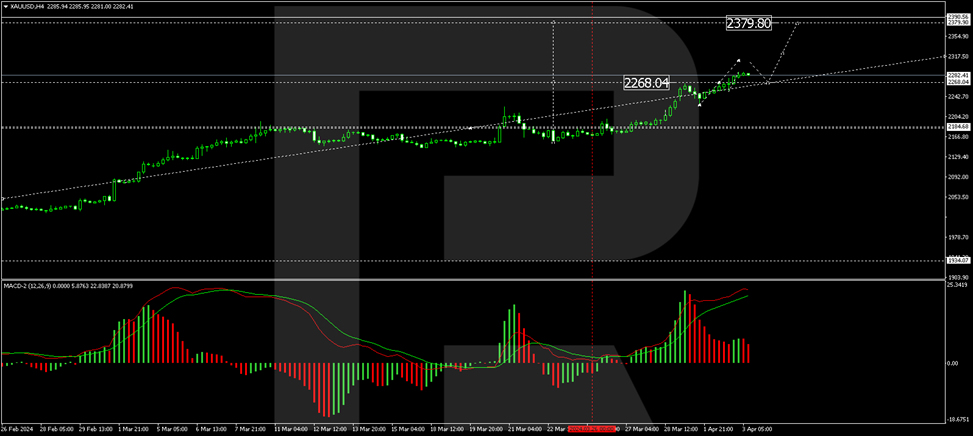
H4 chart analysis: the XAU/USD pair has corrected to 2230.00 USD and initiated a new upward wave targeting 2379.80 USD. Following this target, a correction towards 2270.00 USD is anticipated before the price potentially moves towards 2430.00 USD. The MACD indicator, with its signal line well above zero and trending upward, supports this bullish scenario.
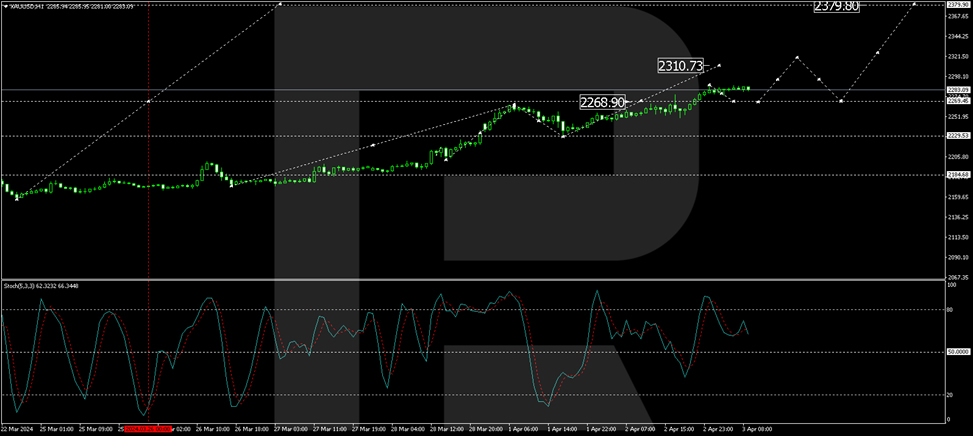
H1 chart analysis: on the H1 chart, XAU/USD has experienced a growth wave, reaching 2266.80 USD, with the market updating this peak today. A consolidation phase around this level is expected, with a breakout potentially leading to a further rise to 2310.73 USD and possibly extending towards 2379.80 USD. The Stochastic oscillator, currently below 80 and poised to drop to 50 before rising again, aligns with this forecast.
Eurozone CPI slows to 2.4% in Mar, core down to 2.9%, below expectations
Eurozone headline CPI slowed from 2.6% yoy to 2.4% yoy in March, below expectation of 2.5% yoy. CPI core (ex energy, food, alcohol & tobacco) slowed from 3.1% yoy to 2.9% yoy, below expectation of 3.0% yoy.
Looking at the main components services is expected to have the highest annual rate in March (4.0%, stable compared with February), followed by food, alcohol & tobacco (2.7%, down from 3.9%), non-energy industrial goods (1.1%, down from 1.6%) and energy (-1.8%, up from -3.7%).
NZDUSD Halts Decline at 23.6% Fibonacci
- NZDUSD declines sharply within descending channel
- Drops below both 50- and 200-day SMAs to a 4-month low
- Oscillators remain deep in their negative territories
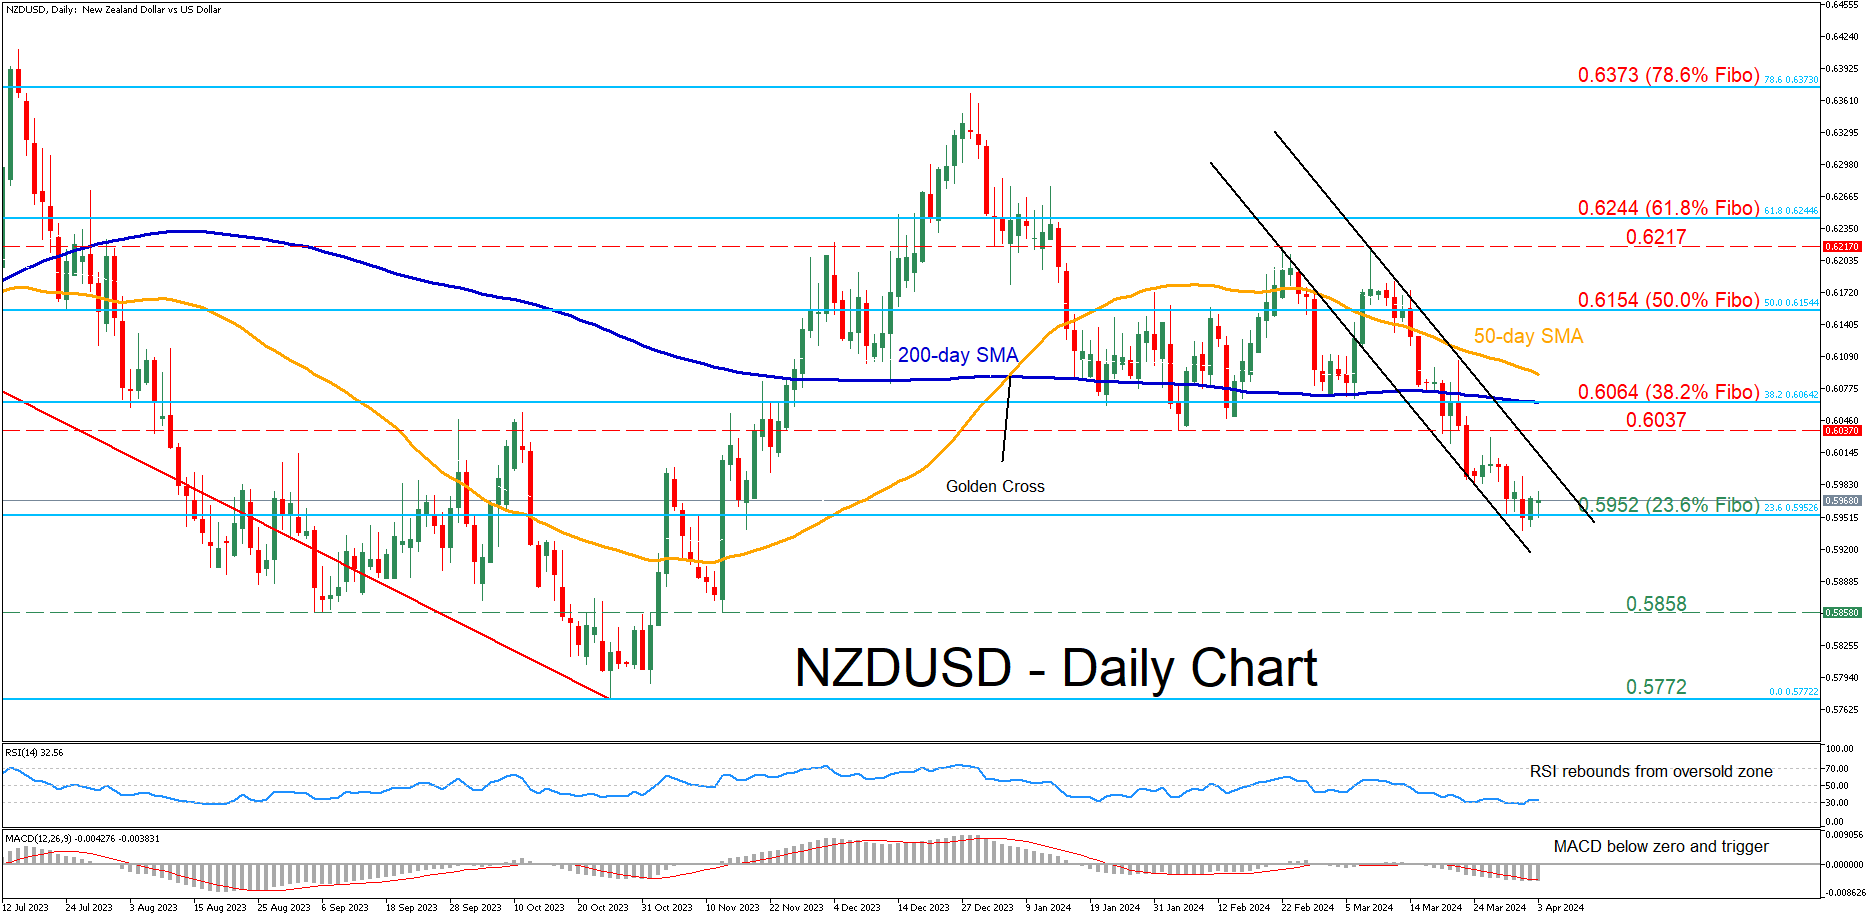
NZDUSD has been in an aggressive downtrend since its double rejection at the 0.6217 level in early March. Despite dropping to a fresh four-month bottom this week, the pair seems to be finding its footing around 0.5952, which is the 23.6% Fibonacci retracement of the 0.6536-0.5772 downtrend.
Given that both the RSI and MACD are heavily tilted to the downside, the price might revisit the 23.6% Fibo of 0.5952. A violation of that region could pave the way for the September 2023 low of 0.5858, which also held its ground in November. Failing to halt there, the pair could challenge the 2023 bottom of 0.5772.
On the flipside, should the pair rotate back higher, immediate resistance could be found at the February support of 0.6037. Further advances could then cease around the 38.2% Fibo of 0.6064, which overlaps with the 200-day simple moving average (SMA). Conquering this barricade, the bulls may attack the 50.0% Fibo of 0.6154.
Overall, NZDUSD has plummeted to a fresh four-month low, but the 23.6% Fibo seems to be curbing the bears’ efforts for further downside. Hence, a clear break below that region could accelerate the decline.